



The Project Management Growth Metrics KPI Dashboard in Excel is designed for project managers, team leaders, and organizations aiming to track, measure, and optimize project performance across various key metrics. This powerful Excel-based dashboard provides clear visibility into project progress, performance, and success, allowing for better decision-making, more efficient resource allocation, and proactive project management.
By tracking essential KPIs such as project completion rates, resource utilization, cost performance, and schedule variance, this tool enables you to evaluate the health of your projects in real-time. Whether you’re managing a single project or a portfolio of initiatives, this dashboard ensures you stay on track and make data-driven decisions.
Key Features of the Project Management Growth Metrics KPI Dashboard in Excel
📊 Comprehensive KPI Tracking
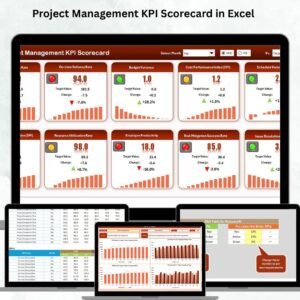
Track multiple KPIs that are vital for project success, such as Project Completion Rate, On-time Delivery Rate, Budget Variance, Cost Performance Index (CPI), Schedule Variance (SV), and many more.
📈 Real-Time Performance Metrics
View key performance indicators in real-time and compare them to target goals and previous year’s performance. This allows you to instantly spot any deviations from the plan and make necessary adjustments.
🔄 Interactive Slicers for Custom Views
Easily customize the dashboard view using interactive slicers to filter by project, team, or time period. This flexibility allows you to focus on specific data points for more detailed analysis.
📅 Historical Performance Comparison
Compare current project performance with previous periods (monthly, quarterly, or yearly), ensuring that you can identify trends, improvements, or areas that need attention.
⚙️ Customizable Dashboard Layout
The dashboard is fully customizable, allowing you to add or remove KPIs based on your project requirements, making it adaptable to any project or industry type.
📅 Project Schedule Tracking
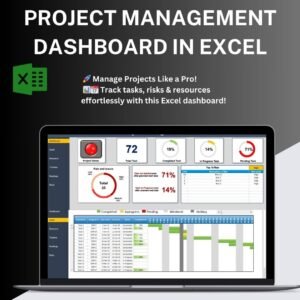
Keep track of the schedule with visual indicators showing how well the project is progressing against its planned timeline.
🔑 Resource Allocation & Utilization Metrics
Track resource utilization and availability to ensure that resources are being effectively allocated across your projects.
Why You’ll Love the Project Management Growth Metrics KPI Dashboard in Excel

✅ Optimize Project Performance
Track and manage project health in real time, ensuring resources are allocated efficiently and timelines are adhered to.
✅ Visualize Project Data
Transform complex project data into easy-to-read graphs, charts, and visual indicators that simplify analysis and decision-making.
✅ Improve Decision Making
Get actionable insights into your projects’ performance, allowing you to make data-driven decisions that improve project outcomes.
✅ Enhance Project Planning & Execution
By monitoring key metrics like on-time delivery and cost performance, you can quickly adjust plans to ensure your projects stay on course.
✅ Customizable for Any Project
No matter the type of project, this dashboard is flexible enough to suit your specific needs and requirements.
What’s Inside the Project Management Growth Metrics KPI Dashboard in Excel?
Project Completion Rate: Track the percentage of tasks or milestones completed.
On-Time Delivery Rate: Measure the percentage of tasks delivered on schedule.
Budget Variance: Monitor whether the project is within the allocated budget.
Cost Performance Index (CPI): Track the cost-efficiency of the project.
Schedule Variance (SV): Evaluate the difference between planned and actual project schedules.
Resource Utilization: Monitor how effectively project resources are used.
How to Use the Project Management Growth Metrics KPI Dashboard in Excel
1️⃣ Download the Template: Access the dashboard template instantly after purchase.
2️⃣ Enter Project Data: Input relevant project data such as task progress, costs, and resources used.
3️⃣ Track KPIs: Use the dashboard to monitor KPIs in real-time, comparing actual performance with targets.
4️⃣ Customize Views: Use the slicers to filter the data and focus on specific projects or metrics.
5️⃣ Review Project Health: Analyze trends over time to ensure projects stay on schedule and within budget.
Who Can Benefit from the Project Management Growth Metrics KPI Dashboard in Excel?
🔹 Project Managers
🔹 Team Leaders & Executives
🔹 Project Management Offices (PMOs)
🔹 Consultants & Contractors
🔹 Organizations Managing Multiple Projects
🔹 Companies Focusing on Process Optimization and Efficiency
Ensure that your projects stay on track and deliver results with the Project Management Growth Metrics KPI Dashboard in Excel. With this dashboard, you can track key metrics, optimize performance, and make more informed decisions that lead to successful project outcomes.
Click here to read the Detailed blog post
Visit our YouTube channel to learn step-by-step video tutorials
Youtube.com/@PKAnExcelExpert
Watch the step-by-step video Demo:
Compatibility and Requirements
- Works in Microsoft Excel desktop (Excel 2016 or later, or Microsoft 365).
- Interactive slicers filter by project, team or time period. Microsoft’s guide Use slicers to filter data explains how slicers work.
Frequently Asked Questions
Which project KPIs does the dashboard track?
Project completion rate, on-time delivery rate, budget variance, cost performance index (CPI), schedule variance (SV) and resource utilization.
Can I filter by project or team?
Yes. Slicers filter the view by project, team or time period.
Does it compare against targets and past periods?
Yes. KPIs are compared with target goals and with previous monthly, quarterly or yearly performance.
Can I add or remove KPIs?
Yes. The layout can be changed to add or remove KPIs for your project or industry.
Related Project Management Templates
- Project Management KPI Dashboard in Google Sheets: a Google Sheets KPI edition
- Project Management Office (PMO) KPI Dashboard in Power BI: KPIs for a PMO in Power BI
- Project Management KPI Scorecard in Excel: a scorecard view of project KPIs
- Project Management Dashboard in Excel: a full project analysis dashboard
- Project Management Pro Bundle: 9 premium project templates in one bundle
Browse all Excel KPI dashboards or the Excel project management templates.































Reviews
There are no reviews yet.