

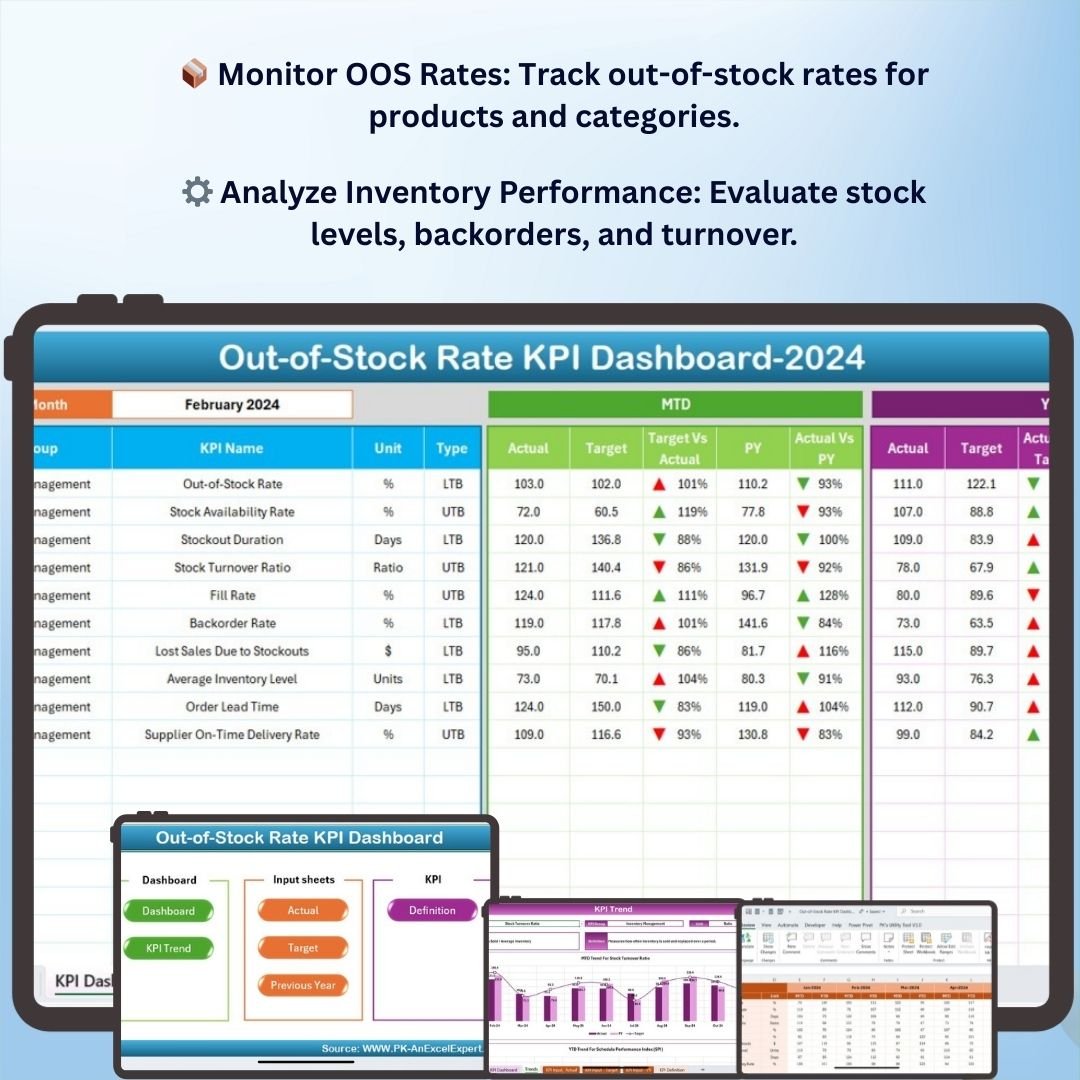
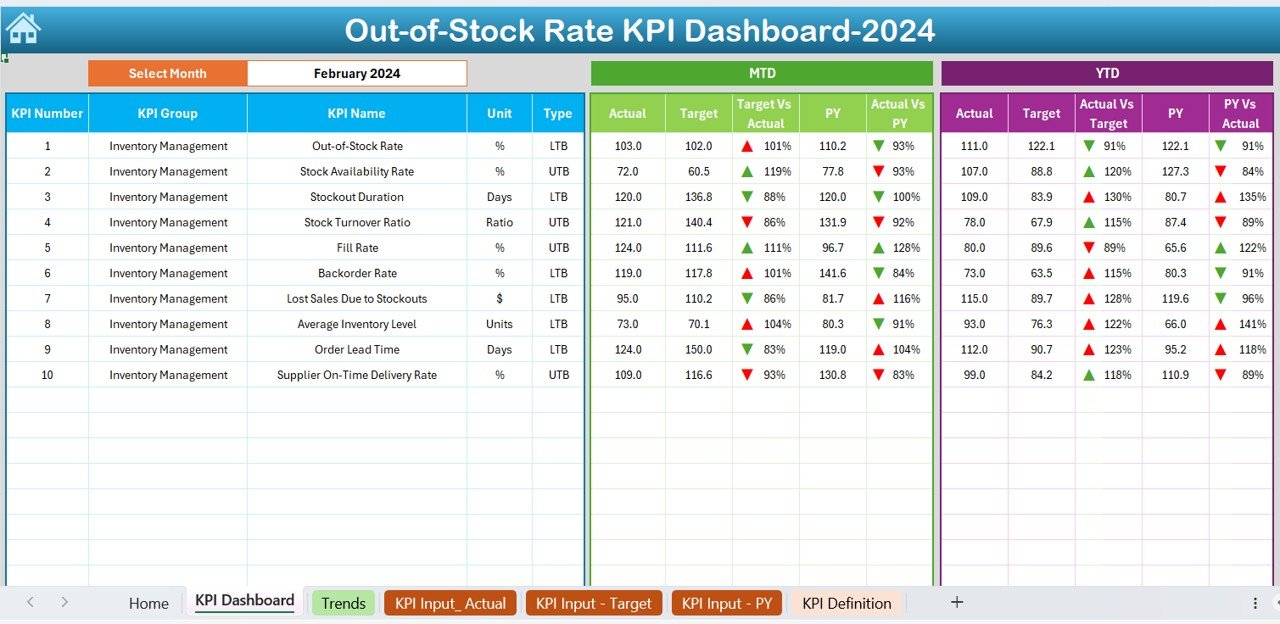
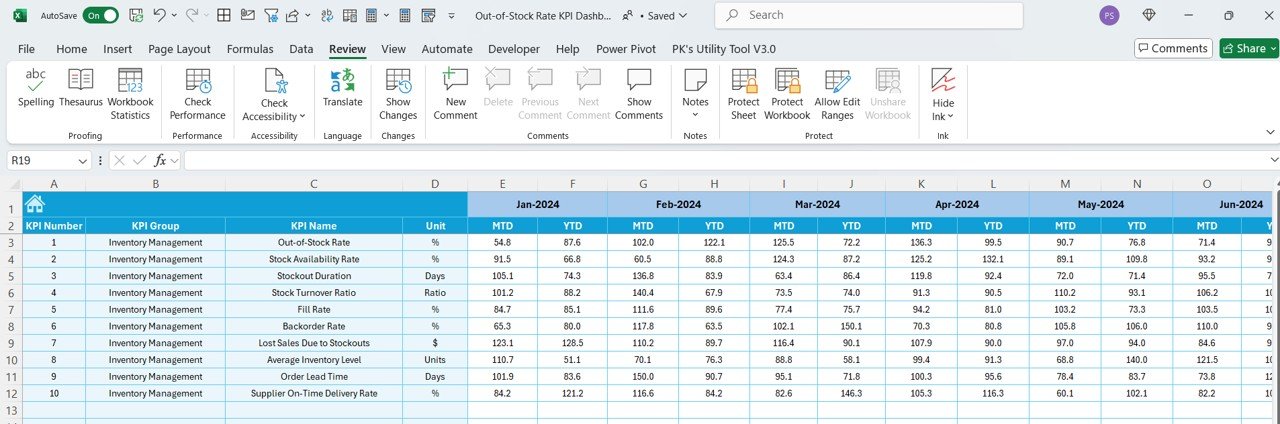
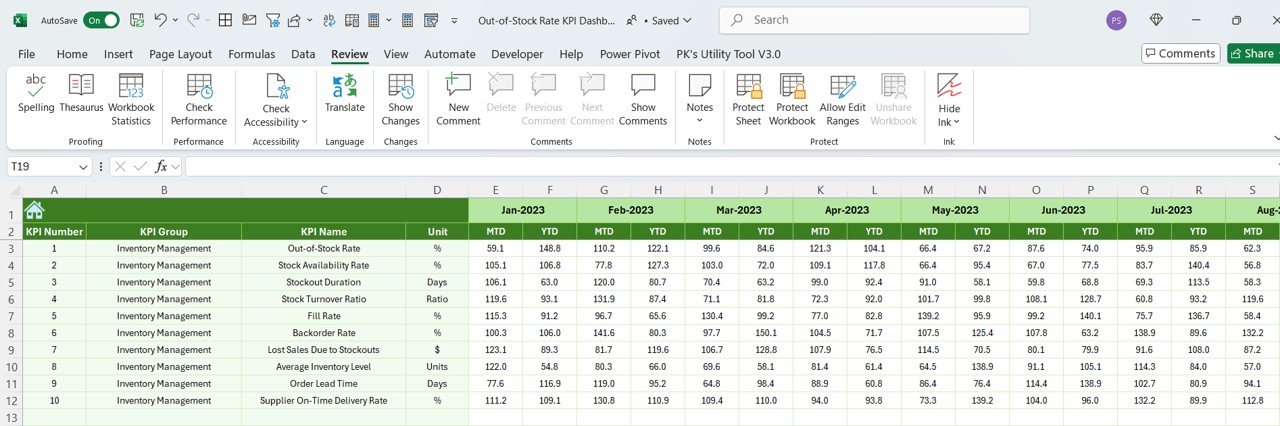

The Out-of-Stock Rate KPI Dashboard in Excel is a powerful tool designed to help businesses track and manage their stock levels efficiently. This Excel-based dashboard allows you to monitor out-of-stock (OOS) rates, analyze inventory performance, and make data-driven decisions to ensure that your products are always available for customers. Whether you’re running an e-commerce store, managing a retail chain, or overseeing a supply chain, this tool helps you keep track of stock shortages and optimize inventory management.
By using this dashboard, you can easily identify trends, track product availability, and reduce lost sales due to out-of-stock items. It provides a visual and interactive overview of key metrics like OOS rates, stock levels, and order fulfillment, helping you to prevent inventory issues before they impact customer satisfaction and sales performance.
Key Features of the Out-of-Stock Rate KPI Dashboard in Excel
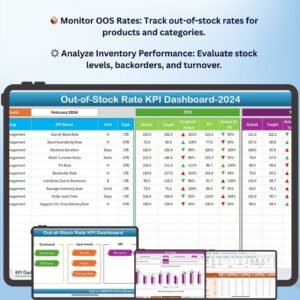
📦 Monitor Out of Stock Rates
Track the percentage of time that items are out of stock and identify which products experience the most frequent shortages. Keep tabs on OOS rates across various categories and locations for better stock management.
⚙️ Inventory Performance Analysis
Evaluate inventory performance by tracking stock levels, backorders, and product turnover. Use this information to optimize stock replenishment strategies and improve supply chain efficiency.
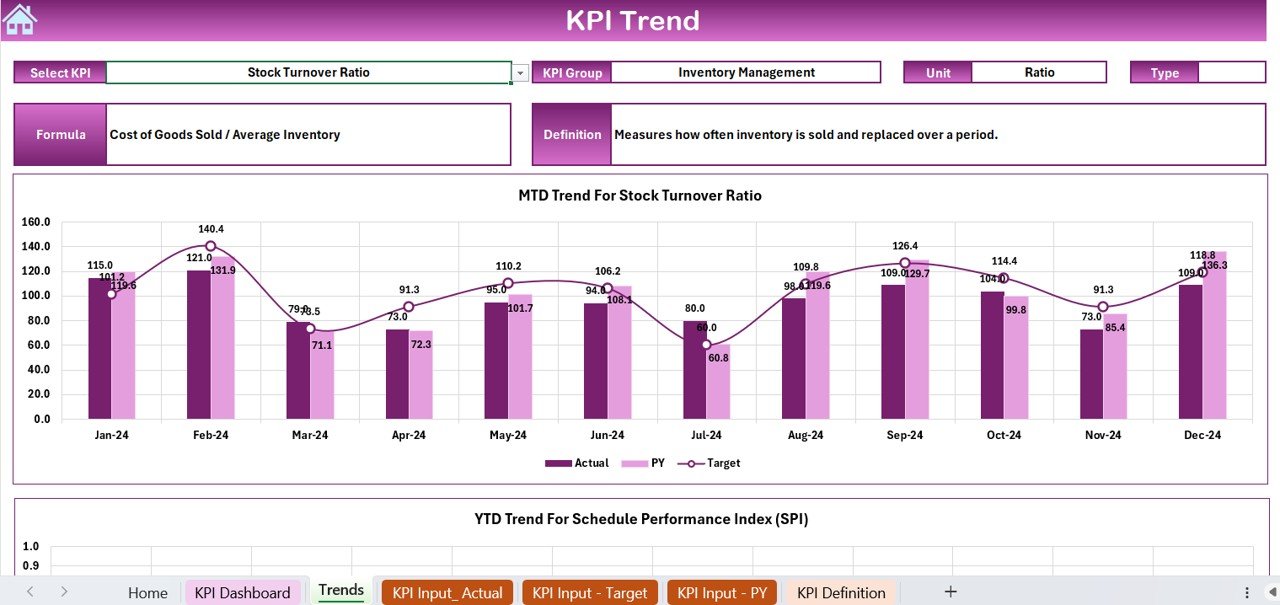
📈 Trend Analysis & Forecasting
Identify trends in stock availability and predict future OOS rates based on historical data. Use trend analysis to forecast inventory needs and reduce the chances of future stockouts.
💡 Actionable Insights for Inventory Optimization
Get actionable insights to optimize your inventory management process. Use the dashboard to assess which products need better stock management, which suppliers to rely on, and where to focus your replenishment efforts.
🖥️ Interactive Dashboard with Real-Time Data
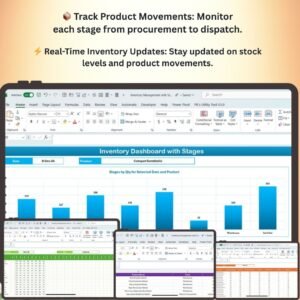
The Excel dashboard provides real-time updates on your OOS rates, inventory performance, and stock levels. The interactive features like slicers and filters allow you to drill down into specific products, categories, or timeframes for deeper analysis.
Why You’ll Love the Out-of-Stock Rate KPI Dashboard in Excel
✅ Prevent Stockouts & Improve Availability
Monitor OOS rates and ensure your products are always available. Reduce lost sales and improve customer satisfaction by addressing stock issues proactively.
✅ Optimize Inventory Management
Track inventory levels, product performance, and turnover to make more informed decisions on restocking, reducing overstock, and improving overall stock availability.
✅ Make Data-Driven Decisions
Use the real-time data and insights from the dashboard to adjust inventory policies, select reliable suppliers, and optimize the entire supply chain to prevent future OOS issues.
✅ Improve Stock Replenishment Strategies
Track product availability and identify when and where to restock, ensuring that your inventory is always optimized and stocked according to demand.
✅ Streamline Reporting & Analysis
Save time and effort by using a ready-made dashboard that automatically updates in real-time. No need for complicated manual reporting or data analysis—get all the information you need at a glance.
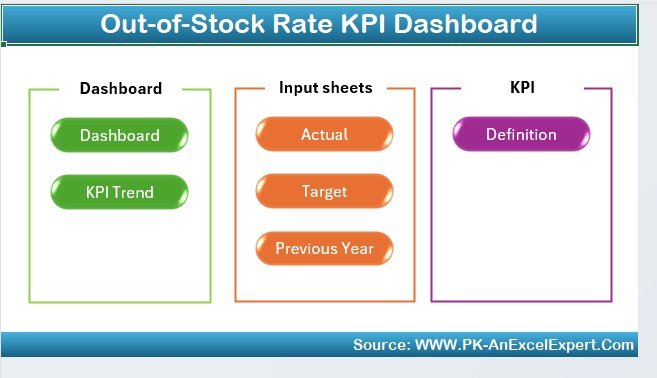
What’s Inside the Out of Stock Rate KPI Dashboard Template?
- OOS Rate Monitoring: Track out-of-stock rates for each product and category.
- Inventory Performance Tracking: Monitor stock levels, product turnover, and fulfillment rates.
- Trend Analysis & Forecasting: Identify OOS trends and forecast future stock issues.
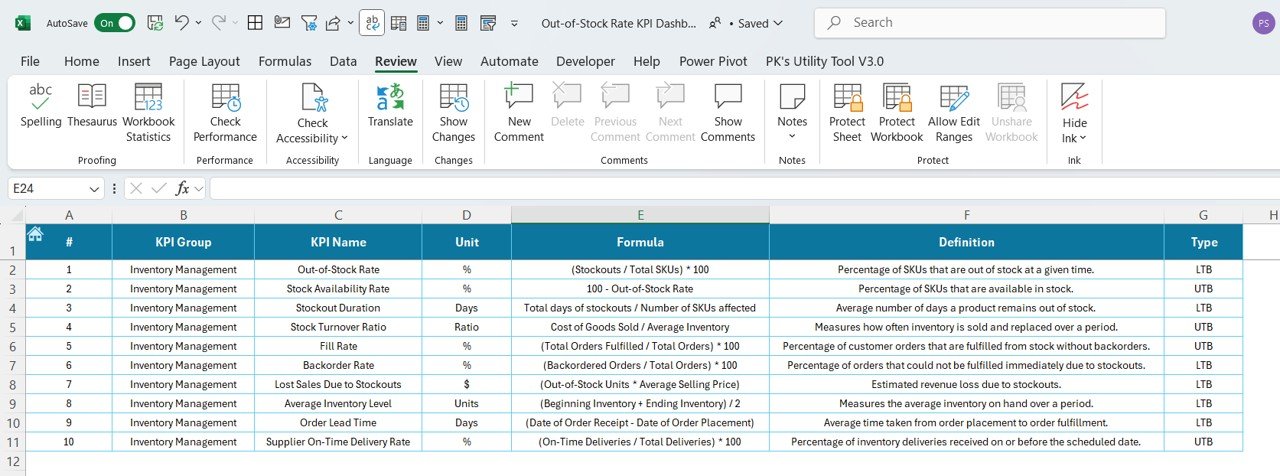
- Customizable KPIs & Metrics: Track specific KPIs like stockout frequency, sales loss due to OOS, and more.
- Real-Time Insights: Use live data to make immediate decisions and optimize inventory management.
- Interactive Layout: Filter and drill down into specific products, categories, or dates for detailed analysis.
How to Use the Out of Stock Rate KPI Dashboard in Excel
1️⃣ Download the Template: Get instant access to the Out of Stock Rate KPI Dashboard in Excel.
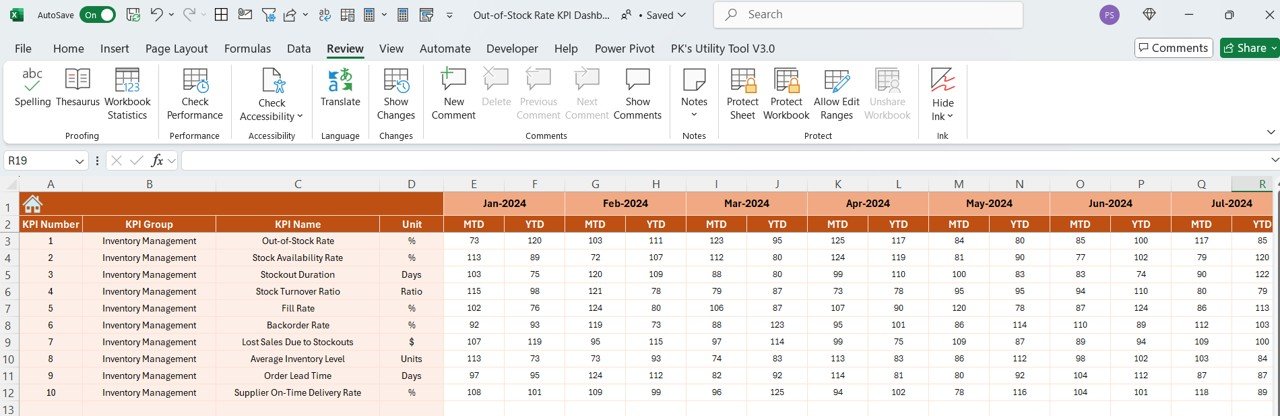
2️⃣ Input Your Data: Enter your inventory and sales data into the dashboard to populate the OOS rates and performance metrics.
3️⃣ Track & Monitor OOS Rates: Use the dashboard to track OOS rates, inventory performance, and stock levels in real time.
4️⃣ Analyze & Optimize: Use the insights to improve stock replenishment strategies, prevent stockouts, and optimize inventory.
Who Can Benefit from the Out-of-Stock Rate KPI Dashboard in Excel?
🔹 E-commerce Business Owners
🔹 Retail Managers & Inventory Specialists
🔹 Supply Chain & Operations Managers
🔹 Logistics & Procurement Teams
🔹 Sales Managers & Analysts
🔹 Anyone Responsible for Inventory Management & Stock Control
Optimize your inventory management and improve product availability with the Out-of-Stock Rate KPI Dashboard in Excel. Reduce stockouts, improve customer satisfaction, and increase sales by keeping track of OOS rates and ensuring efficient inventory replenishment.
Click here to read the Detailed blog post
Visit our YouTube channel to learn step-by-step video tutorials
Youtube.com/@PKAnExcelExpert








Reviews
There are no reviews yet.