


The Circular Economy KPI Dashboard in Excel is an innovative and essential tool for businesses looking to adopt sustainable practices and implement a circular economy model. This Excel-based dashboard helps track key performance indicators (KPIs) related to waste reduction, resource efficiency, recycling, and the environmental impact of your business operations. With this tool, you can monitor your company’s progress towards a more sustainable and circular economy, while ensuring that your business activities are environmentally responsible.
Whether you are a manufacturer, retailer, or service provider, the Circular Economy KPI Dashboard in Excel gives you the insights you need to measure and improve sustainability. Track the use of renewable resources, monitor recycling rates, reduce waste, and optimize resource consumption to transition towards a circular economy that promotes long-term environmental and financial benefits.
Key Features of the Circular Economy KPI Dashboard in Excel
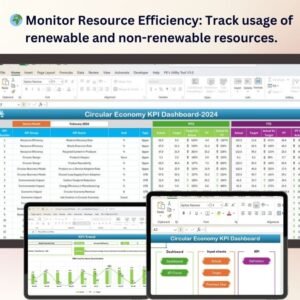
🌍 Track Resource Efficiency & Usage
Monitor how efficiently your business uses raw materials and natural resources. Track the reduction in the use of non-renewable resources and the adoption of more sustainable practices across your operations.
🔄 Measure Recycling & Waste Management
Track the recycling rates of materials used in your business, monitor waste reduction efforts, and measure the effectiveness of recycling programs. The dashboard helps you optimize waste management and contribute to a circular economy.
💡 Assess Renewable Energy Consumption
Measure the percentage of energy your business uses from renewable sources. This KPI helps ensure that your operations are aligned with sustainability goals and supports the reduction of carbon emissions.
📈 Monitor Circular Business Model Metrics
Track the transition towards a circular business model by measuring key metrics such as product lifecycle extension, product reuse, and the implementation of closed-loop systems in your production processes.
🖥️ Interactive & Real-Time Insights
The dashboard provides real-time data on sustainability KPIs, offering dynamic charts, slicers, and filters to analyze your business’s environmental performance and make data-driven decisions.
Why You’ll Love the Circular Economy KPI Dashboard in Excel

✅ Track Resource Efficiency
Monitor how effectively your business uses resources, ensuring that non-renewable materials are minimized, and renewable resources are maximized.
✅ Reduce Waste & Improve Recycling
Measure recycling rates and track the reduction of waste across your operations. Optimize recycling programs and reduce landfill waste.
✅ Measure Renewable Energy Usage
Track the percentage of energy used from renewable sources, helping your business meet sustainability goals and reduce environmental impact.
✅ Adopt a Circular Business Model
Track the progress of transitioning towards a circular economy model, focusing on product reuse, lifecycle extension, and closed-loop systems.
✅ Make Data-Driven Sustainability Decisions
Use real-time insights from the dashboard to improve your sustainability strategies, optimize resource use, and reduce waste, while making decisions that align with environmental goals.
What’s Inside the Circular Economy KPI Dashboard Template?
- Resource Efficiency Tracking: Monitor raw material usage, waste reduction, and the adoption of renewable resources.
- Recycling & Waste Management: Track recycling rates and waste reduction efforts to minimize environmental impact.
- Energy Consumption Tracking: Measure the percentage of energy consumed from renewable sources.
- Circular Economy Metrics: Monitor the transition towards a circular business model by tracking product reuse, recycling, and closed-loop processes.
- Real-Time Insights: Access live updates on sustainability KPIs to track progress in real-time.
- Customizable Dashboard: Tailor the dashboard to focus on the specific KPIs that matter most for your sustainability goals.
How to Use the Circular Economy KPI Dashboard in Excel
1️⃣ Download the Template: Get instant access to your Circular Economy KPI Dashboard in Excel.
2️⃣ Input Your Data: Enter your business data on resource efficiency, recycling rates, energy consumption, and waste management into the dashboard.
3️⃣ Track & Monitor KPIs: Use the dashboard to track key sustainability metrics in real-time.
4️⃣ Analyze & Optimize: Use insights from the dashboard to improve resource efficiency, waste reduction, and the adoption of renewable energy.
Who Can Benefit from the Circular Economy KPI Dashboard in Excel?
🔹 Sustainability Managers & Environmental Teams
🔹 Operations & Supply Chain Managers
🔹 Manufacturers & Retailers
🔹 E-commerce & Service Providers with Sustainability Goals
🔹 Business Owners & Entrepreneurs Committed to Sustainable Practices
🔹 Anyone Looking to Adopt Circular Economy Practices and Improve Environmental Impact
Track your business’s sustainability efforts and move towards a circular economy with the Circular Economy KPI Dashboard in Excel. Optimize resource efficiency, reduce waste, and improve your environmental footprint while making data-driven decisions for long-term business success.
Click here to read the Detailed blog post
Visit our YouTube channel to learn step-by-step video tutorials
Youtube.com/@PKAnExcelExpert


Reviews
There are no reviews yet.