
Running a subscription business without structured reporting is like flying blind. Revenue leaks quietly. Discounts go unnoticed. Churn risks stay hidden. And management decisions become slow and reactive.
But what if you could track subscriptions, revenue, devices, regions, and monthly growth — all in one powerful Excel dashboard?
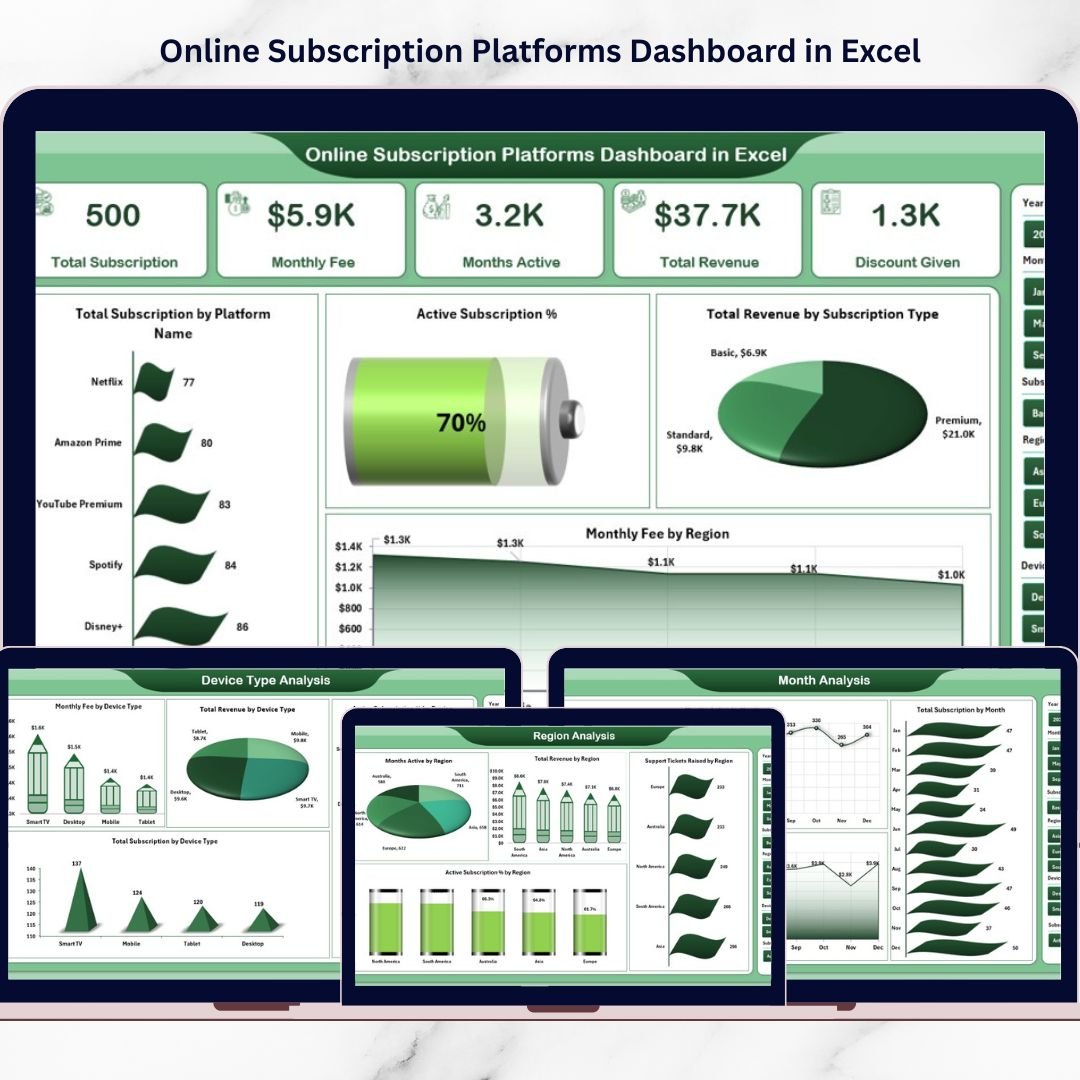
The Online Subscription Platforms Dashboard in Excel is a ready-to-use, interactive reporting system that transforms raw subscription data into clear, visual, and actionable insights. Instead of juggling multiple spreadsheets, you gain one centralized performance command center.
If you want better visibility, smarter pricing decisions, and stronger revenue control — this dashboard is built for you.
🚀 Key Feature of Online Subscription Platforms Dashboard in Excel
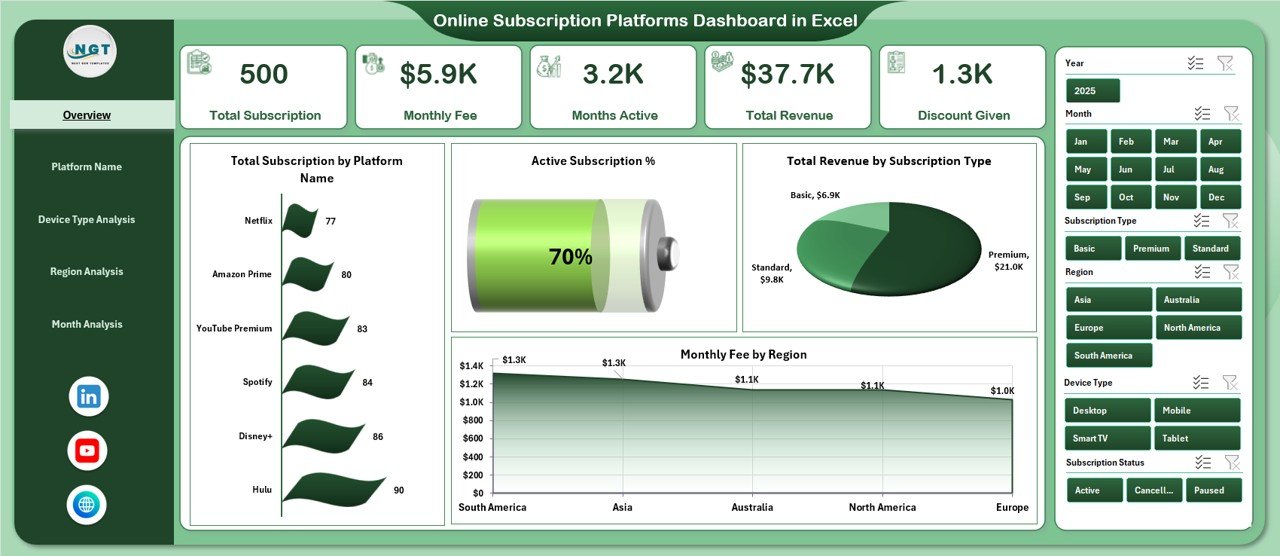
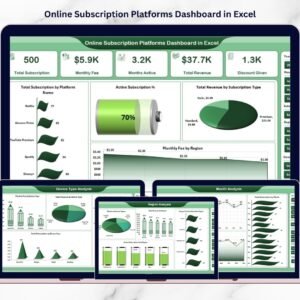
This dashboard includes 5 fully structured analytical pages, each designed to give deep subscription insights.
📊 Interactive Overview Page – Instantly view Total Subscriptions, Active Subscriptions, Total Revenue, and Monthly Fees.
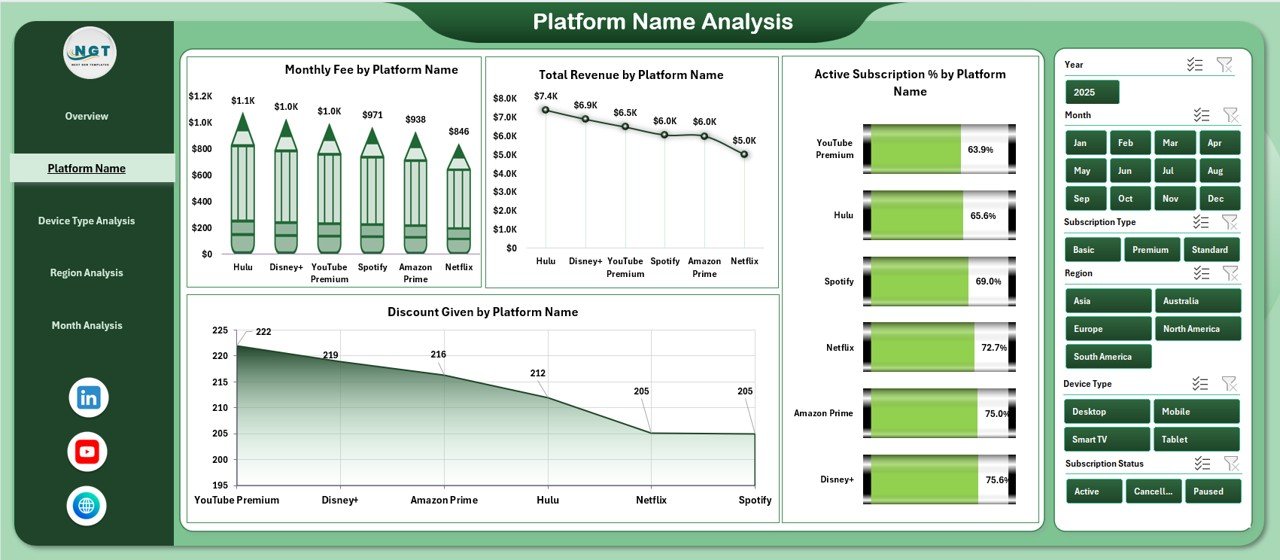
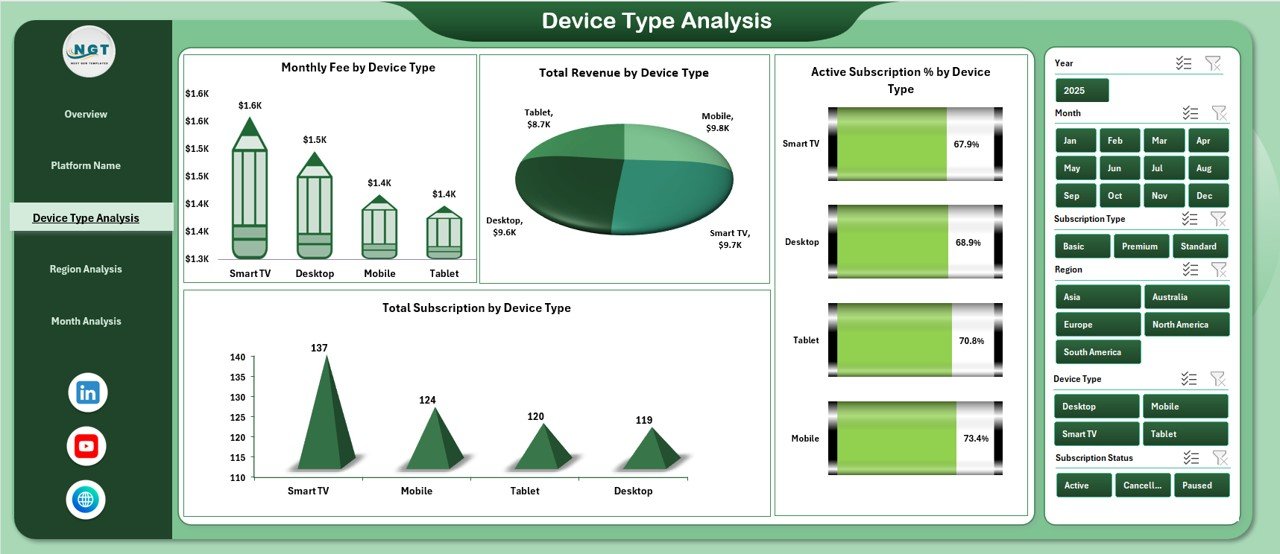
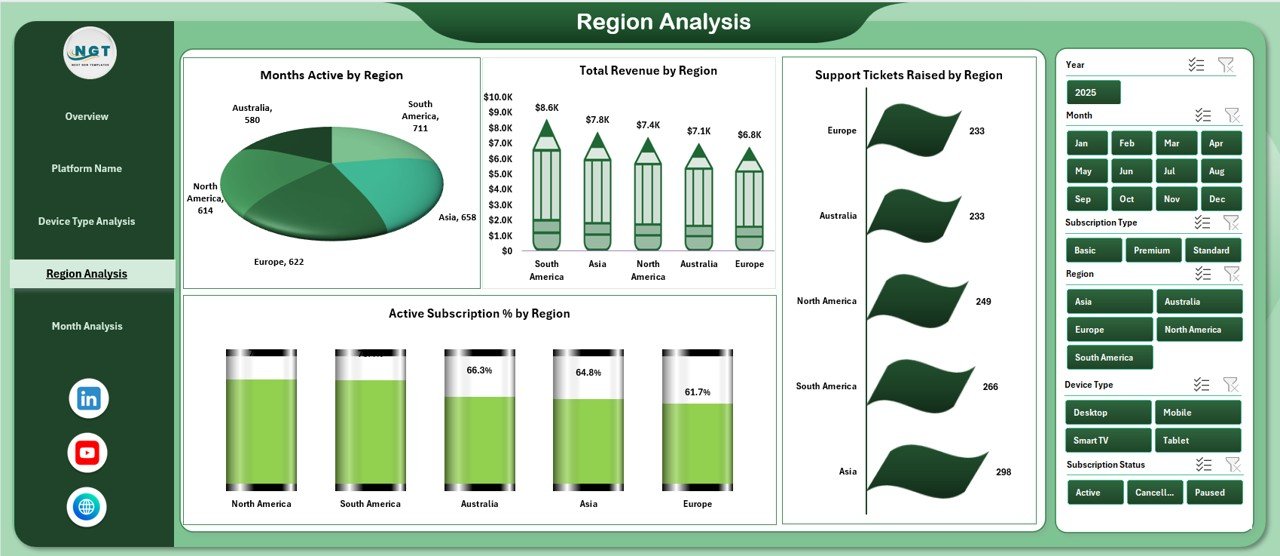
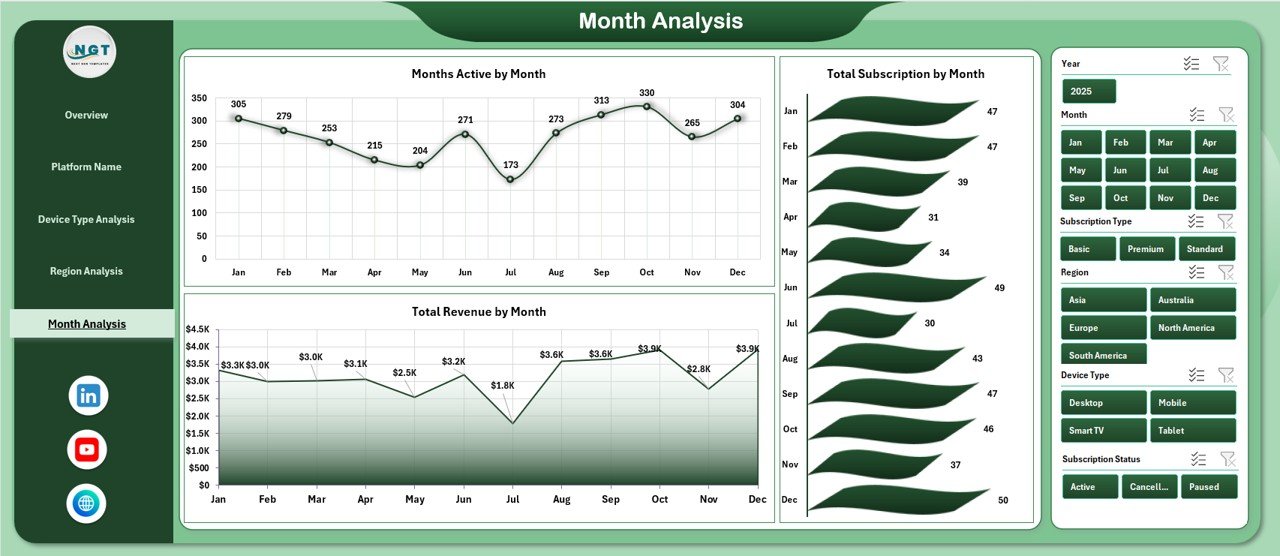
🎯 Right-Side Slicers – Filter by Platform, Region, Device Type, Subscription Type, and Month in seconds.
📈 Platform Performance Analysis – Identify your highest-earning platforms and discount impact.
📱 Device Type Insights – Track revenue and subscriptions across mobile, desktop, tablet, and smart TV.
🌍 Regional Performance Monitoring – Compare revenue and support tickets by region.
📅 Month Trend Analysis – Analyze revenue growth and seasonal subscription patterns.
🔄 Pivot Table Powered System – Automatically updates when you refresh data.
Because it is built using Excel Pivot Tables and dynamic charts, the dashboard remains flexible, powerful, and easy to use.
📦 What’s Inside the Online Subscription Platforms Dashboard in Excel
This template is more than just charts — it is a structured reporting ecosystem.
Inside, you get:
✅ 5 analytical dashboard pages
✅ Clean and organized Support Data Sheet
✅ Page Navigator for smooth switching
✅ Dynamic KPI Cards
✅ Structured Excel Tables for automatic refresh
✅ Ready-to-use performance metrics
✅ Fully customizable design
The Support Sheet stores critical data such as:
Subscription ID
Platform Name
Subscription Type
Device Type
Region
Monthly Fee
Revenue
Discount
Active Status
Support Tickets
Month & Year
Because the data structure is clean, your dashboard works seamlessly without errors.
⚙️ How to Use the Online Subscription Platforms Dashboard in Excel
Using this dashboard is simple and efficient.
1️⃣ Enter or paste your subscription data into the Support Sheet.
2️⃣ Ensure all data is formatted as an Excel Table.
3️⃣ Refresh Pivot Tables.
4️⃣ Use slicers to filter by platform, region, device, or month.
5️⃣ Analyze trends and identify growth opportunities.
Within minutes, you get a complete view of your subscription performance.
No advanced Excel skills required — basic knowledge of Pivot Tables is enough.
👥 Who Can Benefit from This Online Subscription Platforms Dashboard in Excel
This dashboard is ideal for:
💼 SaaS Companies
🎬 Streaming Platforms
📚 E-Learning Platforms
📦 Subscription Box Businesses
🌐 Membership-Based Websites
💻 Digital Service Providers
If your business relies on recurring revenue, this dashboard helps you monitor growth and reduce churn.
💡 Why This Dashboard Increases Profitability
✔ Highlights high-revenue platforms
✔ Detects excessive discounts
✔ Tracks regional revenue gaps
✔ Identifies device-based growth opportunities
✔ Monitors support tickets for service improvement
✔ Supports data-driven pricing decisions
✔ Enables faster monthly review meetings
Instead of guessing what drives revenue, you see it clearly.
This dashboard turns raw subscription data into strategic intelligence.
### Click here to read the Detailed blog post
Visit our YouTube channel to learn step-by-step video tutorials
Youtube.com/@PKAnExcelExpert
Watch the step-by-step video tutorial:
Compatibility and Requirements
- Works in Microsoft Excel desktop (Excel 2016 or later, or Microsoft 365).
- The dashboard uses slicers to filter by platform, region, device type, subscription type and month. Microsoft explains them in Use slicers to filter data.
Frequently Asked Questions
How many dashboard pages does the template have?
Five analytical pages: an interactive overview, platform performance, device type insights, regional performance and month trend analysis. It also has a Support Sheet for your data and a page navigator.
Which fields go into the Support Sheet?
Subscription ID, platform name, subscription type, device type, region, monthly fee, revenue, discount, active status, support tickets, and month and year.
How do I update the dashboard with new data?
Paste your subscription data into the Support Sheet as an Excel Table, then refresh the Pivot Tables. The charts and KPI cards update from there.
Which filters can I use?
The slicers on the right side filter by platform, region, device type, subscription type and month.
Is there a Power BI version?
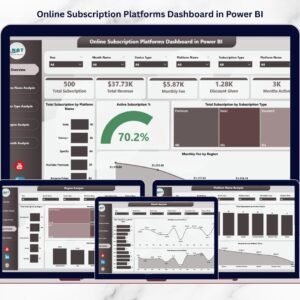
Yes. See the Online Subscription Platforms Dashboard in Power BI.
Related Subscription Templates
- Online Subscription Platforms Dashboard in Power BI: the same topic in Power BI
- Online Subscription Platforms KPI Dashboard in Excel: a KPI-focused view for subscription platforms
- Subscription Business KPI Dashboard in Google Sheets: a Google Sheets option for subscription KPIs
- Subscription and SaaS Renewal Calendar in Excel: keeps track of renewal dates
Browse all Excel dashboards.