
Keeping your office safe isn’t just about having security staff and cameras—it’s about tracking, analyzing, and responding to incidents in real time. The Office Security Incident Dashboard in Google Sheets is a ready-to-use tool designed to help organizations of all sizes maintain workplace security, improve response times, and prevent risks before they escalate.
With this dashboard, security managers and administrators can monitor incidents, measure team efficiency, and identify high-risk areas—all within an easy-to-use, collaborative Google Sheets interface.
✨ Key Features of the Office Security Incident Dashboard
-
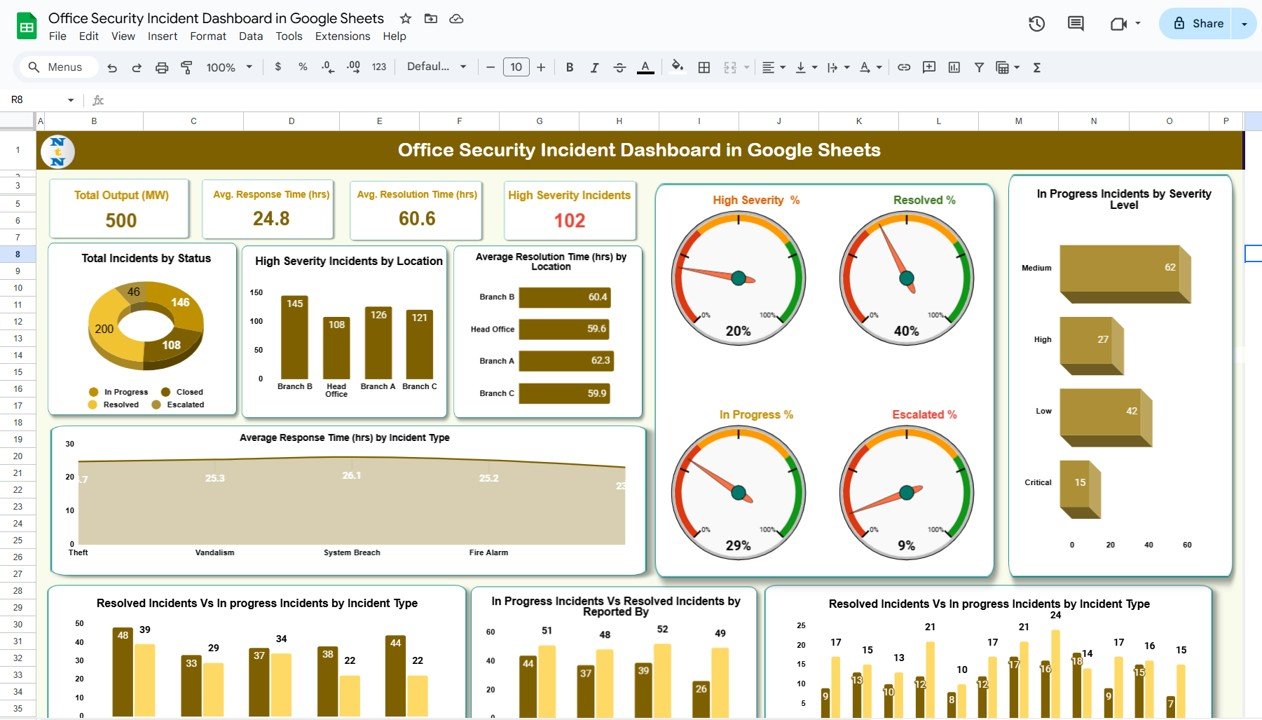
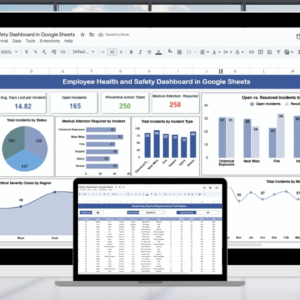
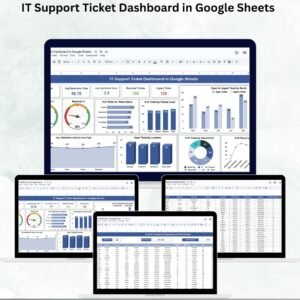
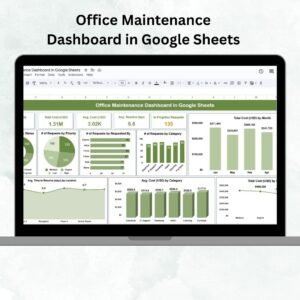
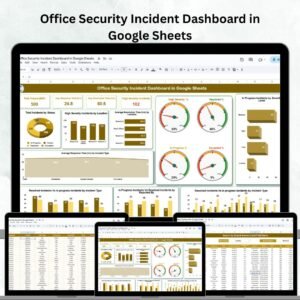
📊 Dynamic Dashboard Sheet – A high-level snapshot that updates automatically with every entry. View total incidents, high-severity cases, and average response and resolution times—all at a glance.
-
📈 Powerful Visuals – Charts display incident trends by type, status, location, and reporter, making it easy to pinpoint bottlenecks and recurring risks.
-
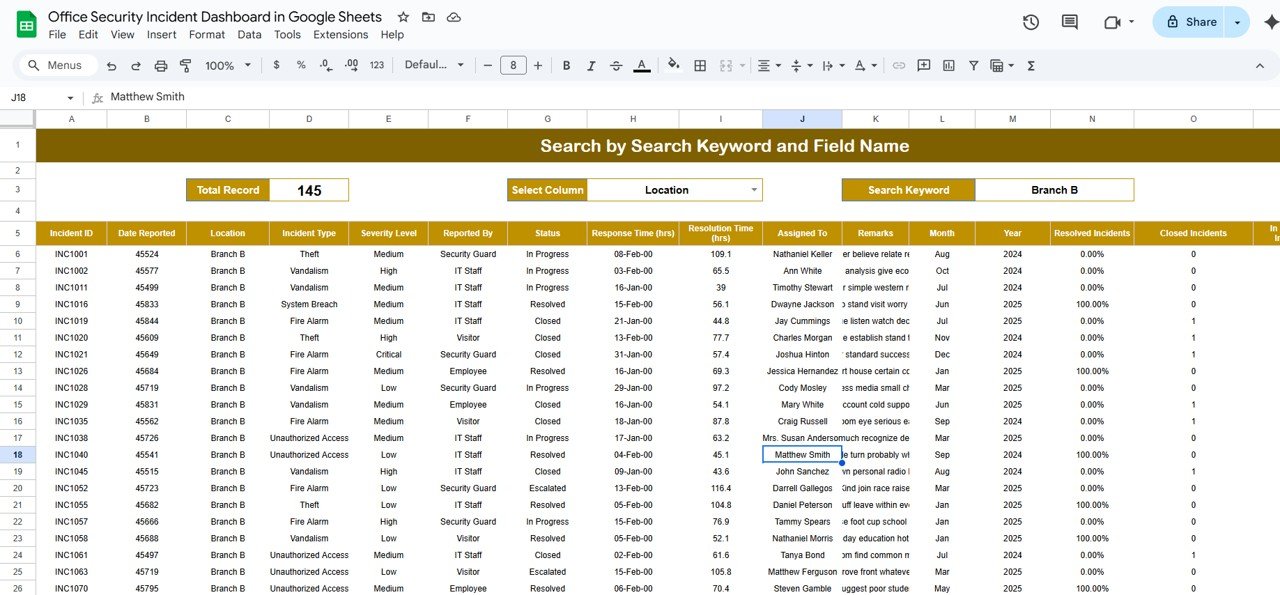
🔍 Search Functionality – A dedicated Search Sheet allows you to instantly filter and find specific incidents using keywords, incident types, or locations.
-
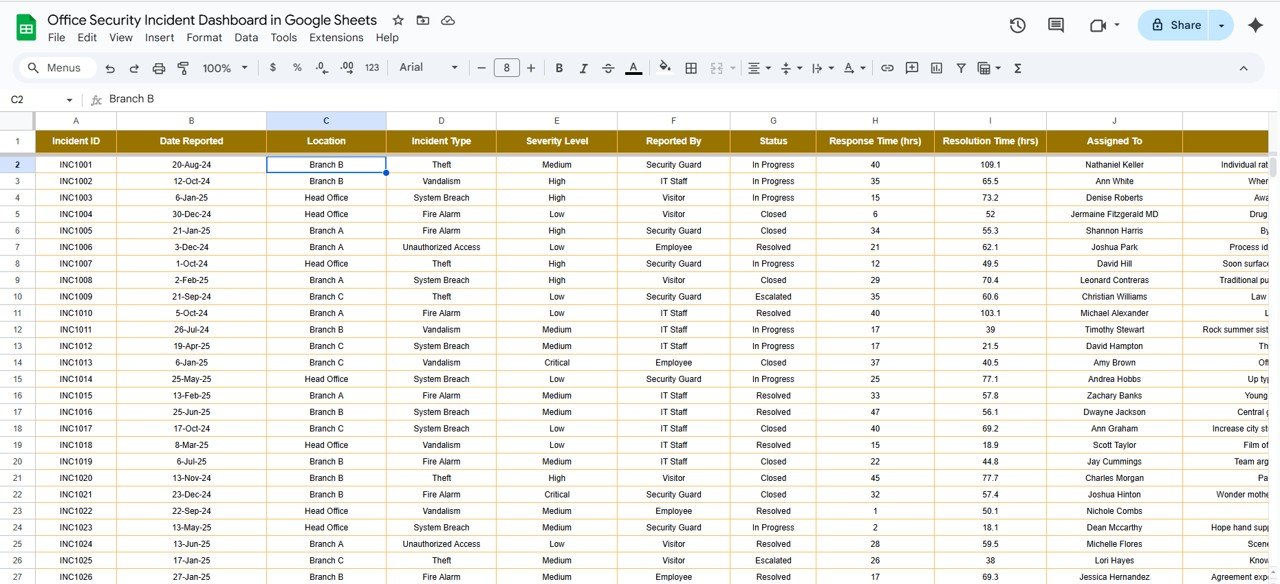
🗂 Structured Data Sheet – Capture every detail of an incident including ID, type, severity, location, response time, resolution time, and escalation status.
-
⚡ Real-Time Collaboration – Built in Google Sheets, multiple security team members can update and access the dashboard at the same time.
📂 What’s Inside the Office Security Incident Dashboard
This template is structured into three essential sheets:
-
Dashboard Sheet Tab – The command center. Track open, in-progress, and resolved incidents with cards and charts. Quickly identify high-severity incidents by location or type.
-
Search Sheet Tab – Save time by filtering incidents with just a keyword. Whether you need to find unresolved cases or track specific departments, the Search tool delivers results instantly.
-
Data Sheet Tab – The backbone of the dashboard. Record incident data systematically and watch your dashboard update in real time.
🛠 How to Use the Office Security Incident Dashboard
-
Enter Incident Data – Record every case in the Data Sheet (ID, type, severity, location, reporter, status).
-
View Dashboard Insights – Instantly visualize metrics like total cases, average response times, and severity breakdowns.
-
Use Search Function – Quickly retrieve incidents for reporting, audits, or analysis.
-
Analyze Trends – Spot recurring incidents by type or location to improve preventive measures.
-
Take Action – Use insights to allocate resources, train staff, and strengthen office security policies.
No coding or technical expertise is required—just plug in the numbers and watch insights flow.
👥 Who Can Benefit from This Dashboard
-
Security Managers 🛡️ – Monitor team efficiency and critical incident resolution.
-
Office Administrators 🏢 – Ensure workplace safety and compliance.
-
Operations Teams ⚙️ – Track incident trends to optimize preventive measures.
-
HR & Compliance Teams 📑 – Use visual insights for audits and reporting.
-
Leadership Teams 👔 – Gain a clear view of security performance across locations.
✅ Advantages of Using the Dashboard
-
Centralized, real-time incident tracking
-
Faster response and resolution insights
-
High-severity cases flagged instantly
-
Visual trends for smarter prevention
-
Easy reporting for executives and audits
-
Collaborative access across security teams
📖 Click here to read the Detailed blog post
Watch the step-by-step video Demo:


Reviews
There are no reviews yet.