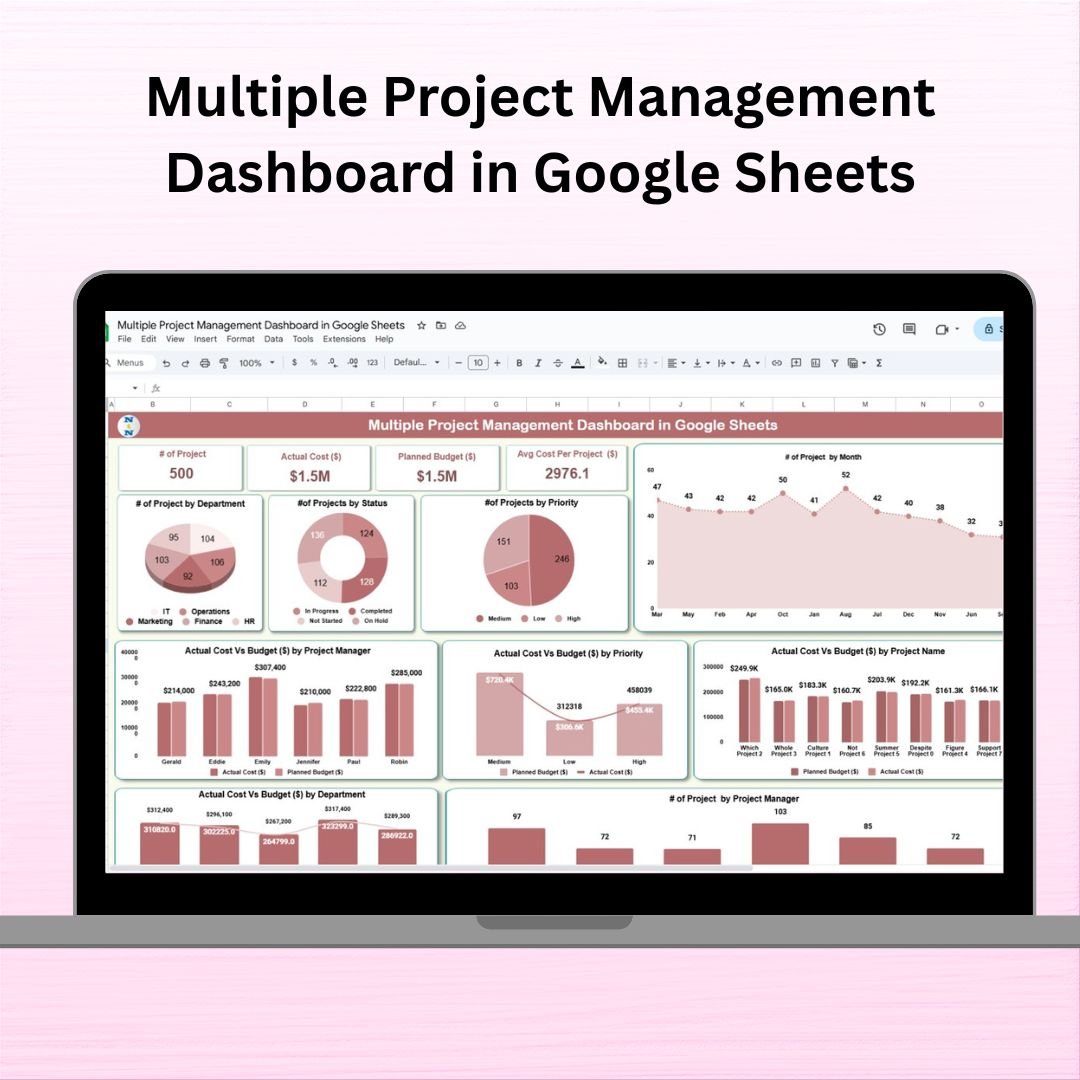
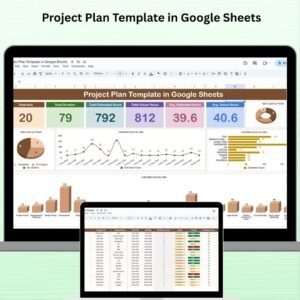
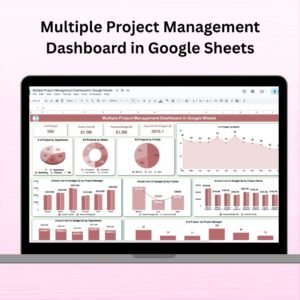
Stay on top of every project — budget, status, deadlines, team performance, and more — with the Multiple Project Management Dashboard in Google Sheets. This powerful and user-friendly tool empowers you to track multiple projects effortlessly, all in real-time and from one place. Whether you’re overseeing marketing campaigns, IT rollouts, or cross-functional initiatives, this dashboard gives you a clear picture of what’s happening, what’s lagging, and where to act — instantly. ✅

🛠️ Key Features of the Multiple Project Management Dashboard
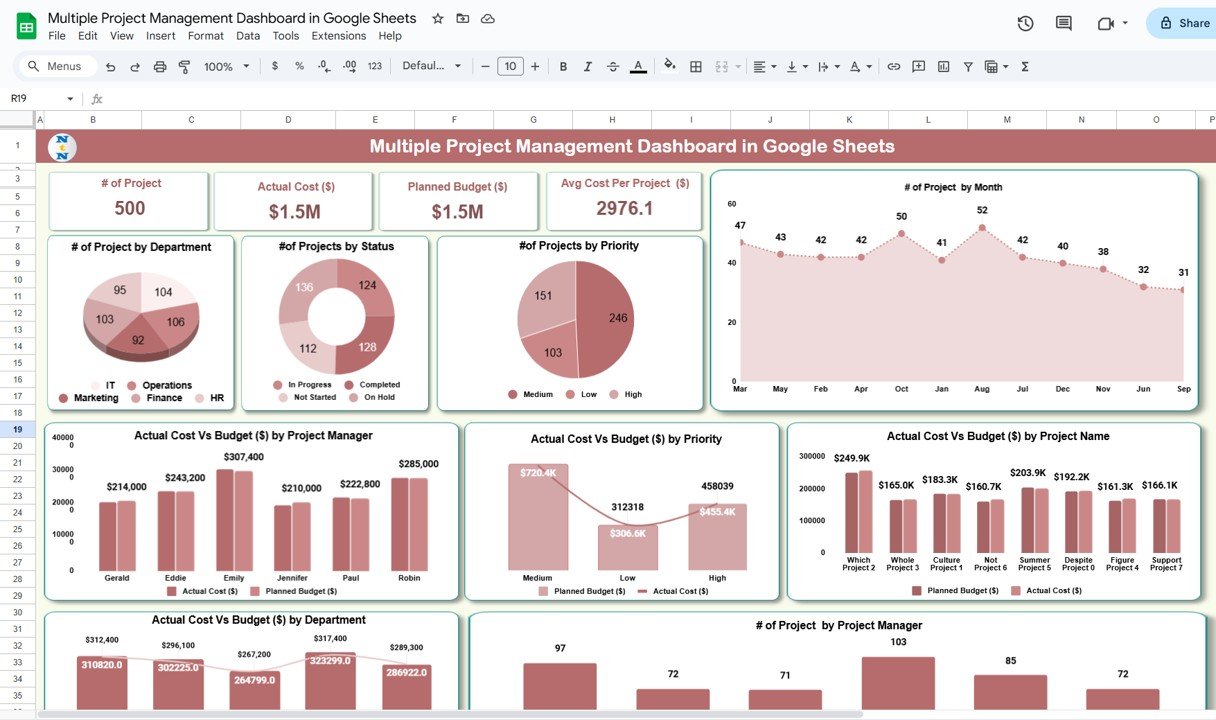
📌 Real-Time Dashboard View
-
Instantly visualize how many projects are underway, what’s completed, and what’s over budget.
-
Interactive charts and summary cards show live updates for total projects, actual costs, planned budgets, and average cost per project.
📌 Visual Reports by Key Dimensions
-
See the number of projects by department, status, priority, project manager, and month.
-
Spot bottlenecks and performance gaps across any function with one glance.
📌 Budget vs. Actual Tracking
-
Compare actual expenses vs. planned budgets by project, priority, manager, and department.
-
Easily identify which projects are going off-track before it’s too late.
📦 What’s Inside the Multiple Project Management Dashboard
📁 Dashboard Sheet Tab
This is the control center. It includes:
-
KPI Cards: Total Projects, Planned Budget, Actual Cost, Avg. Cost/Project
-
9 Auto-Updating Charts (by department, priority, manager, etc.)
-
Budget Variance Analysis visuals by all key groups.
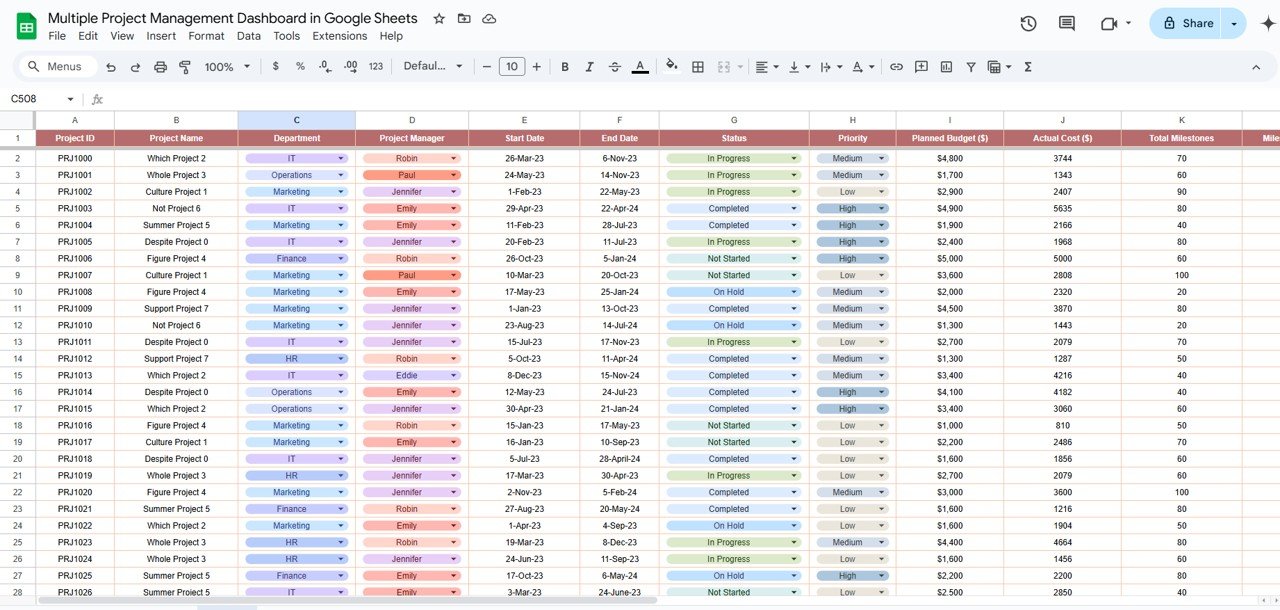
📁 Data Sheet Tab
-
Track and update all your project-level data here.
-
Fields include Project Name, Budget, Cost, Start Date, End Date, Status, Priority, Manager, Department — and more!
📈 How to Use the Product
-
Enter Your Project Data: Add project-level details in the Data Sheet tab (name, budget, cost, etc.)
-
Review Auto-Charts: Instantly see updated charts and metrics in the Dashboard tab.
-
Monitor KPIs: Track progress, spending, and team workload live.
-
Make Adjustments: Identify red flags quickly and take corrective actions.
-
Collaborate Freely: Share with your team — it’s Google Sheets, after all!
🎯 Who Can Benefit from This Dashboard?
✅ Project Managers – Track progress, status, and budget variance in one place.
✅ Marketing/IT/Ops Leaders – Oversee team performance across multiple initiatives.
✅ Finance Teams – Compare cost vs. budget across departments.
✅ Small Businesses & Startups – Manage all client or internal projects without expensive software.
✅ Remote Teams – Stay aligned in real-time with collaborative access and updates.
🚀 Why You’ll Love It
-
No coding or Power BI needed — fully Excel-style, simple to use!
-
Google Sheets means real-time collaboration and auto-saving.
-
Fully editable, reusable, and print-ready.
-
Saves HOURS every week on project reporting! 🕒


Reviews
There are no reviews yet.