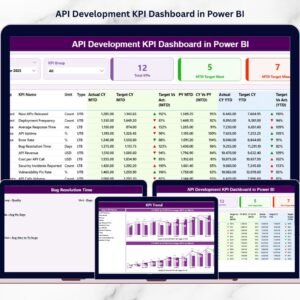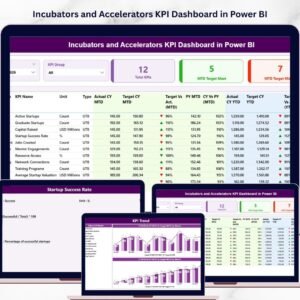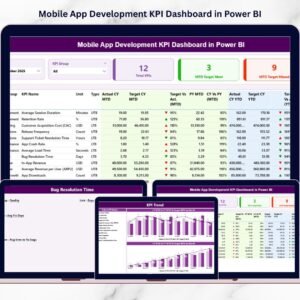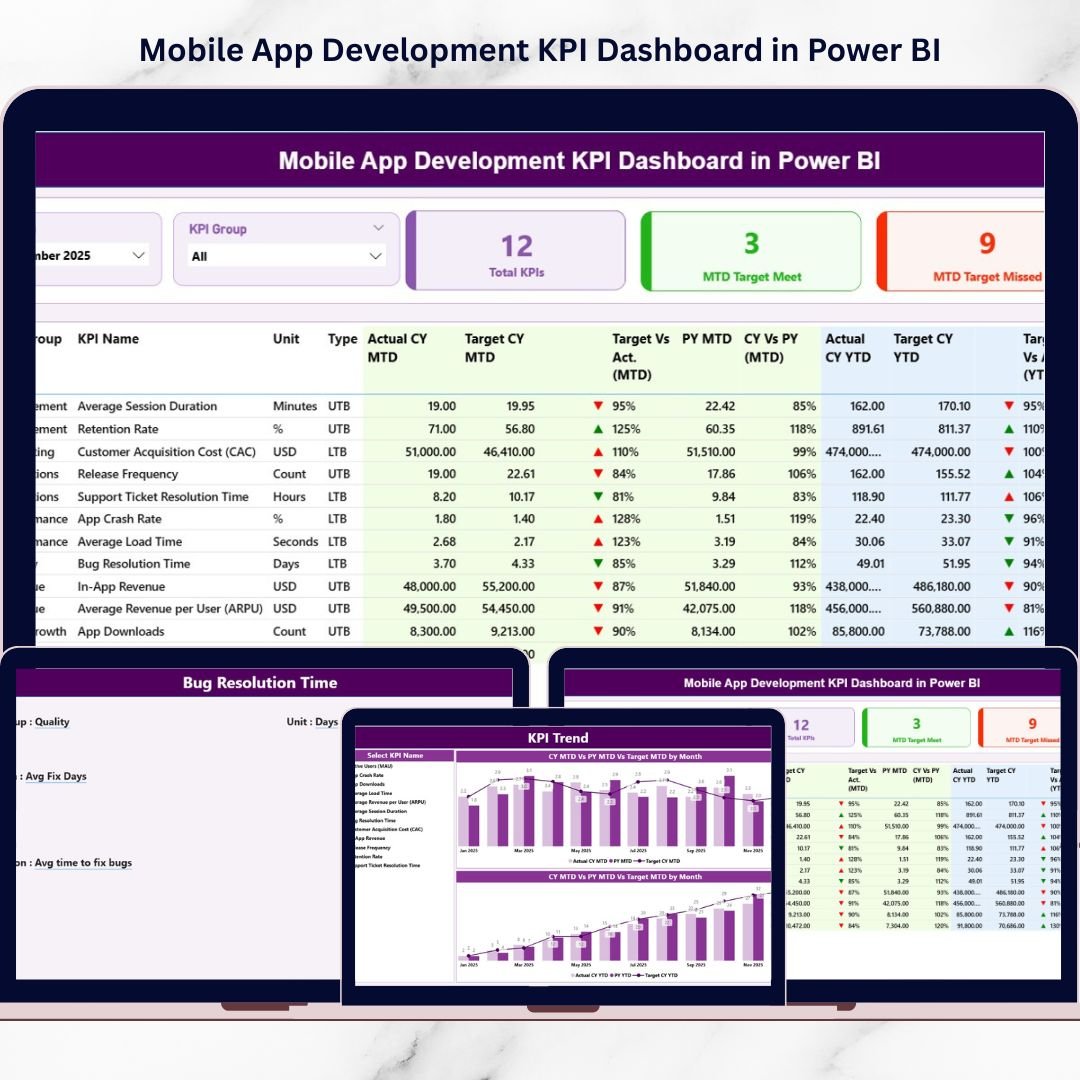
Introducing the Mobile App Development KPI Dashboard in Power BI — a ready-to-use, interactive reporting solution designed for product managers, developers, QA teams, and executives who demand real-time visibility.
This dashboard centralizes performance, quality, growth, and revenue KPIs into one structured system — with MTD, YTD, and previous year comparisons built in.
No confusion. No manual calculations. Just powerful, data-driven insight.
🚀 Key Feature of Mobile App Development KPI Dashboard in Power BI
📊 3 Interactive Dashboard Pages – Summary, KPI Trend, and KPI Definition.
📅 MTD & YTD Tracking – Monitor short-term and long-term performance together.
🎯 Target vs Actual Comparison – Instantly detect performance gaps.
🔁 Current Year vs Previous Year Analysis – Measure real growth trends.
📈 Visual KPI Indicators (▲ / ▼) – Green & Red performance signals.
🧩 Smart Slicers – Filter by Month and KPI Group instantly.
📂 Excel Data Integration – Simple monthly updates with automatic refresh.
📦 What’s Inside the Mobile App Development KPI Dashboard in Power BI
This structured Power BI solution includes 3 powerful pages designed for clarity and strategic control.
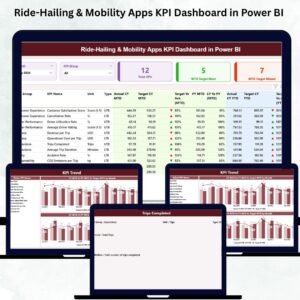
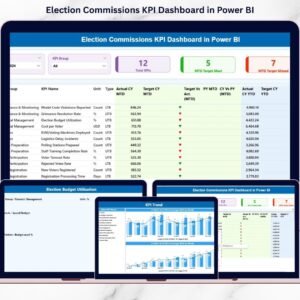
🧭 1️⃣ Summary Page – The Performance Command Center
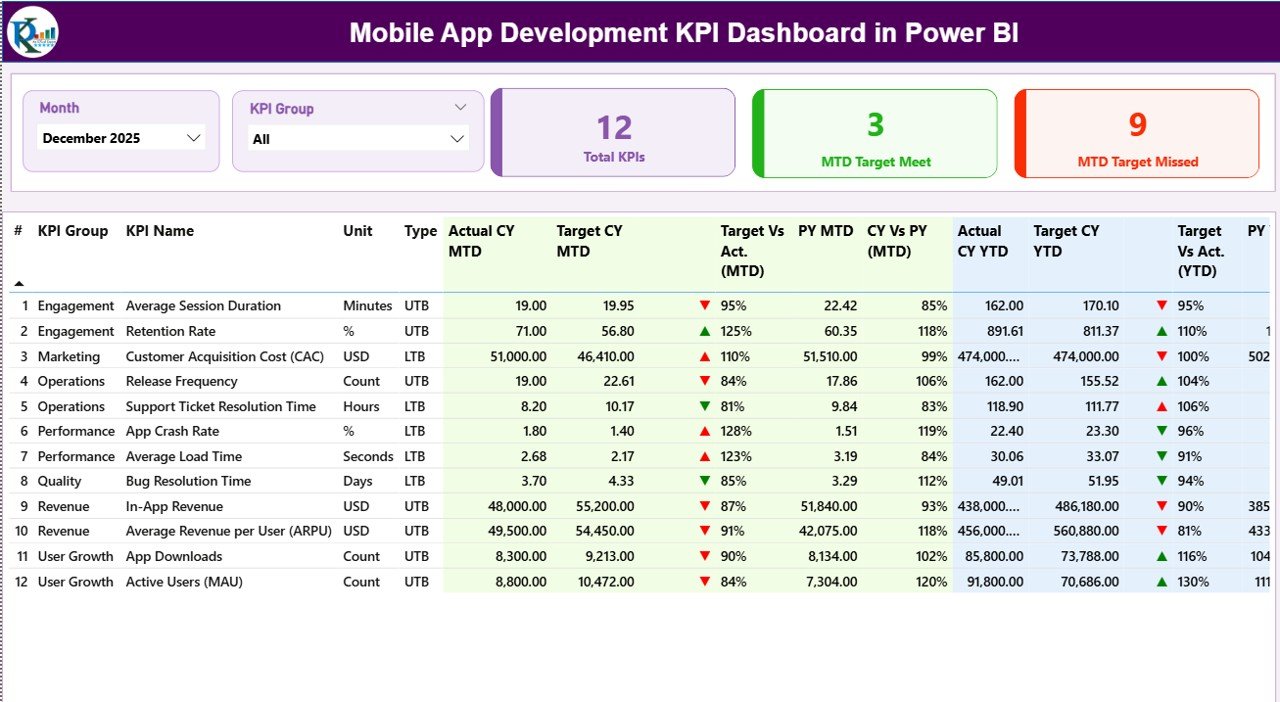
This is the heart of your reporting system.
🔹 Smart Slicers
Month Slicer
KPI Group Slicer
Filter the entire dashboard instantly without editing formulas.
🔹 KPI Performance Cards
Total KPIs Count
MTD Target Meet Count
MTD Target Missed Count
Within seconds, leadership sees whether the app ecosystem is performing as expected.
🔹 Detailed KPI Performance Table
KPI Identification:
KPI Number
KPI Group
KPI Name
Unit
Type (LTB / UTB)
MTD Metrics:
Actual CY MTD
Target CY MTD
MTD Icon (▲ / ▼)
Target vs Actual %
Previous Year MTD
CY vs PY %
YTD Metrics:
Actual CY YTD
Target CY YTD
YTD Icon
Target vs Actual %
Previous Year YTD
CY vs PY %
This structure ensures both short-term and long-term visibility.
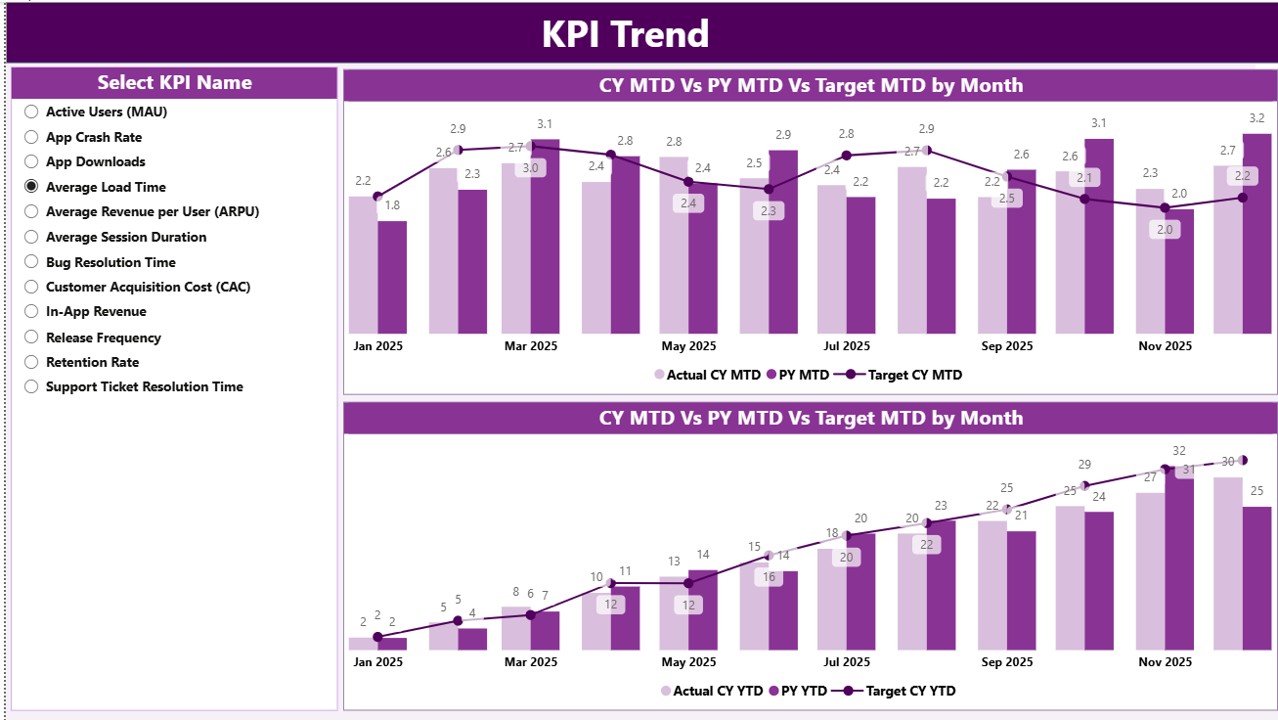
📊 2️⃣ KPI Trend Page – Visual Performance Analysis
Numbers tell you what happened. Trends tell you why.
This page includes:
📈 MTD Combo Chart
Current Year Actual
Target
Previous Year
📈 YTD Combo Chart
Current Year
Previous Year
Target
A KPI Name slicer allows you to analyze any metric individually.
Spot:
✔ Growth acceleration
✔ Performance decline
✔ Seasonal patterns
✔ Target gaps
Perfect for review meetings and strategy discussions.
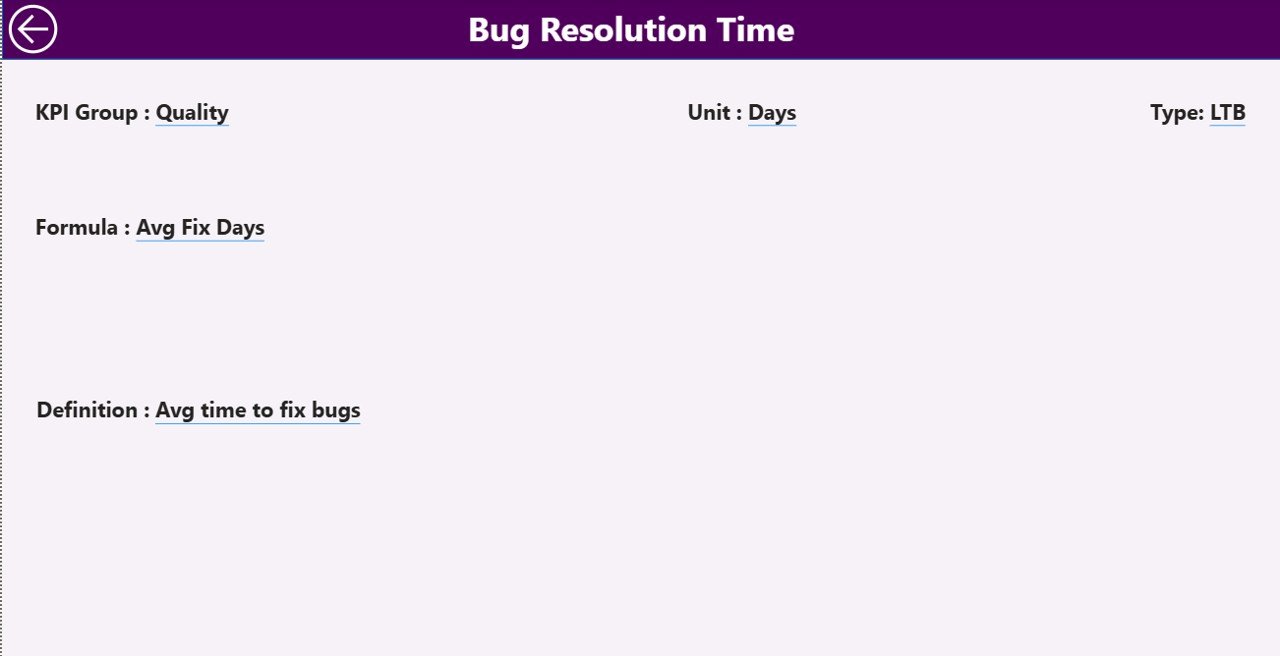
📘 3️⃣ KPI Definition Page – Transparency & Clarity
This hidden drill-through page shows:
KPI Formula
KPI Definition
KPI Group
KPI Type (LTB / UTB)
When stakeholders ask, “How is this calculated?” — you have instant answers.
Click back to return to the summary page.
📂 How Excel Integrates with Power BI
The dashboard connects to an Excel file with three sheets:
1️⃣ Input_Actual Sheet
KPI Name
Month (First date of month)
MTD Values
YTD Values
2️⃣ Input_Target Sheet
KPI Name
Month
MTD Target
YTD Target
3️⃣ KPI Definition Sheet
KPI Number
KPI Group
KPI Name
Unit
Formula
Definition
Type (LTB / UTB)
Update Excel → Refresh Power BI → Dashboard Updates Automatically.
Simple. Scalable. Efficient.
📊 Example KPIs You Can Track
📈 Growth KPIs
Daily Active Users (DAU)
Monthly Active Users (MAU)
User Retention Rate
App Revenue
🐞 Quality KPIs
Crash Rate
Bug Resolution Time
App Store Rating
🚀 Development KPIs
Feature Release Frequency
Cycle Time
Deployment Success Rate
💰 Financial KPIs
Customer Acquisition Cost (CAC)
Conversion Rate
Average Revenue Per User (ARPU)
Track technical and business metrics together — not separately.
👥 Who Should Use This Dashboard?
✔ Product Managers
✔ Mobile Developers
✔ QA Leads
✔ Growth Marketers
✔ CTOs
✔ Startup Founders
✔ SaaS Companies
If your business depends on app performance, this dashboard is built for you.
💡 How This Dashboard Improves Strategy
Instead of reacting to declining retention, you detect it early.
Instead of guessing why revenue slowed, you see the trend.
Instead of siloed data, teams align on one version of truth.
With MTD, YTD, and Year-over-Year comparisons, you gain structured clarity — not emotional assumptions.
🛠 Best Practices for Maximum Impact
✔ Define KPI ownership clearly
✔ Update Excel data monthly
✔ Set realistic targets
✔ Review trend charts regularly
✔ Avoid tracking too many metrics
✔ Conduct monthly performance meetings
✔ Keep KPI definitions simple
Strong KPIs create strong strategy.
If you want to move from scattered reports to structured performance intelligence, this dashboard delivers exactly that.
Clarity. Control. Growth.
Click here to read the Detailed blog post
Visit our YouTube channel to learn step-by-step video tutorials
👉 YouTube Channel – PKAnExcelExpert