APIs power everything — mobile apps, SaaS platforms, fintech systems, and e-commerce engines. But when uptime drops, response time increases, or deployments fail, business impact is immediate.
If you are still tracking API metrics in scattered Excel sheets, you’re reacting late instead of leading proactively.
Introducing the API Development KPI Dashboard in Power BI — a ready-to-use, interactive performance monitoring solution designed for API teams, DevOps engineers, CTOs, and technology leaders.
This dashboard transforms structured Excel data into dynamic visuals, KPI indicators, MTD & YTD comparisons, and previous-year benchmarking — all inside one powerful Power BI file.
No manual reporting. No confusion. Just complete API performance visibility.
🚀 Key Feature of API Development KPI Dashboard in Power BI
📊 3 Interactive Dashboard Pages – Summary, KPI Trend, and KPI Definition drill-through.
🎯 Target vs Actual Monitoring – Instantly identify performance gaps.
📈 MTD & YTD Comparison – Track short-term and long-term API performance.
🔄 Current Year vs Previous Year Benchmarking – Measure growth and improvement clearly.
🟢🔴 Smart LTB & UTB Indicators – Automatic ▲ green and ▼ red icons based on KPI type.
🧩 Dynamic Slicers – Filter by Month and KPI Group instantly.
📂 Excel Data Integration – Simple data update and refresh workflow.
📦 What’s Inside the API Development KPI Dashboard in Power BI
This ready-to-use Power BI solution includes 3 powerful analytical pages:
1️⃣ Summary Page – API Performance Command Center
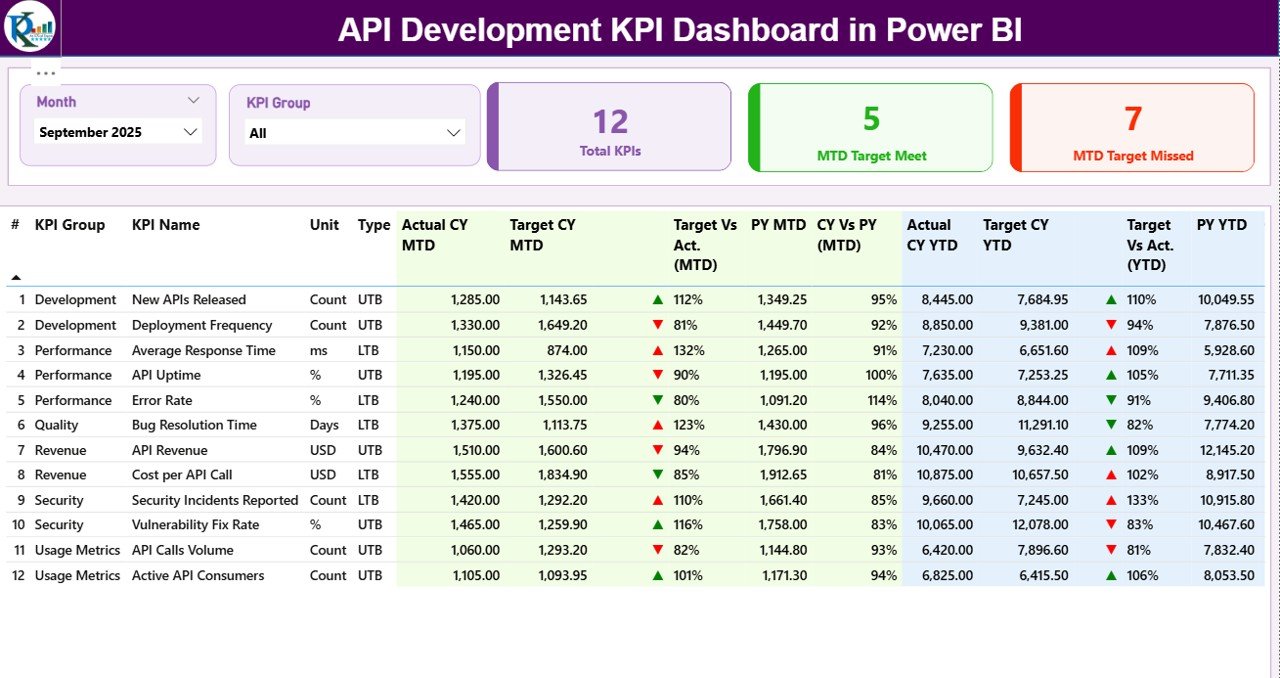
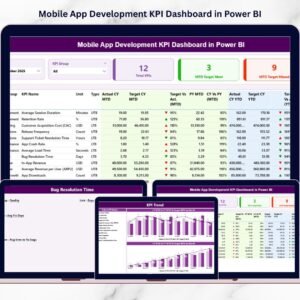
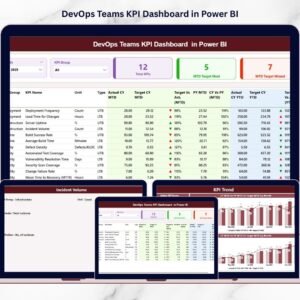
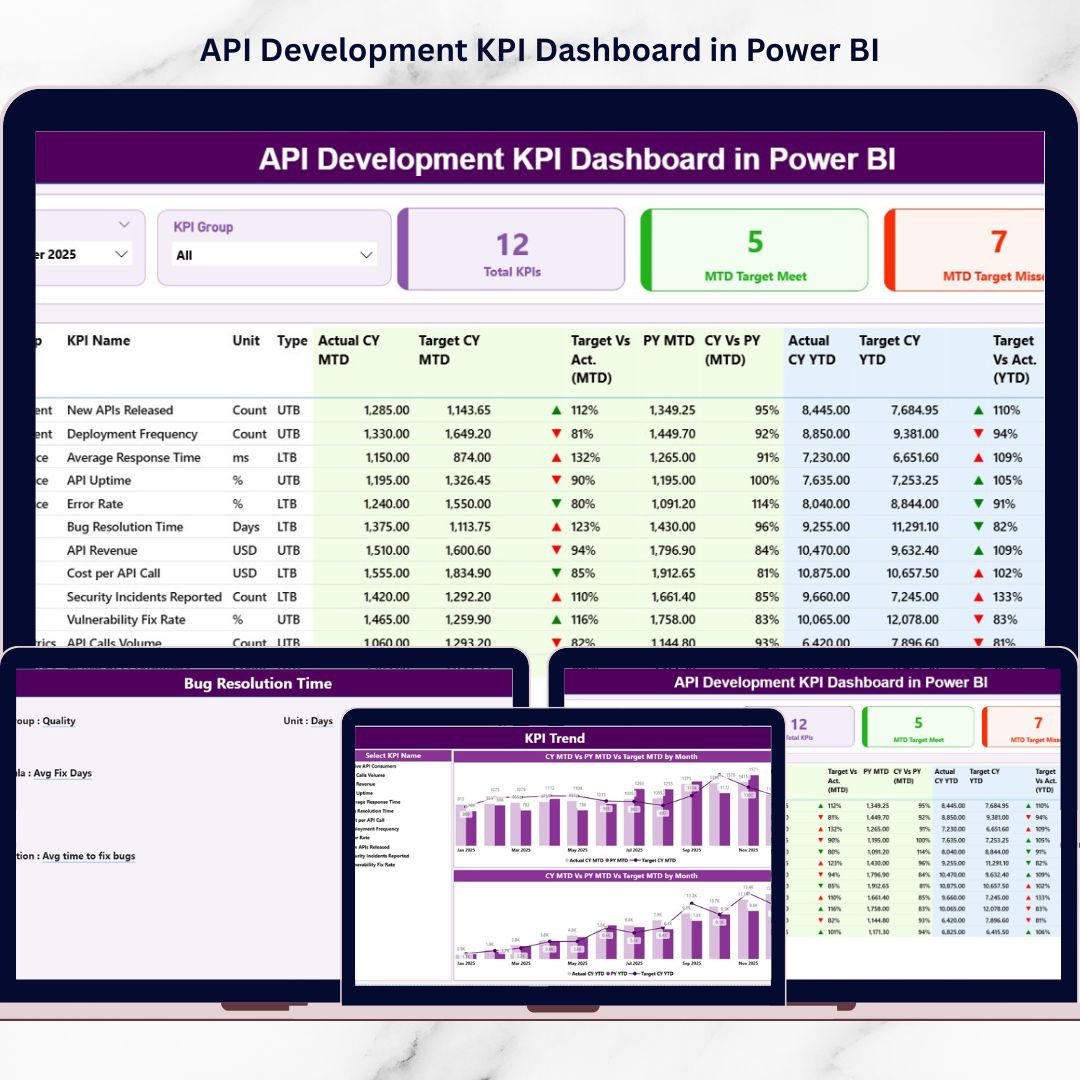
The Summary page provides a complete KPI overview.
Top Slicers
Month Slicer
KPI Group Slicer (Performance, Reliability, Security, Deployment, Scalability)
KPI Cards
Total KPIs Count
MTD Target Meet Count
MTD Target Missed Count
These cards instantly show overall API health.
Detailed KPI Table Includes:
KPI Number
KPI Group
KPI Name
Unit
Type (LTB / UTB)
Actual CY MTD
Target CY MTD
Target vs Actual % (MTD)
Previous Year MTD
CY vs PY % (MTD)
Actual CY YTD
Target CY YTD
Target vs Actual % (YTD)
Previous Year YTD
CY vs PY % (YTD)
Green ▲ icons indicate improvement.
Red ▼ icons highlight performance decline.
This page eliminates guesswork and speeds up executive decision-making.
2️⃣ KPI Trend Page – Visual Performance Intelligence
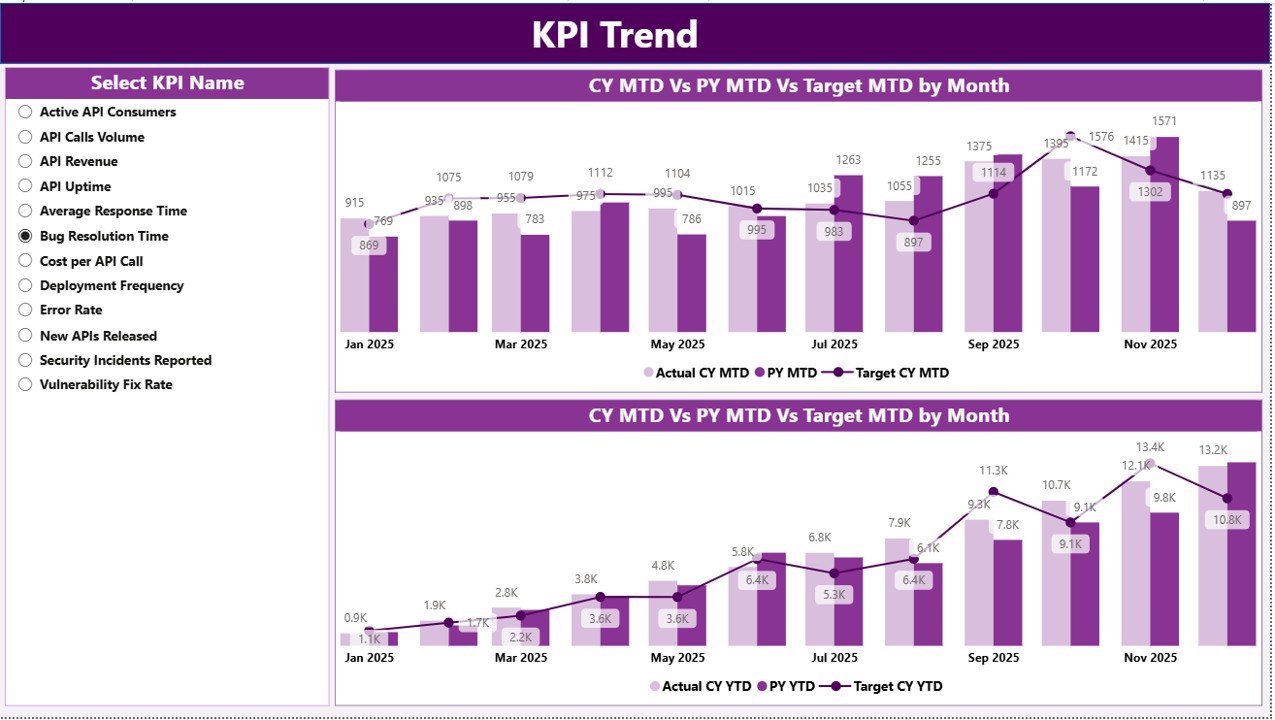
The KPI Trend page allows deep analysis of any selected KPI.
Includes:
2 Combo Charts:
MTD Trend (Actual vs Target vs Previous Year)
YTD Trend (Actual vs Target vs Previous Year)
KPI Name slicer for dynamic selection
Instead of reviewing static numbers, you analyze performance patterns over time.
For example:
Increasing API latency across months signals infrastructure stress.
Improved deployment success rate confirms DevOps efficiency.
Trend visibility enables proactive management.
3️⃣ KPI Definition Page – Drill-Through Transparency
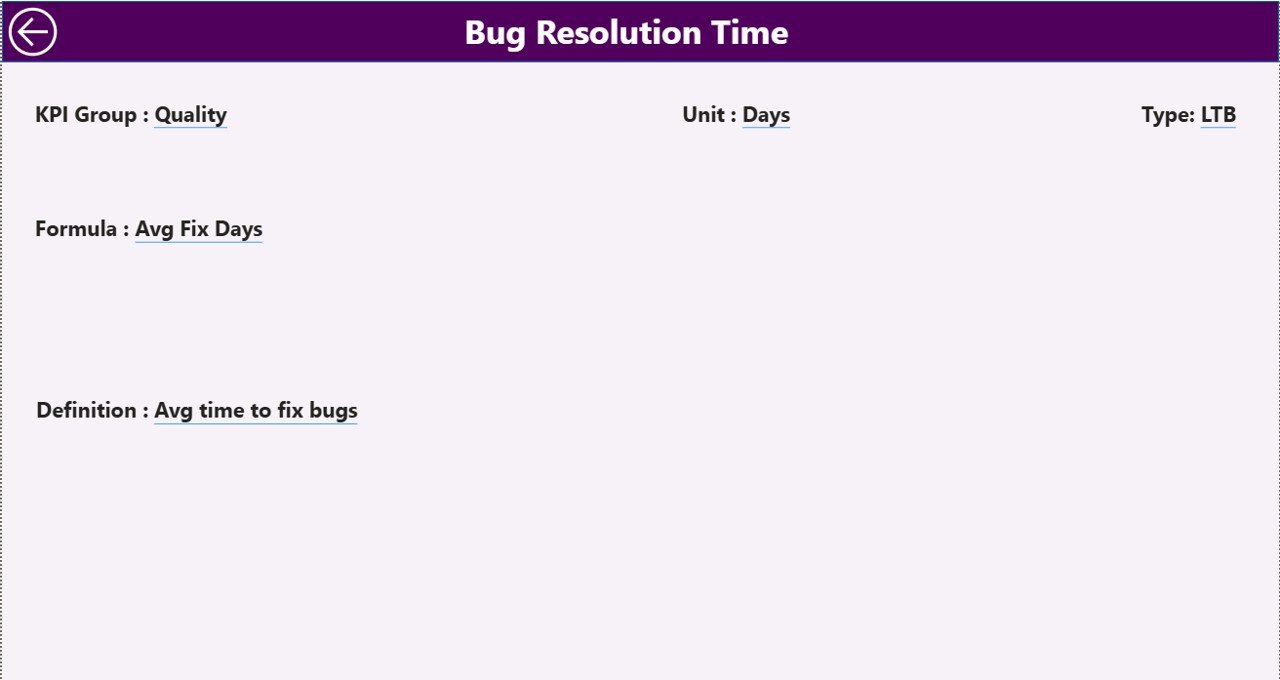
This hidden page ensures clarity and accountability.
It displays:
KPI Number
KPI Group
KPI Name
Unit
Formula
Definition
Type (LTB / UTB)
When stakeholders ask how a KPI is calculated, you can drill through and explain instantly.
🛠 How to Use the API Development KPI Dashboard in Power BI
Using the dashboard is simple:
1️⃣ Update Input_Actual sheet with:
KPI Name
Month (first date of month)
MTD Value
YTD Value
2️⃣ Update Input_Target sheet with:
KPI Name
Month
Target MTD
Target YTD
3️⃣ Maintain KPI details in the KPI Definition sheet.
4️⃣ Refresh Power BI.
5️⃣ Use slicers to analyze performance instantly.
Because the structure is scalable, you can add new KPIs easily without redesigning visuals.
👨💻 Who Can Benefit from This API Development KPI Dashboard in Power BI
✔ API Development Teams
✔ DevOps Engineers
✔ CTOs & Engineering Heads
✔ SaaS Product Teams
✔ Fintech Companies
✔ E-commerce Platforms
✔ IT Governance Teams
If your business depends on APIs, this dashboard provides essential visibility.
Why This Dashboard Changes the Way You Manage APIs
Instead of reacting to outages, you monitor uptime trends proactively.
Instead of guessing deployment stability, you measure success rates clearly.
Instead of manually calculating SLA compliance, you view performance instantly.
From API Response Time and Error Rate % to Deployment Success and SLA Compliance — every critical KPI becomes measurable, comparable, and actionable.
If you want structured governance, proactive monitoring, and executive-ready reporting, this dashboard delivers exactly that.
Click here to read the Detailed blog post
Visit our YouTube channel to learn step-by-step video tutorials
👉 YouTube Channel – PKAnExcelExpert