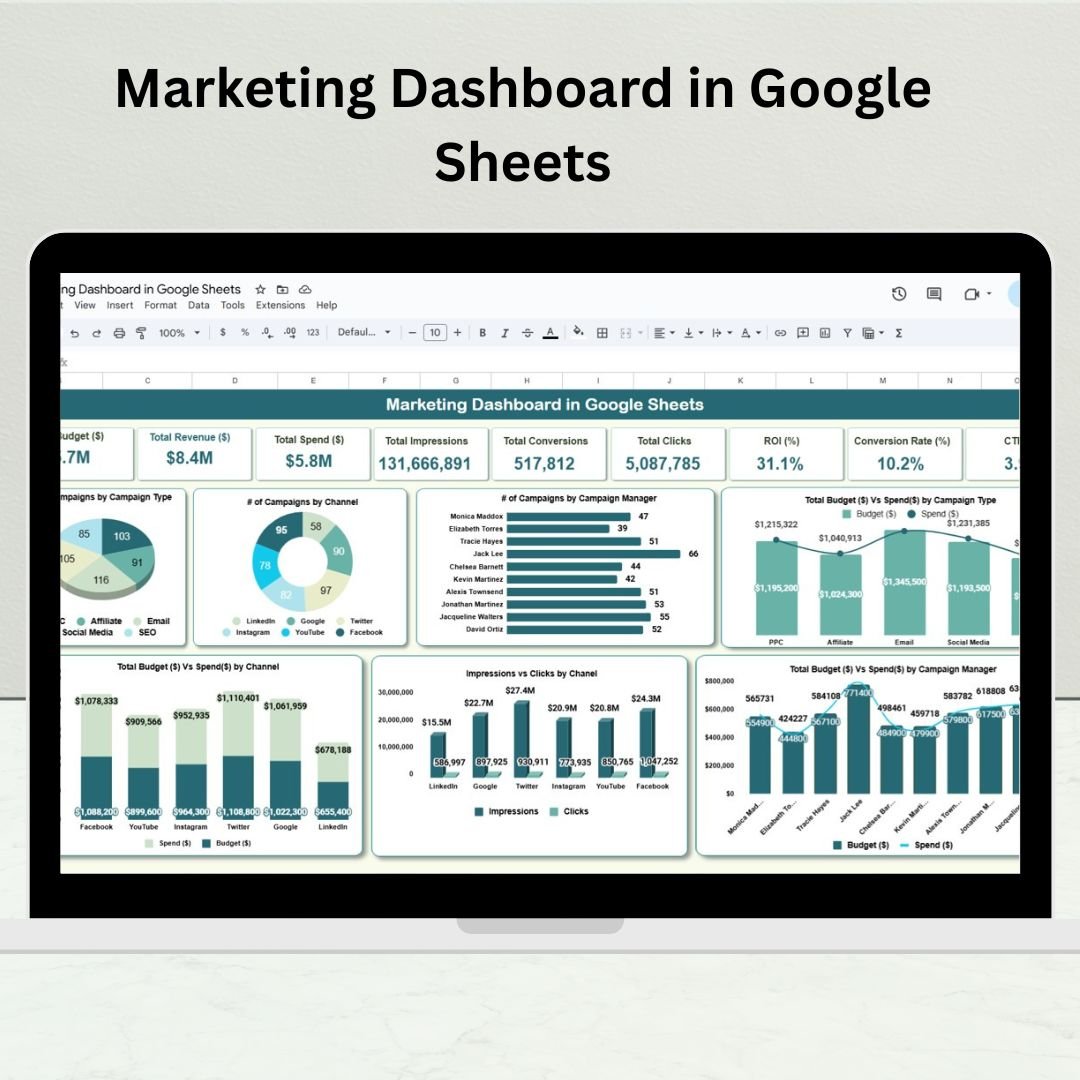
Tired of scattered data and delayed reports? The Marketing Dashboard in Google Sheets is your all-in-one solution to track, visualize, and improve your marketing performance. Whether you’re managing paid campaigns, SEO, content, or email marketing, this ready-to-use dashboard delivers real-time insights that empower you to make data-driven decisions—no special software or coding required!
⚙️ Key Features of the Marketing Dashboard in Google Sheets
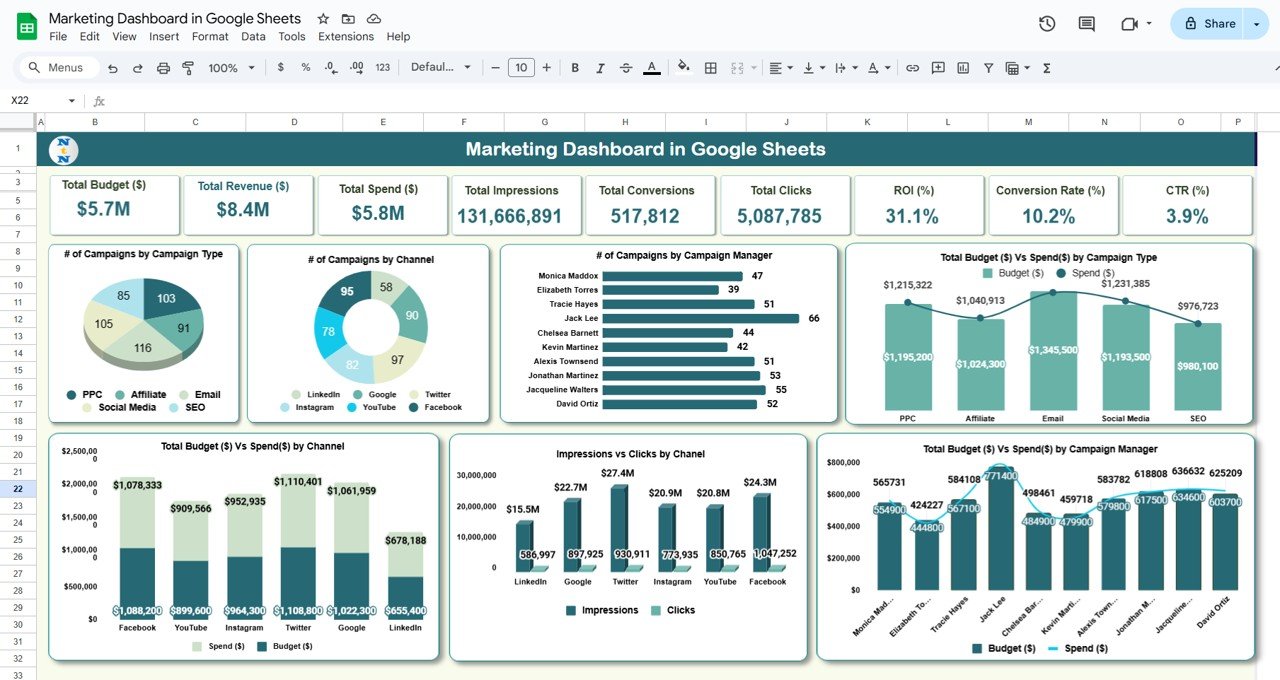
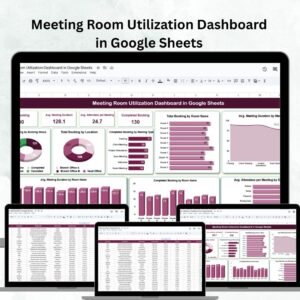
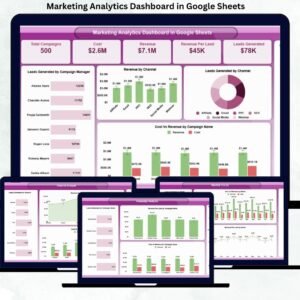
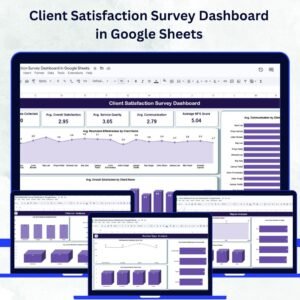
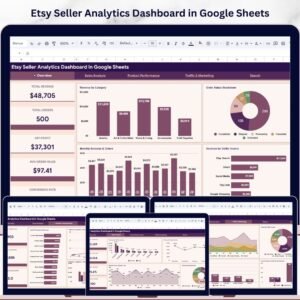
📊 Dashboard Overview Sheet
Get a quick view of your marketing health with:
-
📌 Total Campaigns
-
💸 Average Cost per Lead (CPL)
-
🧲 Total Leads Generated
-
🧮 Conversion Rate (%)
-
⭐ Campaign ROI Score
Visual charts include:
-
🔹 Leads by Campaign Type
-
🔹 Campaign Performance by Status (Active, Paused, Completed)
-
🔹 Conversions by Channel (Google Ads, Facebook, Email, etc.)
-
🔹 Monthly Trend: Leads vs Conversions
-
🔹 ROI Trend by Campaign
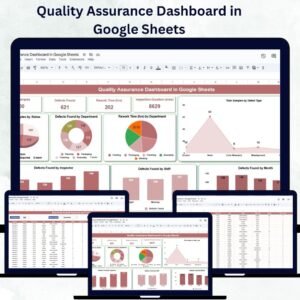
📑 Channel Analysis Tab
Break down campaign success across marketing channels:
-
ROI, CPL, Conversions, and Lead Quality by Channel
-
Identify your top-performing platforms
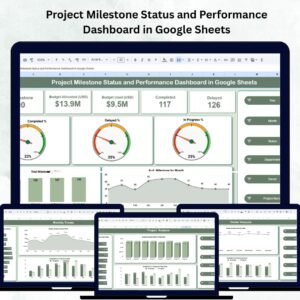
📈 Performance by Campaign Priority
See how campaigns with different priority levels are performing:
-
Avg. Conversion Rate by Priority
-
Campaign Volume and ROI by Priority
-
Completion Status: Active vs Completed by Priority
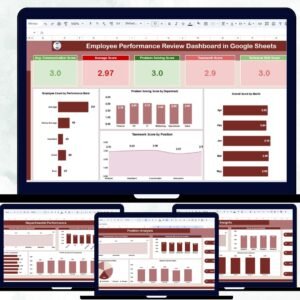
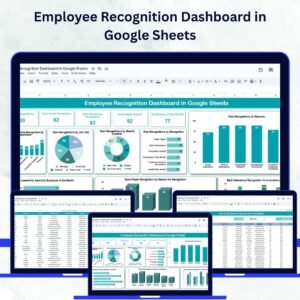
🧑💼 Marketer Performance Tab
Track how each team member or agency is performing:
-
Campaigns Managed
-
Leads Generated
-
Conversion Rate by Marketer
-
Average ROI by Manager
🌍 Location-Based Insights Tab
Discover which regions deliver the best results:
-
Leads and Conversions by Location
-
ROI and CPL trends per region
-
Heatmap of campaign engagement
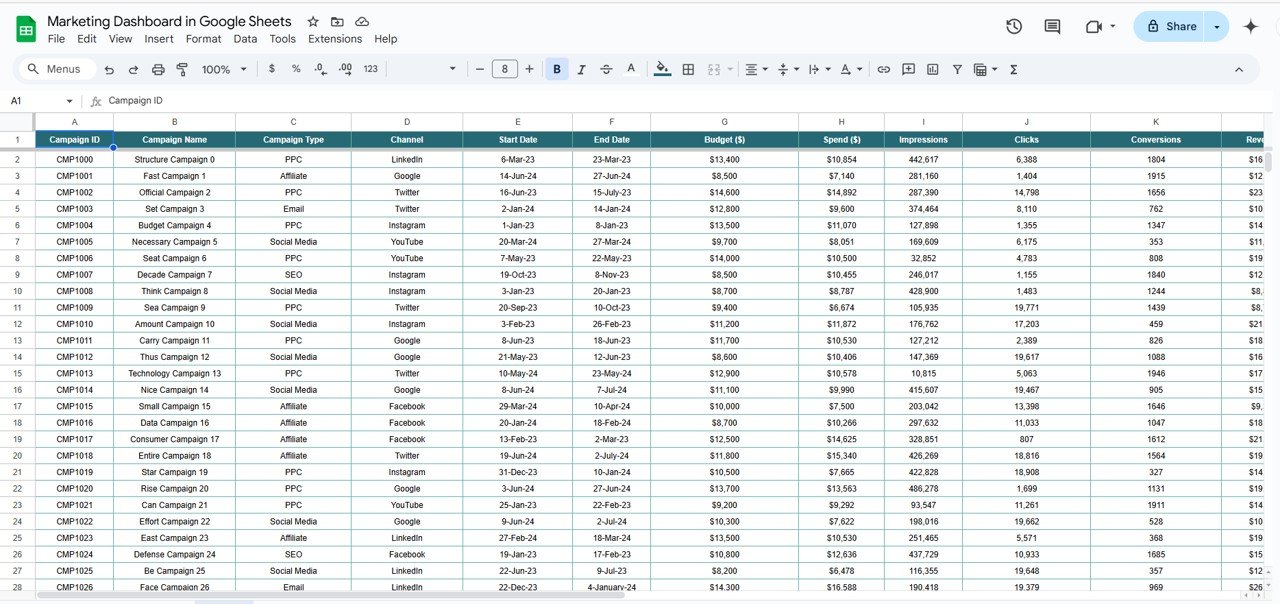
📥 Data Entry Sheet
Add all your raw campaign data:
-
Campaign Name, Channel, Budget, Spend, Leads, Conversions, Status, Assigned Marketer, Priority, Start/End Dates
-
Dashboard visuals update automatically!
📦 What’s Inside the Marketing Dashboard
You’ll receive a fully linked Google Sheet with the following tabs:
-
Dashboard Overview – Real-time KPIs and campaign performance
-
Channel Analysis – Visual breakdown by digital channel
-
Campaign Priority View – Monitor high, medium, low priorities
-
Marketer Insights – Track individual performance
-
Location Reports – Regional and geo-targeted insights
-
Raw Data Sheet – Input source for all visualizations
🎯 All charts are auto-calculated using formulas and Google Sheets’ powerful built-in tools.
🧩 How to Use the Marketing Dashboard
🖊️ Step 1: Input campaign data into the Data Sheet
📊 Step 2: Watch metrics auto-calculate across all tabs
📆 Step 3: Filter by status, priority, or date to drill down
📤 Step 4: Share live links with stakeholders or export as PDF
⚙️ Step 5: Customize charts or fields to fit your marketing needs
It’s as easy as plug, update, and analyze—no macros or complex scripts needed!
👥 Who Can Benefit from This Dashboard?
💼 Marketing Managers – Track all campaigns from a single sheet
🎯 Performance Marketers – Optimize ad spend and ROI
📈 Digital Agencies – Create branded reports for clients
🧑💻 Freelancers & Solo Marketers – Stay organized and scale operations
📊 Startup Founders – Get instant visibility into lead performance and spend
✅ Why Choose This Google Sheets Marketing Dashboard?
✅ 100% cloud-based & accessible from anywhere
✅ Built-in charts, KPIs, filters, and formulas
✅ Completely customizable—no lock-ins
✅ Instant insights from live campaign data
✅ Shareable with teams, clients, and C-levels
✅ No software subscription or coding required
From tracking ROI to comparing campaign effectiveness, this dashboard gives you control, clarity, and confidence in your marketing decisions.
🔁 Click here to read the Detailed blog post
Click here to read the Detailed blog post


Reviews
There are no reviews yet.