

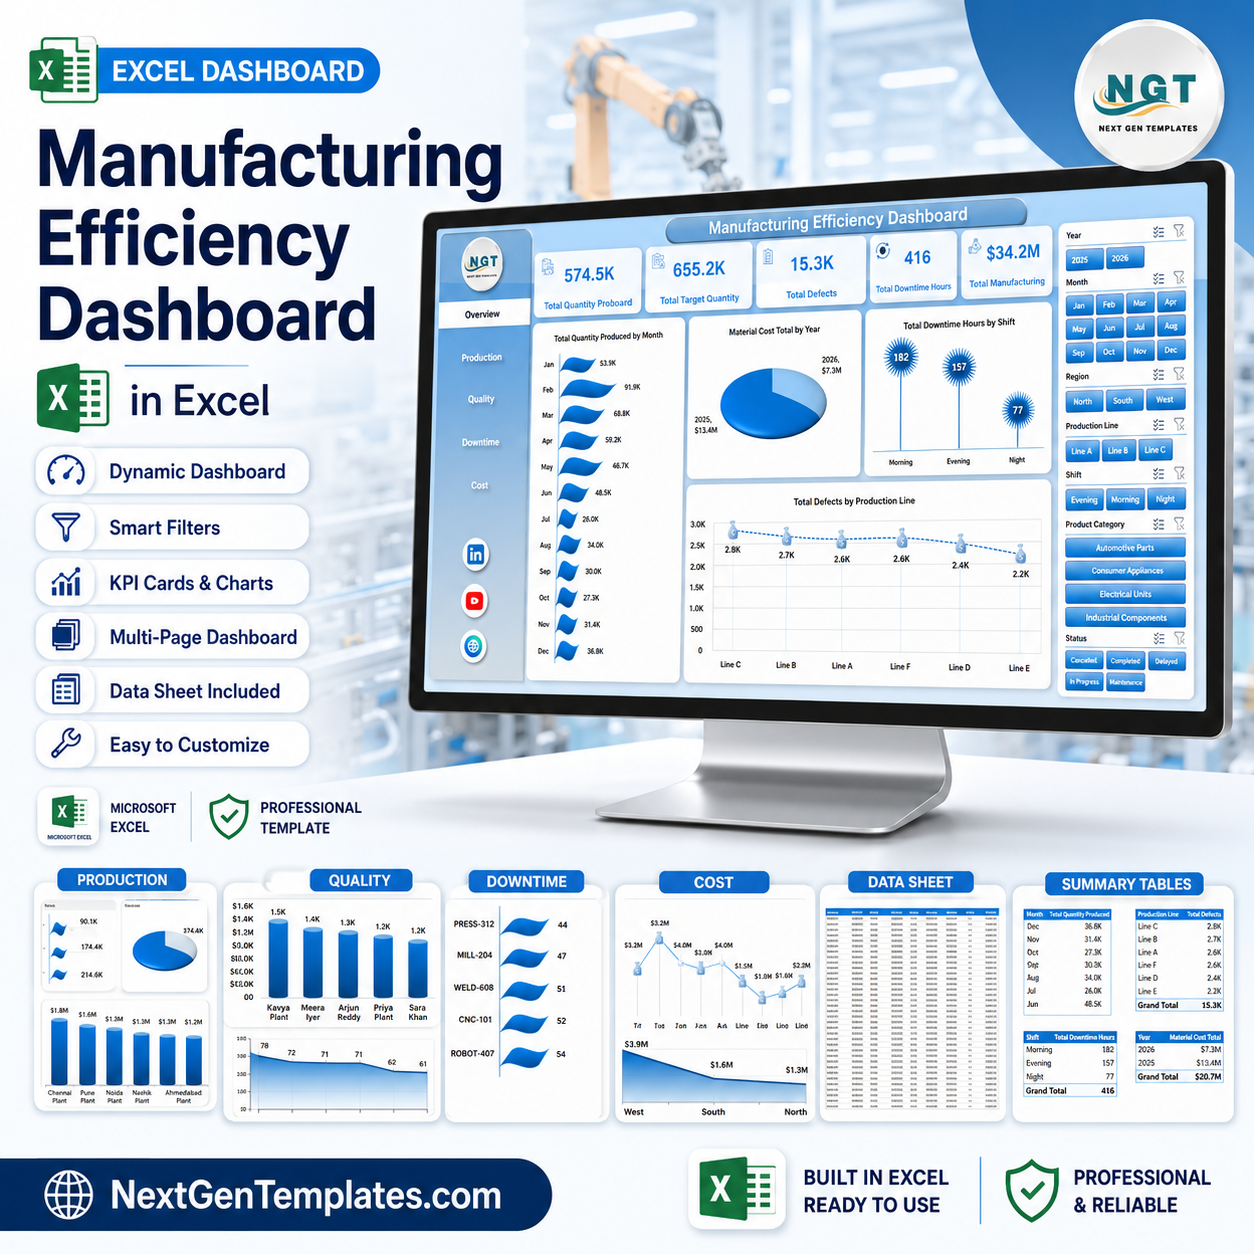


Manufacturing Efficiency Dashboard in Excel gives manufacturing managers, plant heads, production supervisors, quality teams, and cost analysts a ready Excel reporting file with 7 worksheet tabs, 5 high-level KPI cards, 19 analysis charts, and slicers for Year, Month, Region, Production Line, Shift, Product Category, and Status. Instead of rebuilding pivot charts from scratch, you can update the data sheet, click Refresh All, and review production quantity, targets, defects, downtime hours, and manufacturing cost in one workbook. Built by PK, trusted by 300K+ learners across YouTube channels, and sold as a one-time download with no subscription.
Key Features of Manufacturing Efficiency Dashboard in Excel
- 7 worksheet structure: Overview, Production, Quality, Downtime, Cost, Data, and Support sheets.
- Executive KPI cards: Track Total Quantity Produced, Total Target Quantity, Total Defects, Total Downtime Hours, and Total Manufacturing Cost.
- Interactive slicers: Filter the dashboard by Year, Month, Region, Production Line, Shift, Product Category, and Status.
- Production analytics: Review quantity produced by month, quarter, product category, and product.
- Quality monitoring: Analyze defects by production line, operator, and product to spot recurring quality issues.
- Downtime control: Compare downtime by shift, machine, plant, and production line.
- Cost analysis: Review manufacturing, labor, energy, and material cost across plants, months, regions, machines, shifts, and categories.
- Refreshable pivot model: Update the Data sheet, refresh the workbook, and let the support pivots update the visuals.
What’s Inside the Manufacturing Efficiency Dashboard in Excel
1. Overview Page
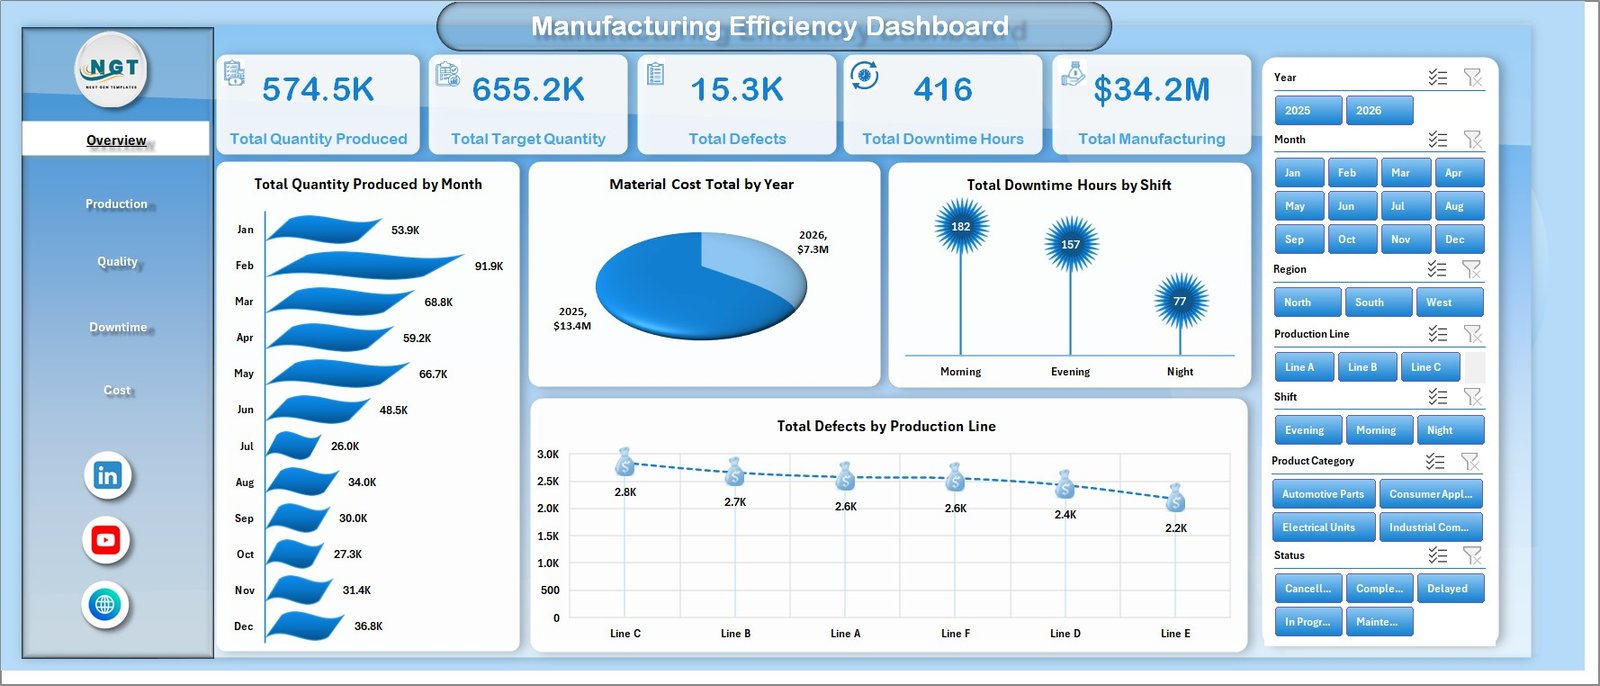
The Overview page gives a high-level snapshot of production, target, quality, downtime, and cost performance. The KPI cards help managers understand whether output, defects, downtime, and manufacturing spend are moving in the right direction before opening deeper analysis pages.
Total Quantity Produced by Month: This chart shows production volume month by month so you can identify seasonality, output dips, and stronger production periods. It is useful for comparing actual production flow against planning expectations.
Material Cost Total by Year: This view compares annual material cost and helps finance or operations teams track whether material spend is increasing across years. It supports supplier, usage, and budgeting discussions.
Total Downtime Hours by Shift: This chart highlights downtime distribution across shifts. Supervisors can quickly see whether maintenance, staffing, or changeover issues are concentrated in a specific shift.
Total Defects by Production Line: This view compares defect volume by production line. It helps quality teams identify lines that need process checks, training, maintenance, or root-cause review.
Manufacturing Efficiency Dashboard in Excel
2. Production Sheet
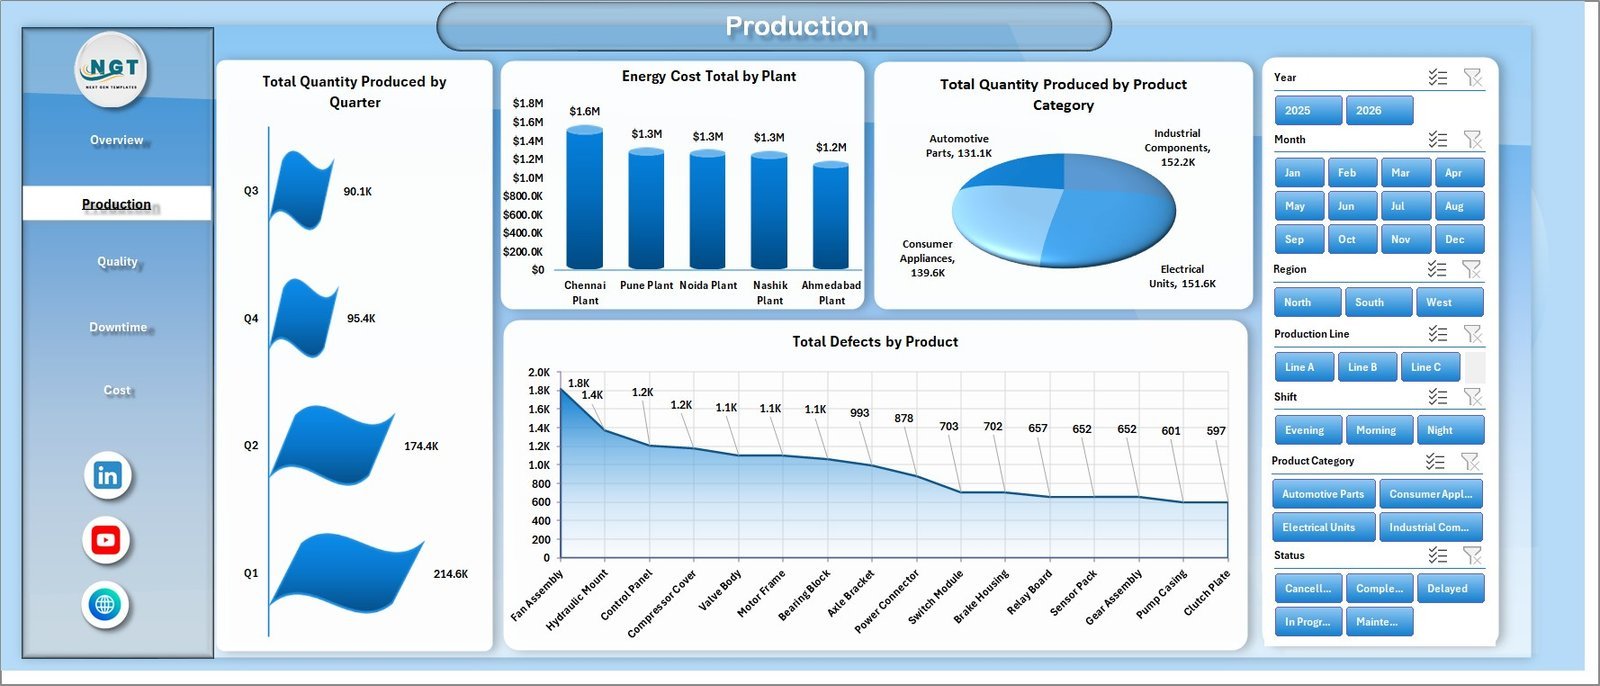
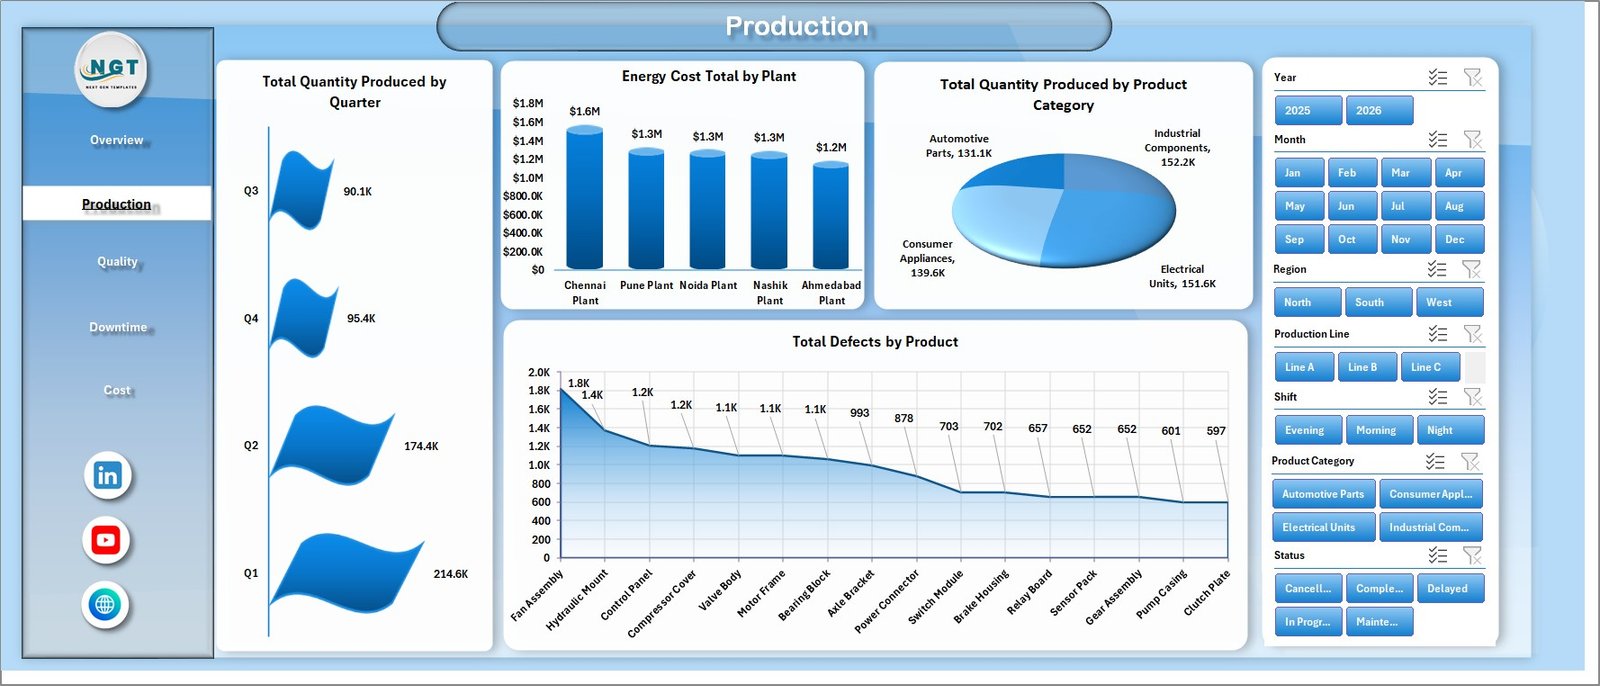
The Production sheet focuses on output, energy cost, product category performance, and product-level defects. It includes analysis for Total Quantity Produced by Quarter, Energy Cost Total by Plant, Total Quantity Produced by Product Category, and Total Defects by Product.
Production sheet tab
3. Quality Sheet
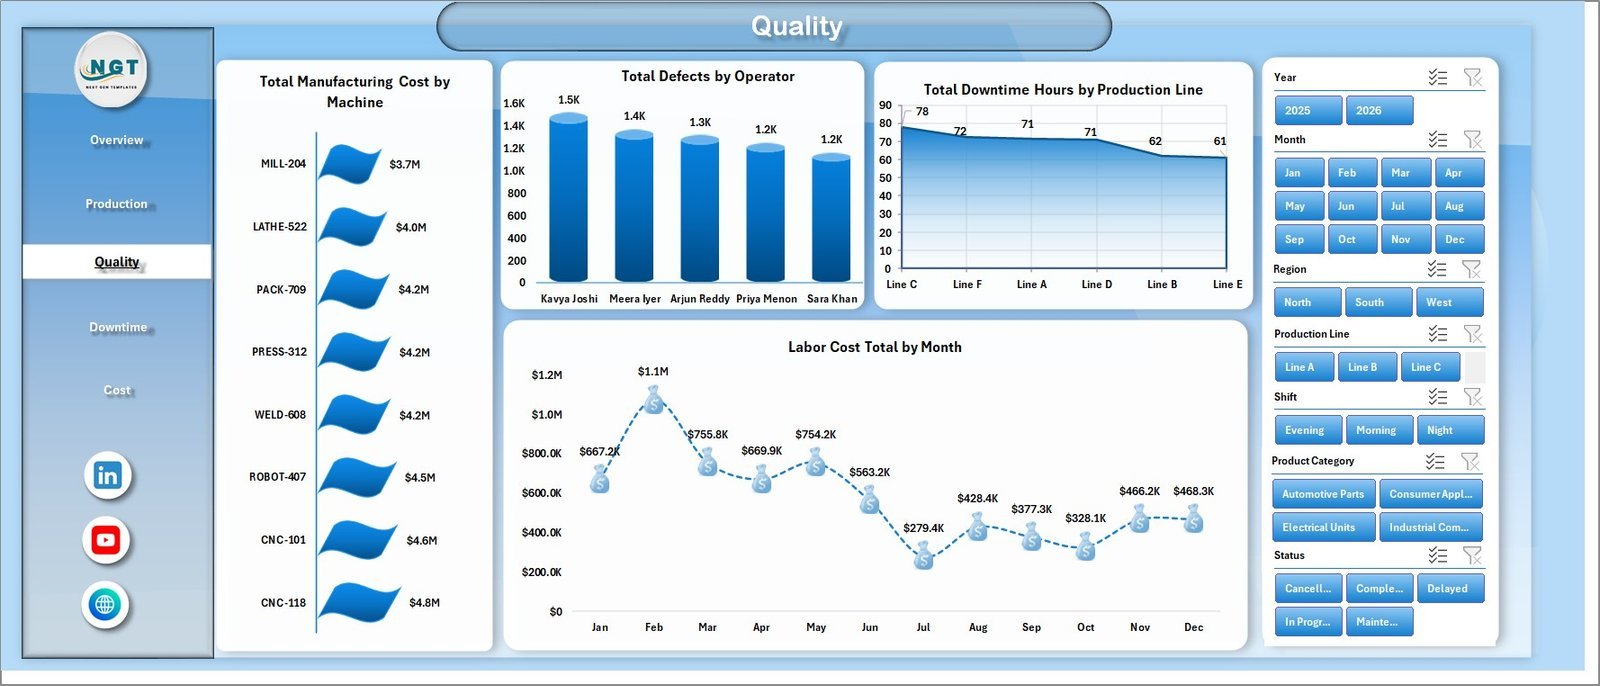
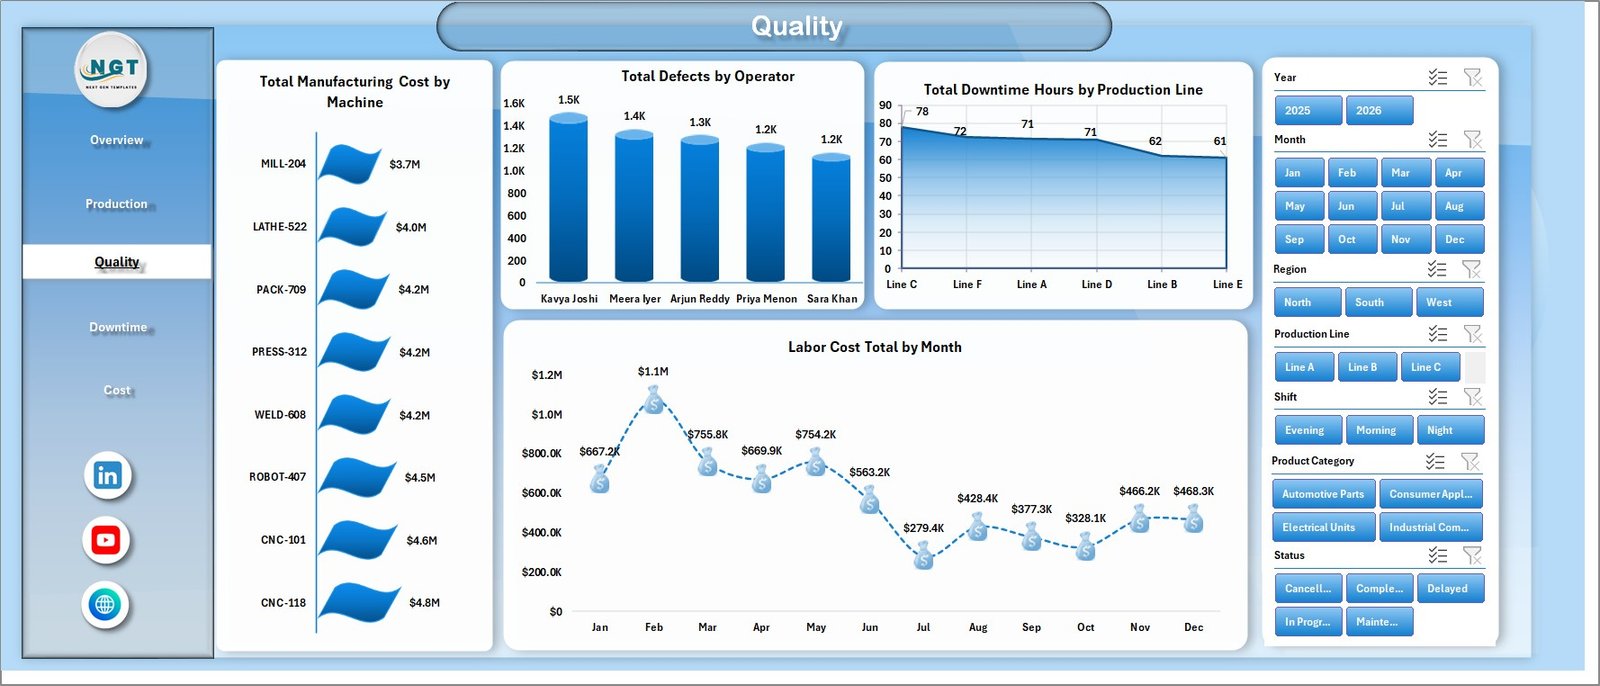
The Quality sheet helps users review manufacturing cost by machine, defects by operator, downtime by production line, and labor cost by month. This page is useful when production leaders need to connect quality outcomes with cost, labor, equipment, and line performance.
Quality sheet tab
4. Downtime Sheet
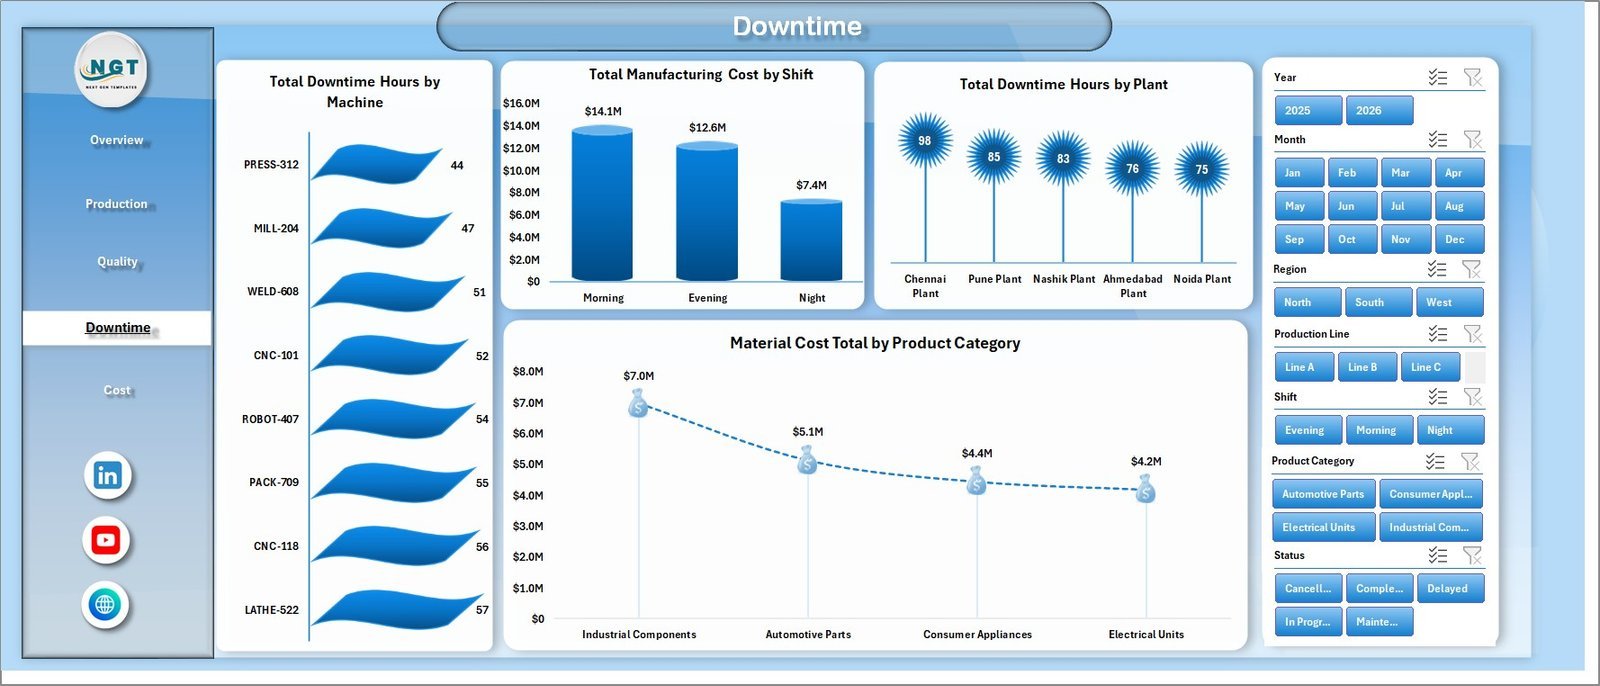
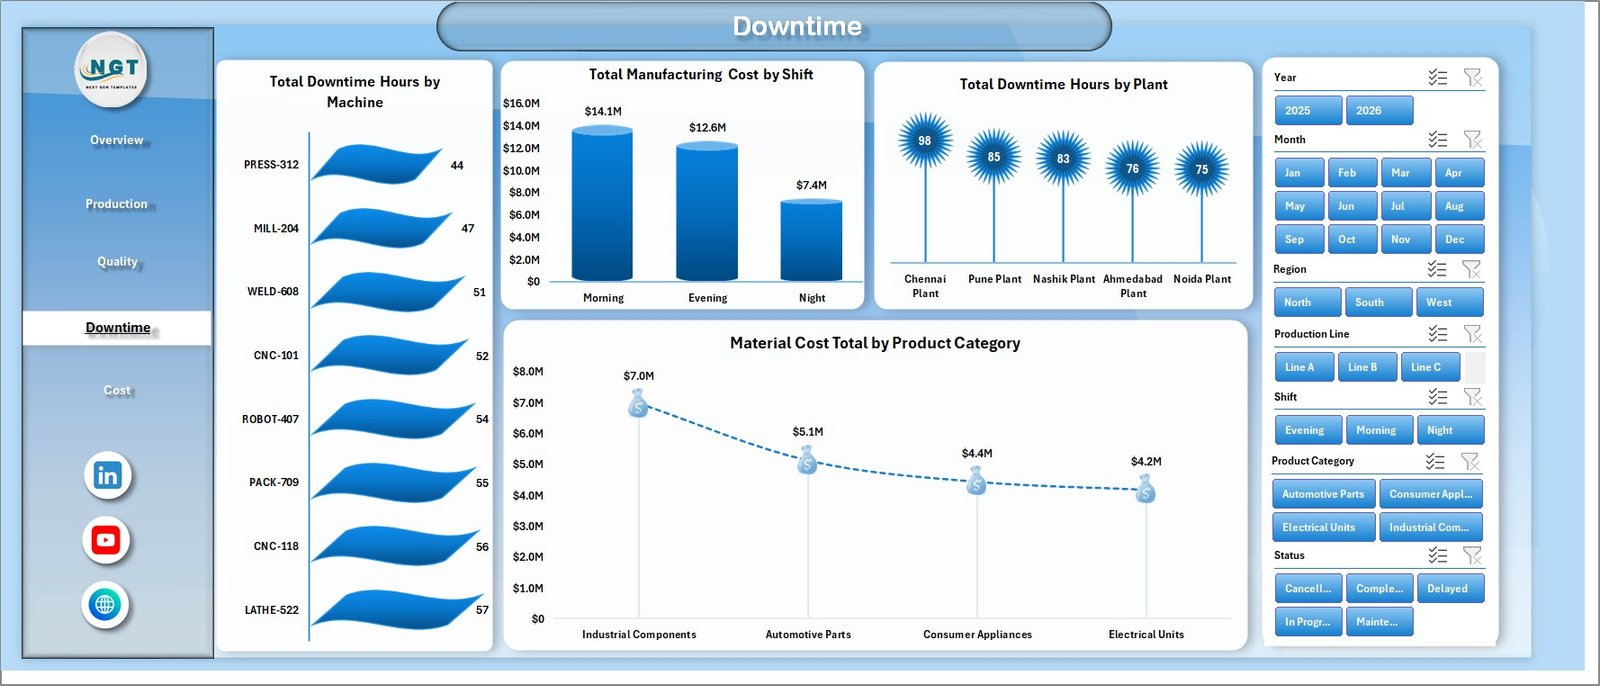
The Downtime sheet highlights downtime hours by machine, manufacturing cost by shift, downtime by plant, and material cost by product category. It supports maintenance reviews, shift-level cost discussions, and plant performance meetings.
Downtime sheet tab
5. Cost Sheet
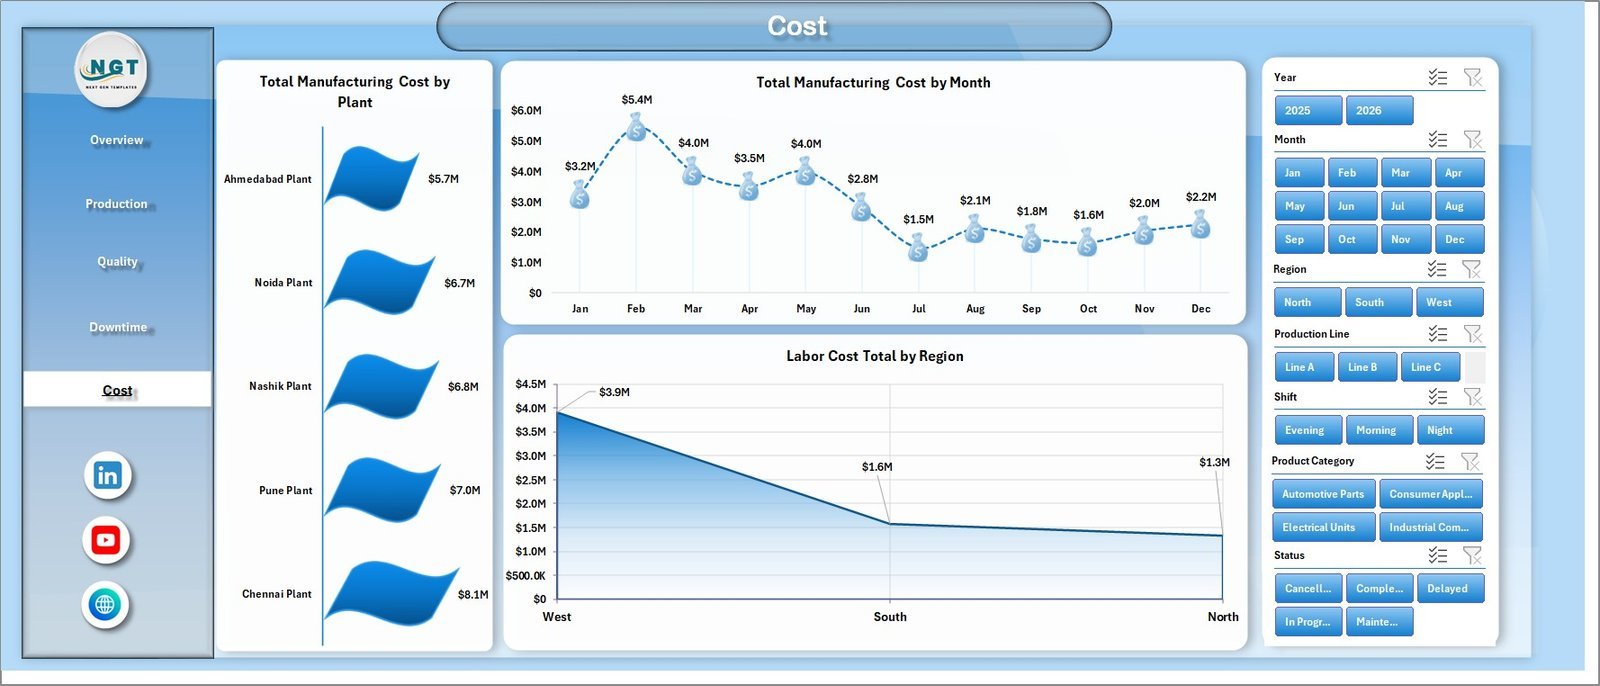
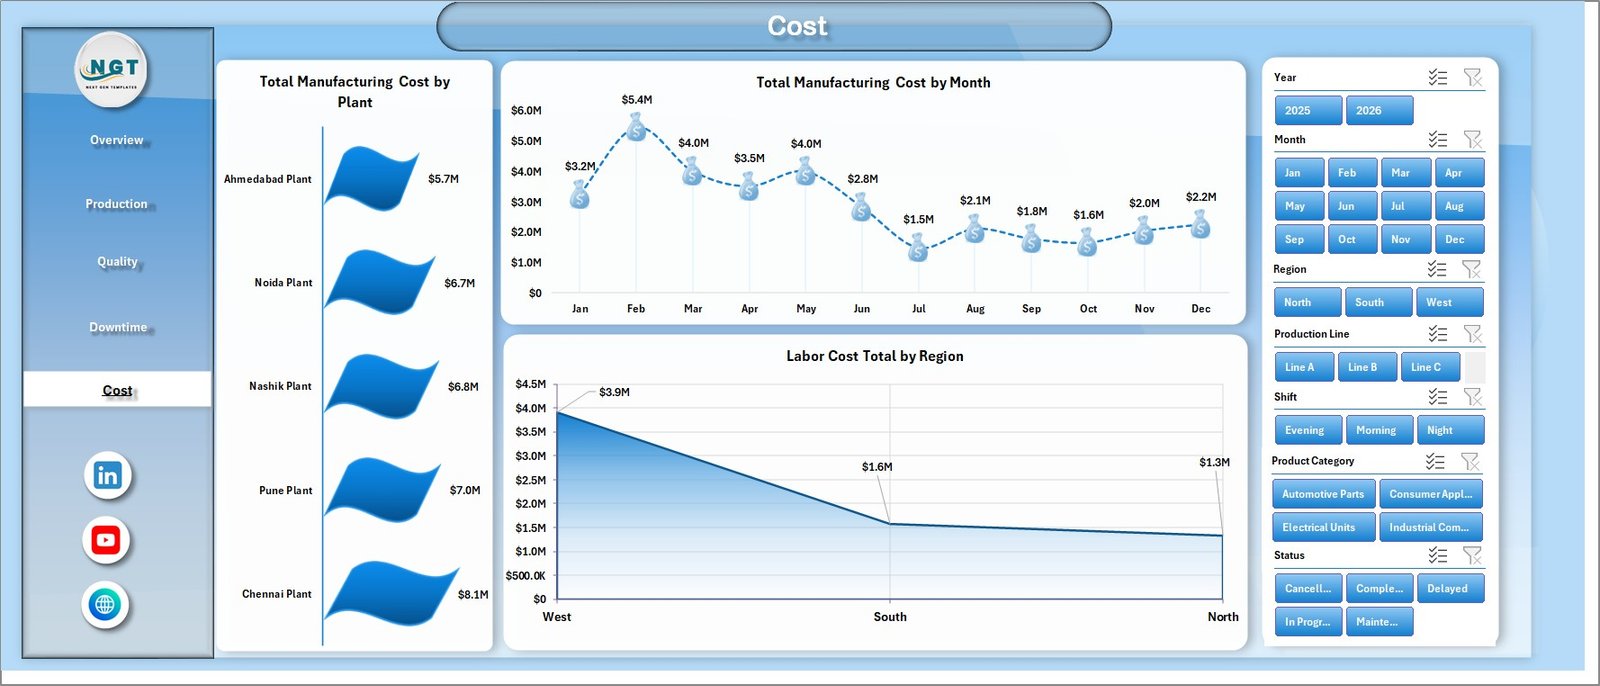
The Cost sheet provides a focused view of Total Manufacturing Cost by Plant, Total Manufacturing Cost by Month, and Labor Cost Total by Region. It is built for cost analysts and managers who need quick commentary on where manufacturing spend is coming from.
Cost sheet tab
6. Data Sheet
The Data sheet is where you add or replace the manufacturing dataset in the same structure. After updating this sheet, use the Data tab in Excel and click Refresh All to update the pivot tables and charts.

Data Sheet tab
7. Support Sheet
The Support sheet contains the pivot tables used to drive the dashboard. You can keep this sheet hidden after setup and use it only when you need to inspect or troubleshoot the workbook model.

Support sheet tab
Manufacturing Efficiency Dashboard in Excel vs. Google Sheets vs. Paid Manufacturing SaaS – Where This Fits
| Feature | This Excel Dashboard | Google Sheets Alternative | Paid Manufacturing SaaS |
|---|---|---|---|
| Cost | $17.99 one-time purchase | Template build or manual setup | Monthly or annual subscription |
| Platform | Microsoft Excel | Google Sheets | Vendor cloud system |
| Setup time | Replace data and refresh pivots | Rebuild formulas, pivots, or charts | Implementation and onboarding |
| Real-time team collaboration | Available through OneDrive or SharePoint if configured | Native collaboration | Usually included by user role |
| Mobile access | Excel mobile app with limitations | Google Sheets mobile app | Vendor app or browser |
| Customizable fields | Editable sheets, pivots, and charts | Editable but may need rebuilding | Limited by plan and permissions |
| Share with link | Available through Microsoft 365 sharing | Available through Google Drive | Login controlled |
| Year-1 cost at 5 users | $17.99 plus existing Microsoft licensing | Low if already on Google Workspace | Often hundreds or thousands of dollars |
| Manufacturing visibility | Production, quality, downtime, and cost pages in one workbook | Requires equivalent sheet design | Depends on modules purchased |
Who This Template Is For – and Who It’s Not For
This dashboard is for manufacturing managers, plant supervisors, production planners, quality control teams, operations analysts, cost controllers, and Excel consultants who need a ready workbook for production, defect, downtime, and cost reporting.
It is not a full ERP, MRP, MES, inventory system, barcode tool, or live machine-monitoring platform. It works best when you already have structured manufacturing data and want an Excel reporting layer that can be refreshed and customized.
How to Use the Manufacturing Efficiency Dashboard in Excel
- Download and unzip the Excel dashboard package.
- Open the workbook in Microsoft Excel.
- Go to the Data sheet and replace the sample rows with your manufacturing data in the same format.
- Use Excel’s Data tab and click Refresh All.
- Review the Overview, Production, Quality, Downtime, and Cost pages.
- Use slicers for Year, Month, Region, Production Line, Shift, Product Category, and Status to filter the dashboard.
Real-World Use Cases
Ravi, Plant Manager: reviews quantity produced, target quantity, downtime hours, and manufacturing cost before the Monday operations review.
Anita, Quality Lead: checks defects by production line, product, and operator to decide which process checks need attention first.
Michael, Cost Analyst: compares material cost, labor cost, energy cost, and manufacturing cost by plant, machine, month, and region for monthly reporting.
Frequently Asked Questions
Does this dashboard work in Microsoft Excel?
Yes. It is built as an Excel dashboard template and is designed to work in Microsoft Excel.
Can I use my own manufacturing data?
Yes. Replace the sample data in the Data sheet using the same column structure, then refresh the workbook.
What slicers are included?
The dashboard includes slicers for Year, Month, Region, Production Line, Shift, Product Category, and Status.
Does it include pivot tables?
Yes. The Support sheet contains pivot tables that drive the charts and dashboard pages.
Can I hide the Support sheet?
Yes. After setup, you can keep the Support sheet hidden and use Refresh All when data changes.
Is this a manufacturing software system?
No. It is an Excel analytics dashboard, not an ERP, MRP, or live shop-floor execution system.
About the Author
Built by PK – Microsoft Certified Professional with 15+ years of Excel, Google Sheets, and Power BI experience. Founder of NextGenTemplates, reaching 300K+ subscribers across YouTube channels. Every template is hand-built and tested before release.
Explore Related Templates
You may also like the Manufacturing Excellence Bundle, Manufacturing Efficiency Dashboard in Power BI, Manufacturing Cost Efficiency KPI Dashboard in Excel, and Quality Assurance Dashboard in Excel. Browse more Excel Dashboard templates and Manufacturing Excel templates.
Download the Manufacturing Efficiency Dashboard in Excel today and turn production, quality, downtime, and cost data into clear factory reporting.
Last updated: July 3, 2026.

























Reviews
There are no reviews yet.