
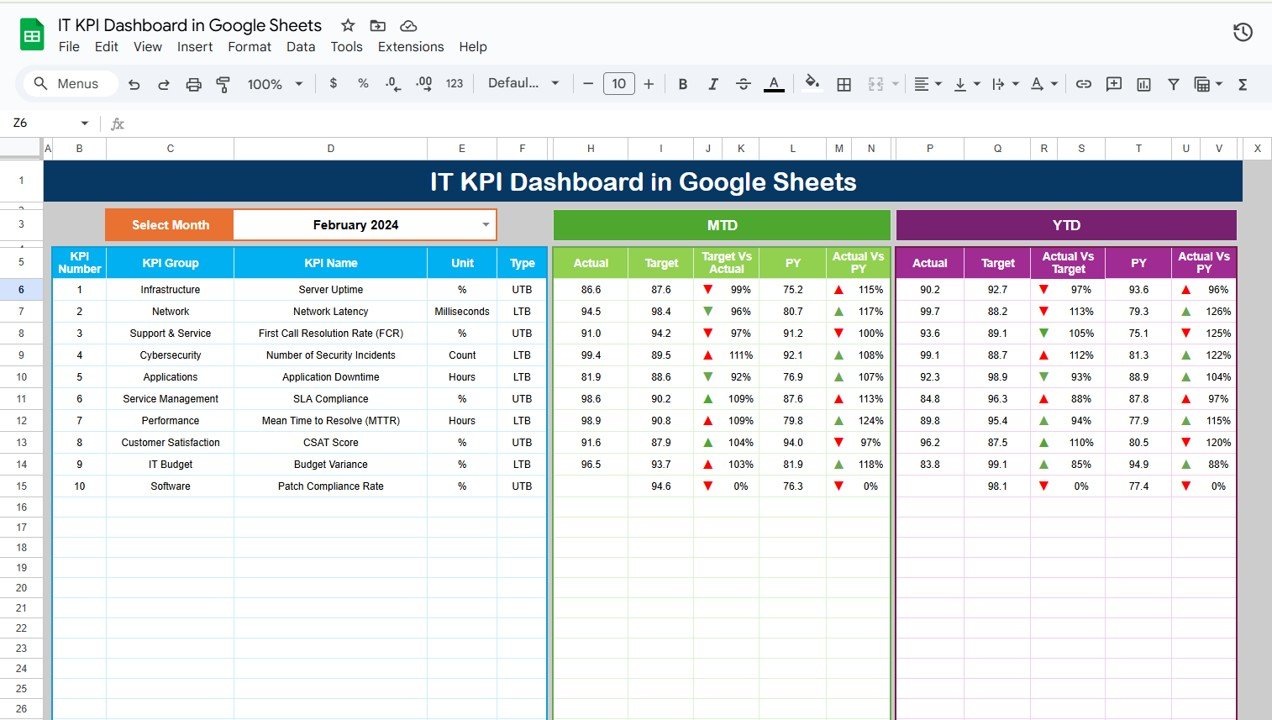
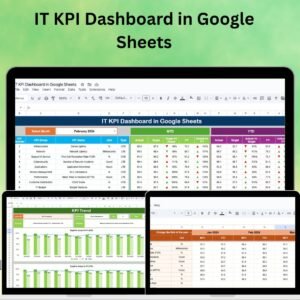
The IT KPI Dashboard in Google Sheets is a powerful and customizable tool designed for IT managers, teams, and business owners to monitor and track key performance indicators (KPIs) related to IT infrastructure, systems, and performance. Whether you’re managing system uptime, helpdesk tickets, network performance, or security metrics, this dashboard gives you a comprehensive view of your IT operations, helping you make data-driven decisions to optimize your IT systems and improve performance.
With real-time data tracking, interactive filtering, and customizable reporting options, this Google Sheets-based dashboard allows you to stay on top of your IT team’s performance, identify issues early, and ensure efficient resource allocation. The dashboard is designed to streamline your IT management and provide you with valuable insights to enhance system performance, reduce downtime, and improve service delivery.
Key Features of the IT KPI Dashboard in Google Sheets:
📊 Comprehensive IT KPI Tracking
Track essential IT KPIs such as system uptime, server performance, ticket resolution times, network speed, and security incidents—all in one interactive dashboard.
📈 Real-Time Data Updates
Monitor your IT performance with real-time updates, ensuring that you always have the latest data at your fingertips to make informed decisions.
📅 Customizable Time Periods
Track KPIs over different periods such as daily, weekly, or monthly, allowing you to analyze trends, measure improvements, and identify areas for optimization.
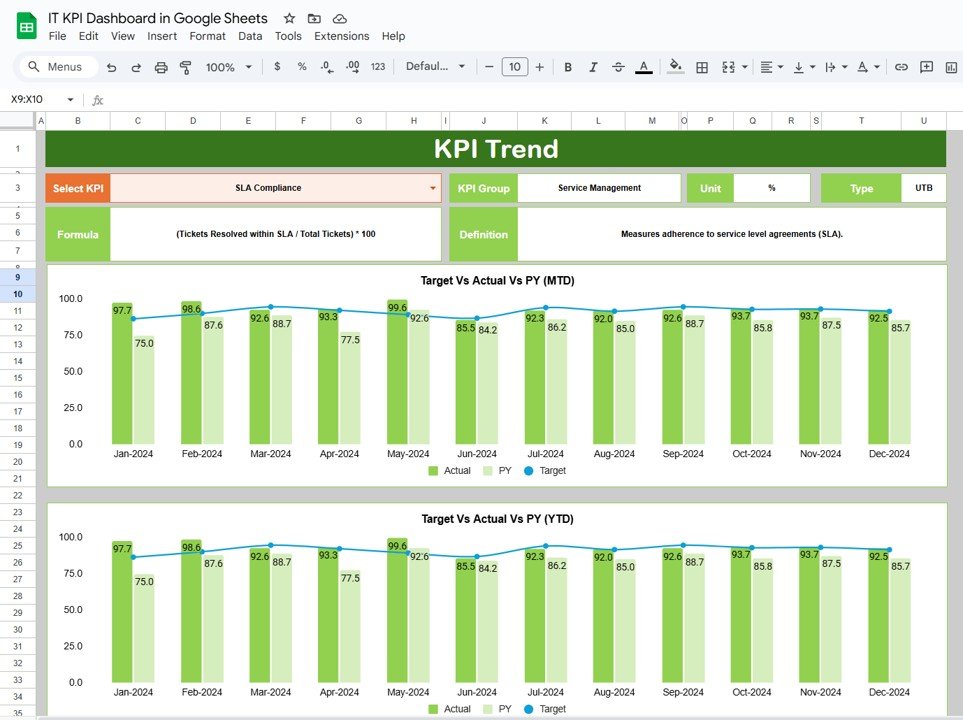
🎯 Goal Setting and Performance Comparison
Set specific targets for each KPI and compare actual performance against goals to ensure your IT systems are meeting business objectives.
🛠 Interactive Filtering and Drill-Down
Use interactive filters to view data by team, project, or time period, enabling deeper insights and more granular analysis of your IT performance.
🔔 Automated Alerts
Set up automatic alerts for key metrics such as network outages, high ticket volume, or system failures, ensuring that your team can respond quickly to critical issues.
💼 Advanced Reporting
Generate detailed reports and summaries for IT performance reviews, audits, or stakeholder presentations, allowing you to communicate results effectively.
🚀 Why You’ll Love the IT KPI Dashboard in Google Sheets:
✅ Monitor IT System Performance – Track uptime, network speed, server health, and system availability to ensure seamless IT operations.
✅ Optimize Helpdesk Efficiency – Monitor ticket resolution times, ticket volume, and customer satisfaction to improve your helpdesk operations and reduce backlog.
✅ Enhance IT Security – Track security incidents, breaches, and compliance metrics to ensure that your IT infrastructure is secure and compliant.
✅ Improve Resource Allocation – Use data insights to allocate IT resources efficiently, reducing unnecessary downtime and improving service delivery.
✅ Simplify Reporting and Analysis – Use the interactive dashboard to generate detailed reports for meetings, performance reviews, and audits with ease.
✅ Customizable and Scalable – Tailor the dashboard to fit your specific IT requirements, whether you are tracking network performance, system reliability, or helpdesk metrics.
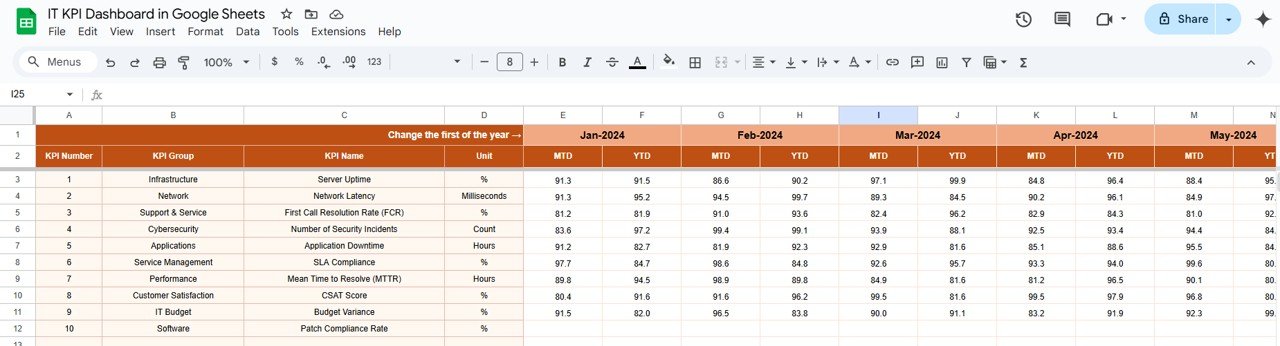
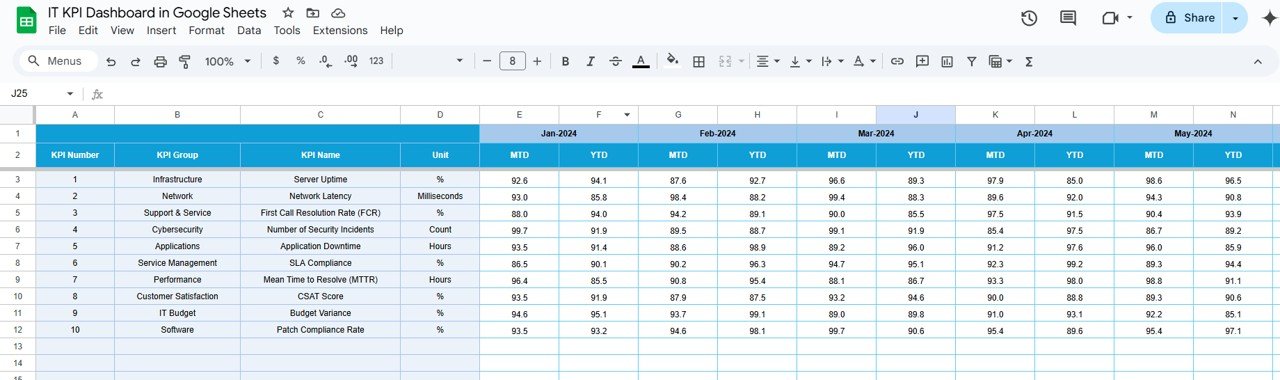
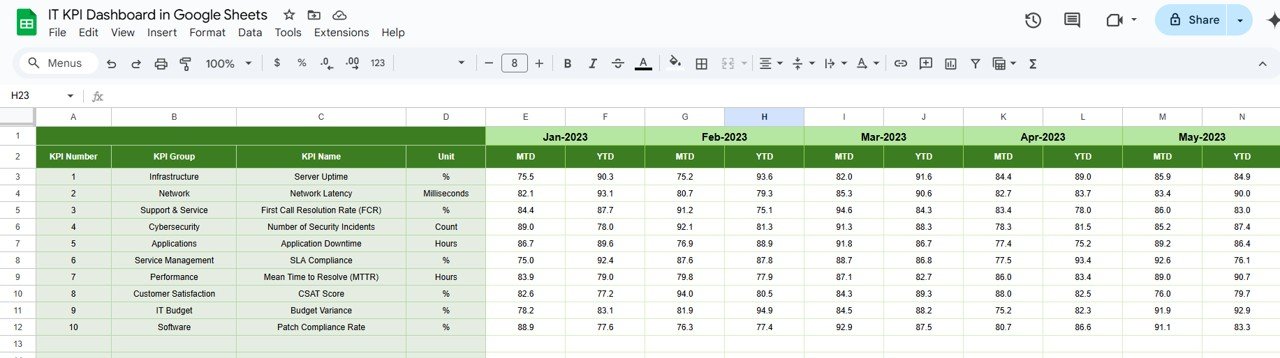
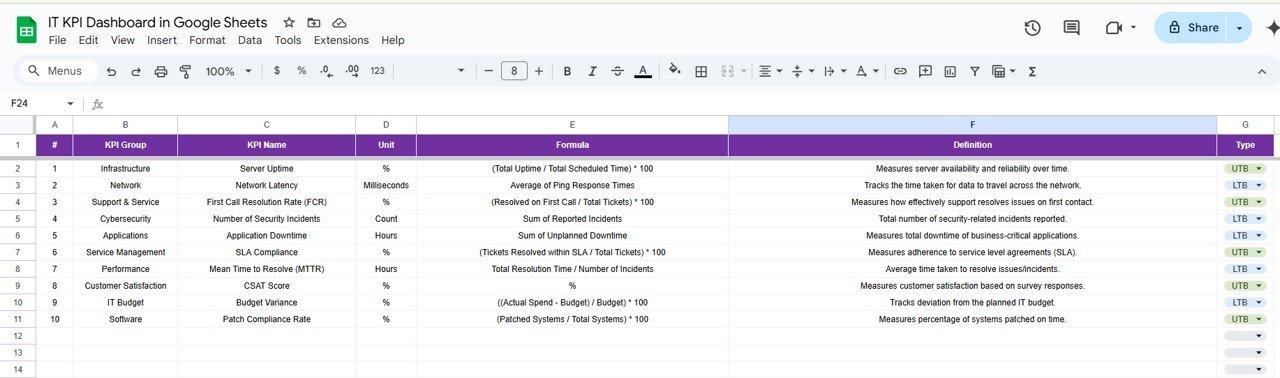
What’s Inside the IT KPI Dashboard in Google Sheets:
- System Uptime KPI: Track system availability and uptime for critical infrastructure, including servers, networks, and services.
- Network Performance KPI: Measure network speed, downtime, and latency to ensure fast and reliable connections across systems.
- Helpdesk Performance KPI: Monitor helpdesk ticket volume, resolution times, and customer satisfaction scores to improve support services.
- Security Metrics KPI: Track security incidents, breach attempts, and compliance with industry standards to ensure system security.
- Server Health KPI: Monitor the performance of critical servers, tracking CPU usage, disk space, and other key metrics to prevent system failures.
- Incident Response KPI: Track the time it takes to respond to and resolve critical incidents, ensuring minimal downtime and efficient issue resolution.
- Employee Productivity KPI: Measure employee performance metrics, such as response times and task completion rates, to optimize IT team efficiency.
How to Use the IT KPI Dashboard in Google Sheets:
1️⃣ Download the Template – Instantly access your Google Sheets file upon purchase.
2️⃣ Input Your IT Data – Enter key performance data such as uptime, ticket resolution, and network metrics into the provided fields.
3️⃣ Set Goals and Targets – Define your KPIs for uptime, ticket resolution, security incidents, and other metrics to align with your IT objectives.
4️⃣ Track Performance – Monitor real-time performance updates, adjust resources, and identify performance bottlenecks across your IT systems.
5️⃣ Generate Reports – Use Google Sheets’ reporting features to generate performance reports for management meetings, audits, and reviews.
Who Can Benefit from the IT KPI Dashboard in Google Sheets:
- IT Managers
- Network Administrators
- Helpdesk Teams
- IT Security Officers
- Business Owners
- Operations Managers
- IT Support Teams
- Data Analysts
The IT KPI Dashboard in Google Sheets is the ultimate solution for IT professionals looking to monitor, analyze, and optimize their IT operations for better performance, security, and service delivery.
Click here to read the Detailed blog post
https://neotechnavigators.com/it-kpi-dashboard-in-google-sheets/
Visit our YouTube channel to learn step-by-step video tutorials
Youtube.com/@PKAnExcelExpert


Reviews
There are no reviews yet.