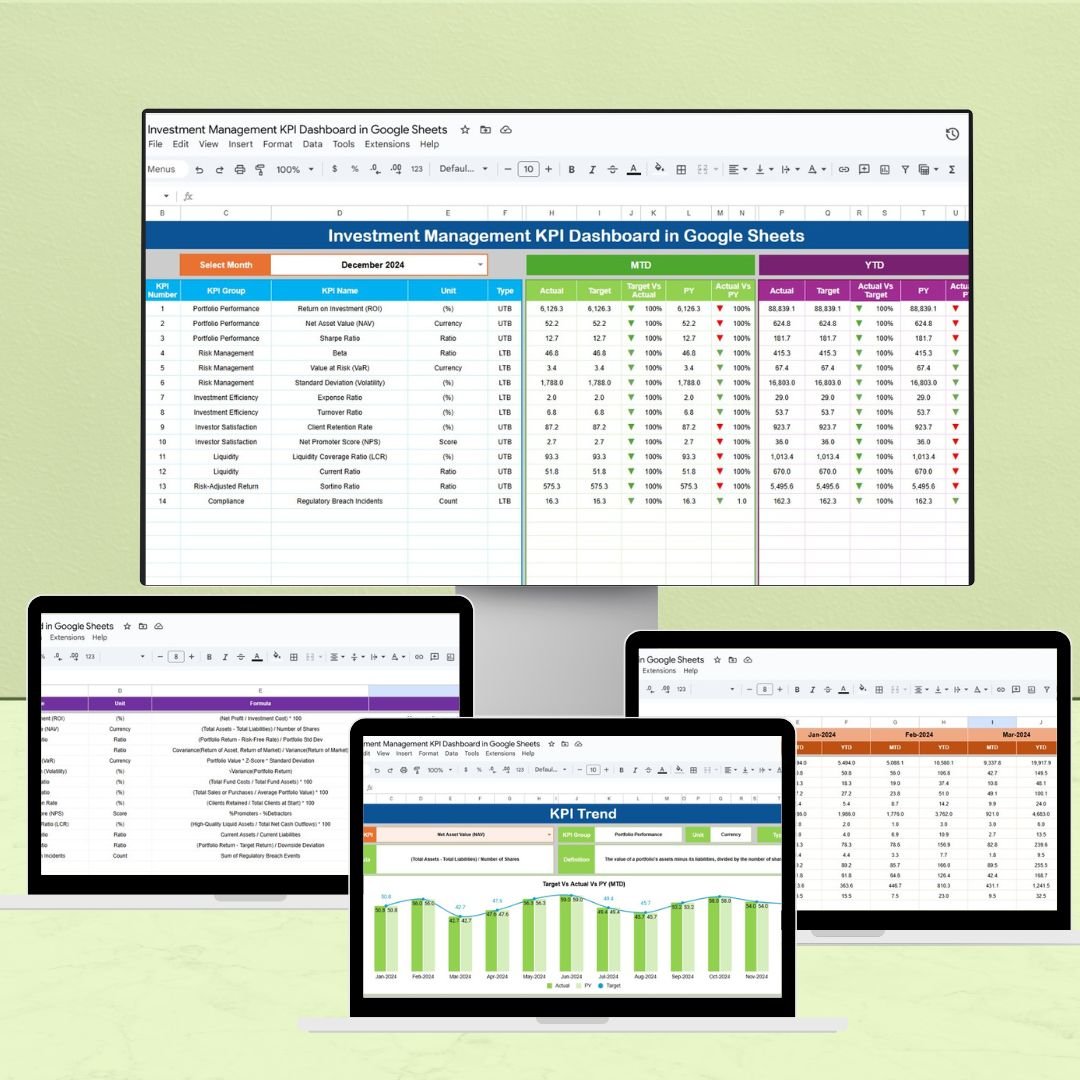

The Investment Management KPI Dashboard in Google Sheets is a comprehensive tool designed to assist investment professionals and portfolio managers in monitoring, analyzing, and optimizing key performance indicators (KPIs) across their investment portfolios. This intuitive and customizable dashboard allows you to track critical metrics such as portfolio performance, asset allocation, risk factors, and individual investment returns, all within an easy-to-use Google Sheets template.
Key Features of the Investment Management KPI Dashboard in Google Sheets
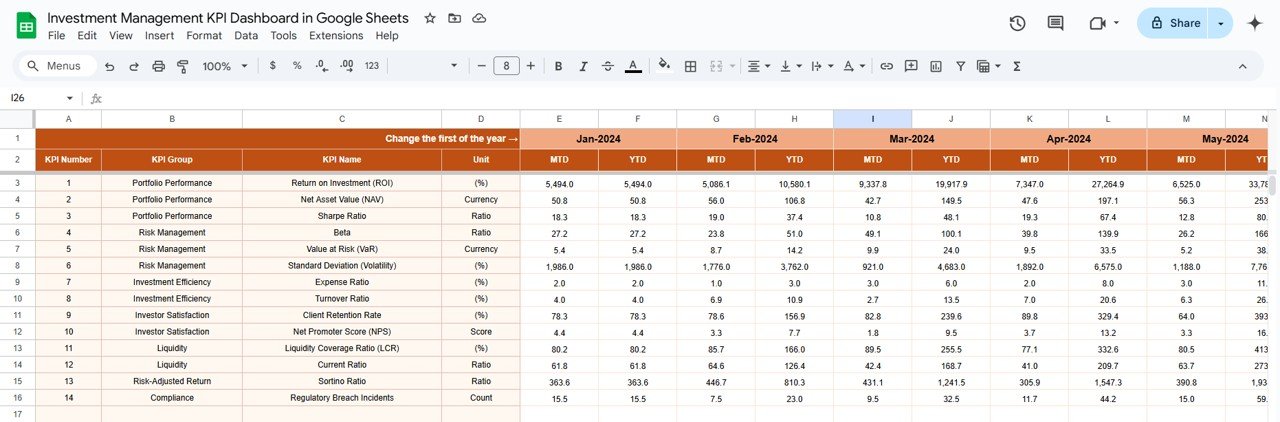
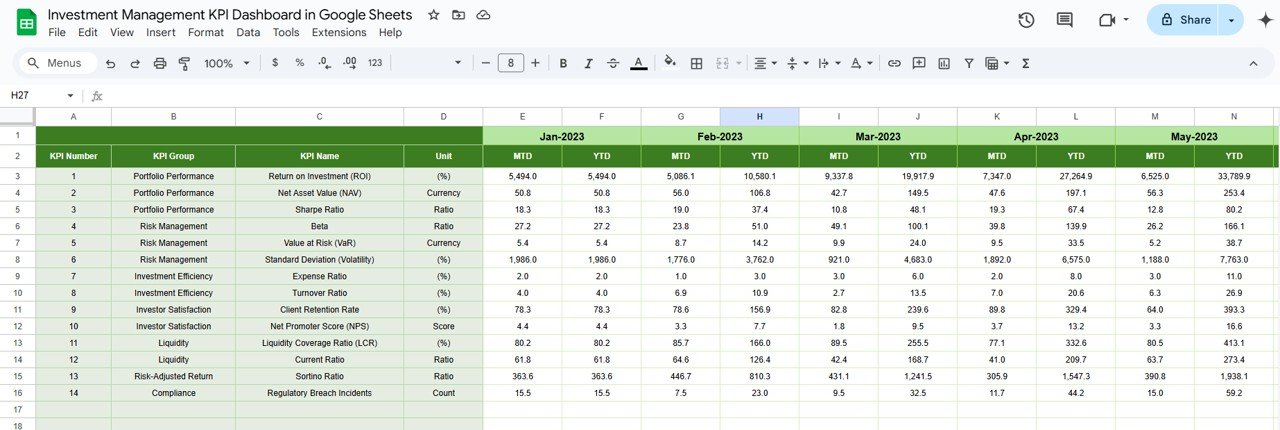
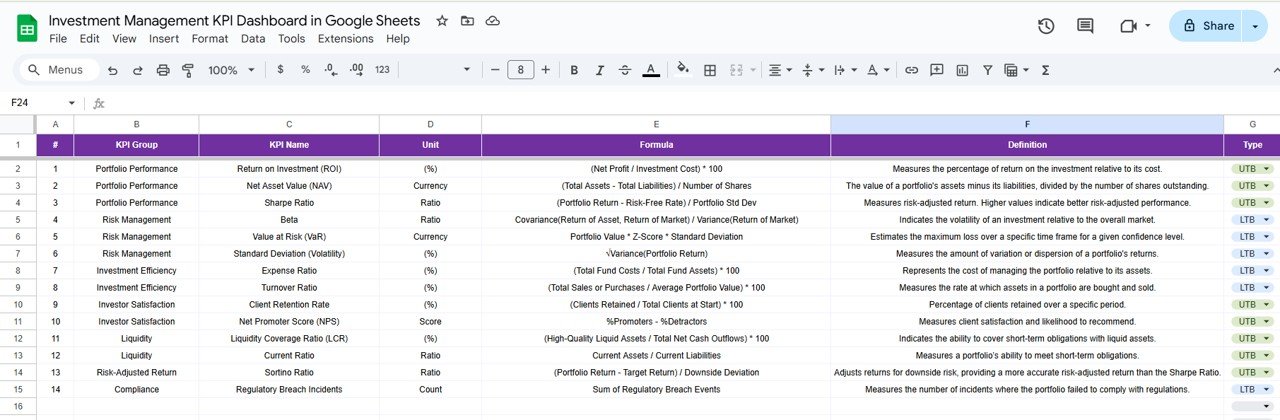
📊 Comprehensive KPI Tracking
-
Monitor Key Metrics: Track essential KPIs such as return on investment (ROI), portfolio diversification, Sharpe ratio, alpha, beta, and maximum drawdown.
-
Tailored for Your Portfolio: Customize the dashboard to reflect your specific investment goals and portfolio structure.
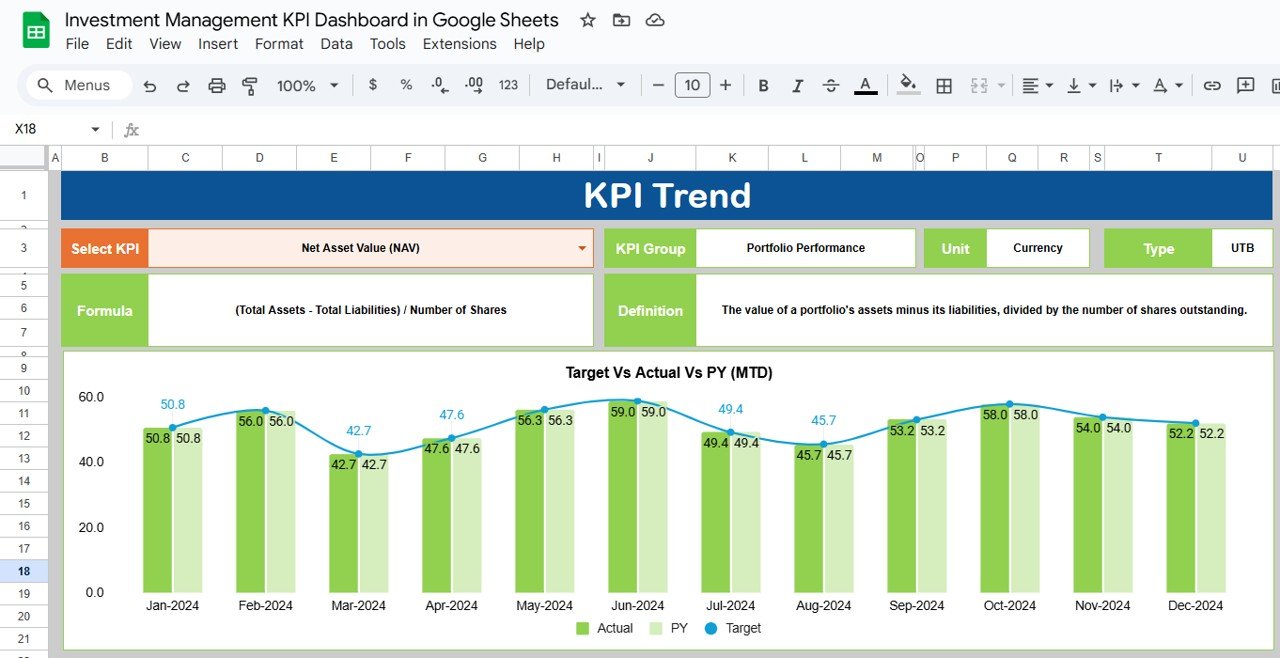
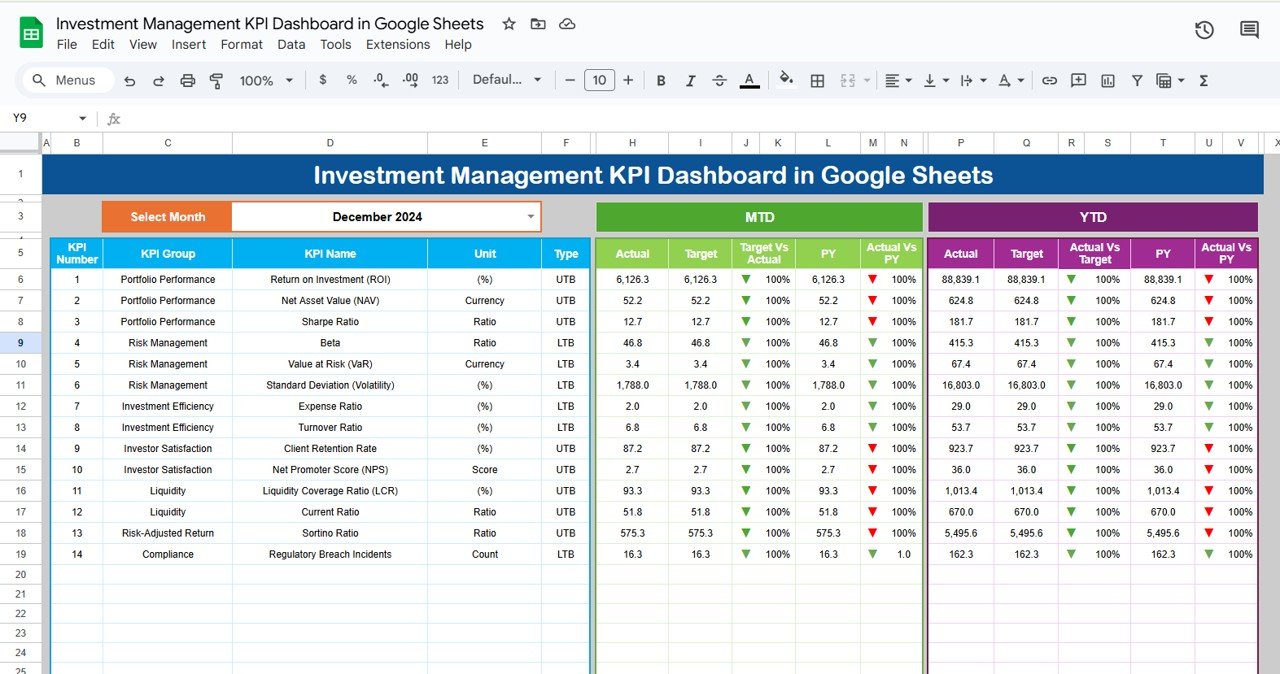
📈 Visual Analytics
-
Interactive Charts and Graphs: Visualize investment trends, asset allocation, and performance comparisons over time.
-
Identify Patterns: Use visual tools to spot trends in portfolio performance, risk levels, and returns.
🔧 Customizable Dashboard
-
Flexible and Adaptive: Customize the dashboard to add, remove, or modify KPIs to suit your investment tracking needs.
-
User-Friendly Design: Easy to navigate, this dashboard offers a straightforward layout to help users, regardless of their technical skills.
📅 Data Integration and Reporting
-
Automated Updates: Integrate real-time data from various sources to keep your dashboard up-to-date.
-
Report Generation: Create reports to assess portfolio health, investment returns, and risk management strategies.
Benefits of Using the Investment Management KPI Dashboard
✅ Informed Decision-Making
Access real-time data and key performance insights, enabling you to make informed decisions about investment strategies and portfolio adjustments.
✅ Enhanced Portfolio Management
Track and adjust asset allocation strategies, ensuring that your portfolio is diversified and aligned with your financial goals.
✅ Improved Risk Management
Monitor risk metrics such as Sharpe ratio and beta to ensure that your portfolio matches your desired risk tolerance.
✅ Increased Investment Returns
By tracking portfolio performance and individual investments, optimize your strategies to maximize returns and minimize losses.
How to Use the Investment Management KPI Dashboard in Google Sheets
-
Download the Template: Download the Investment Management KPI Dashboard template and save it to your Google Drive.
-
Input Data: Enter your investment details, including portfolio returns, asset allocation, and risk metrics.
-
Customize KPIs: Adjust the dashboard to reflect the KPIs that are most important for your portfolio management strategy.
-
Analyze Data: Use the visual tools to assess portfolio performance, track risk, and analyze trends.
-
Implement Strategies: Leverage insights to adjust your investment approach, enhance performance, and align with your financial goals.
By using the Investment Management KPI Dashboard in Google Sheets, investment professionals can gain valuable insights into portfolio performance and make more data-driven decisions to optimize returns and manage risk effectively.
Click here to read the Detailed blog post
Investment Management KPI Dashboard in Google Sheets
Visit our YouTube channel to learn step-by-step video tutorials
YouTube.com/@NeotechNavigators


Reviews
There are no reviews yet.