

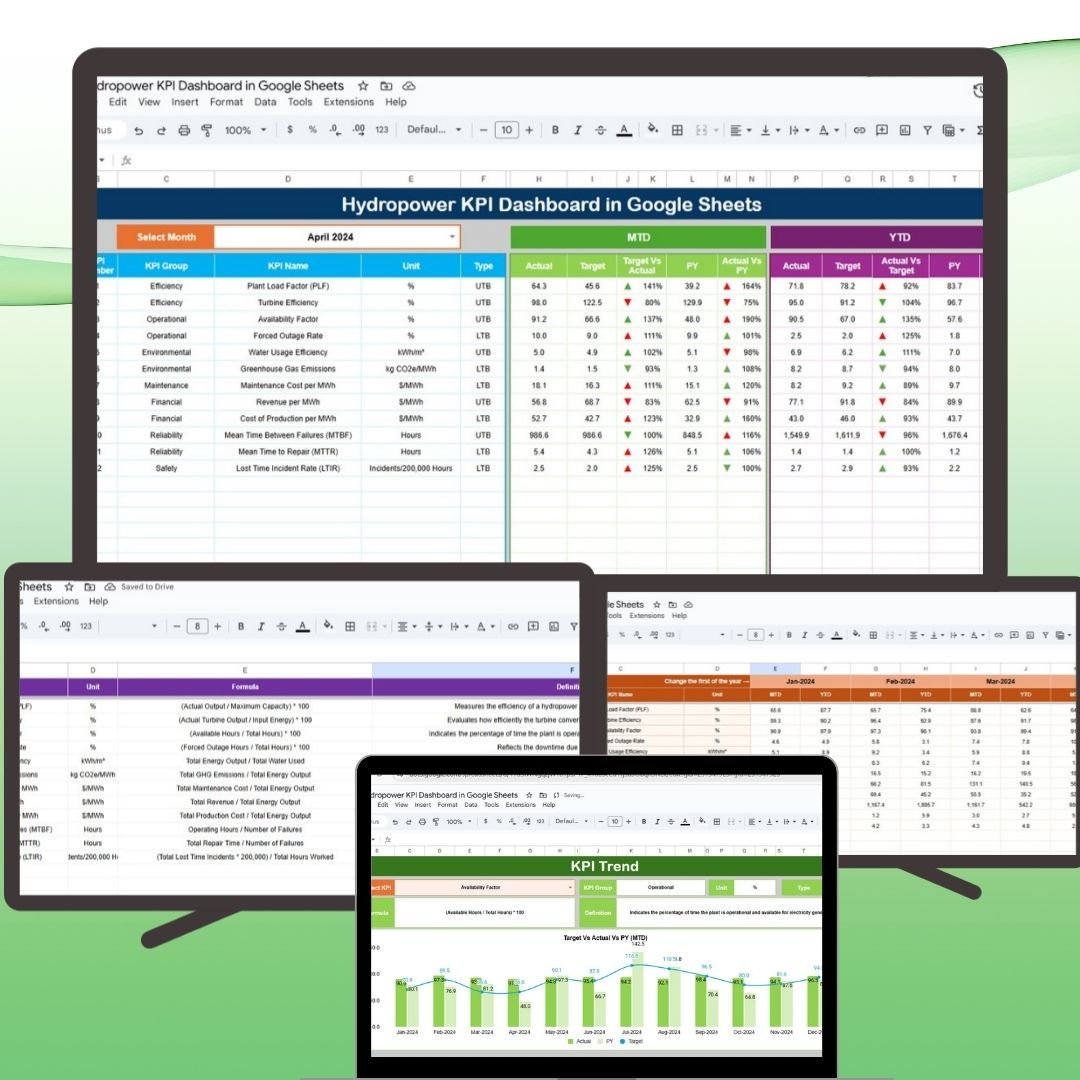

The Hydropower KPI Dashboard in Google Sheets is a powerful tool designed to help hydropower plant managers and stakeholders track and analyze critical performance metrics related to energy generation, efficiency, costs, and environmental impact. This customizable, real-time dashboard offers a comprehensive view of plant performance and supports data-driven decision-making for optimizing operations.
With this ready-to-use Google Sheets template, users can easily monitor key indicators like energy production, operational efficiency, and sustainability metrics, making it a must-have tool for managing hydropower plants.
📊 What’s Inside the Hydropower KPI Dashboard 📊
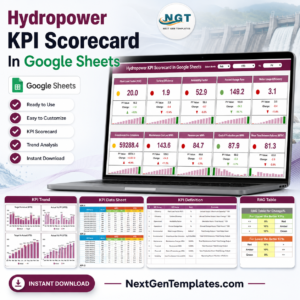
The Hydropower KPI Dashboard includes several distinct sheets that track various KPIs to ensure efficient plant operations:
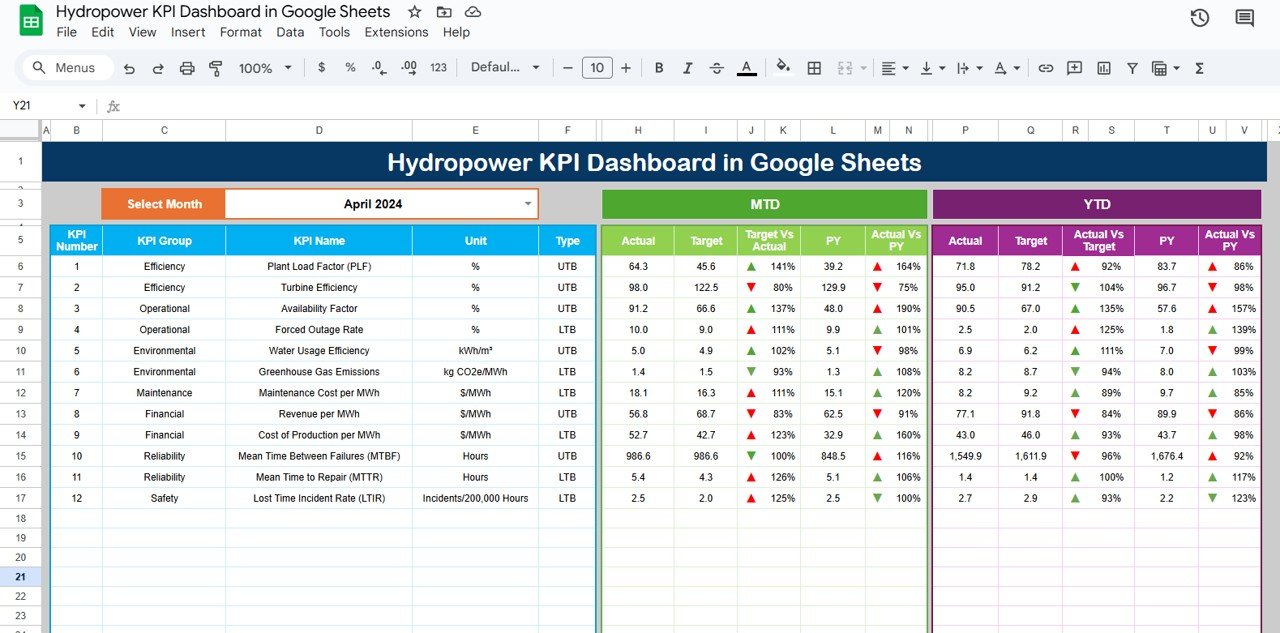
Dashboard Sheet Tab
Key Metrics Overview: View essential KPIs in a centralized location, such as:
Total Energy Generated (MWh): The total energy produced by the hydropower plant.
Energy Efficiency (%): Measures the plant’s operational efficiency.
Cost per MWh ($): The operational cost for each megawatt-hour generated.
Operational Cost per MWh ($): Tracks the overall cost of plant operations.
Environmental Impact (Carbon Offset): Tracks the environmental benefits of the hydropower plant, such as carbon offsets.
Month Dropdown: Easily switch between months for updated performance data.
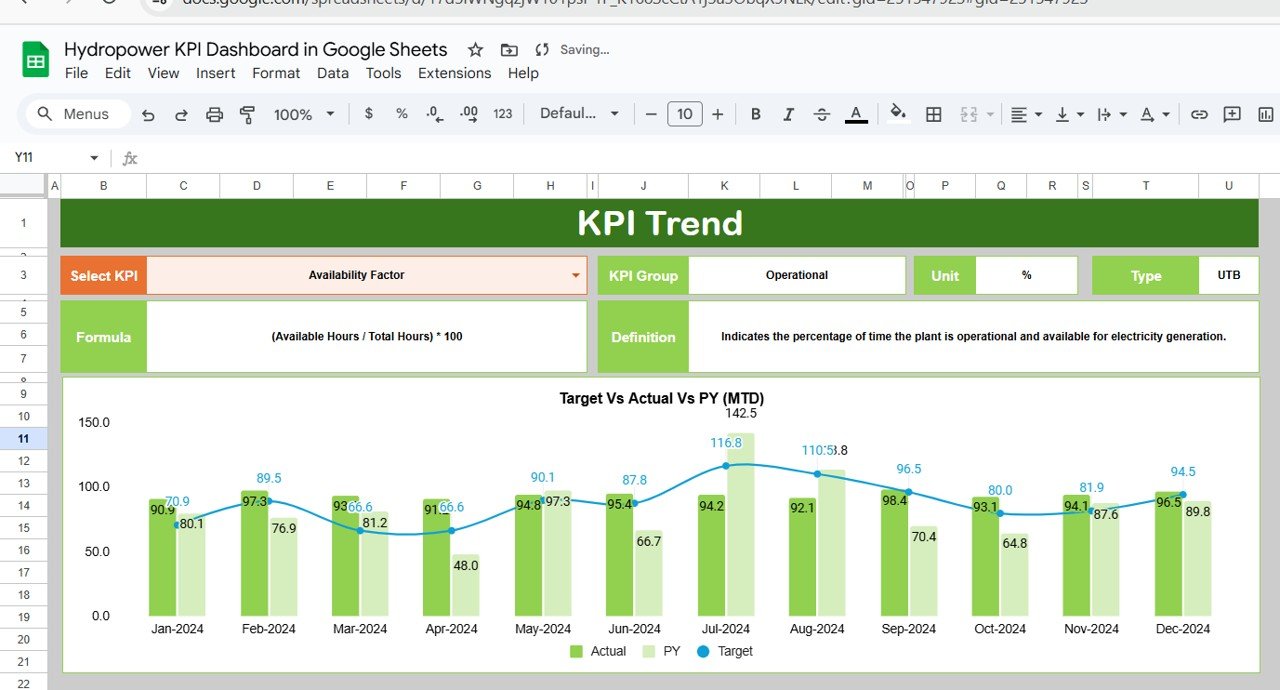
KPI Trend Sheet Tab
Trend Tracking: Monitor performance trends over time for each selected KPI, allowing for better long-term planning.
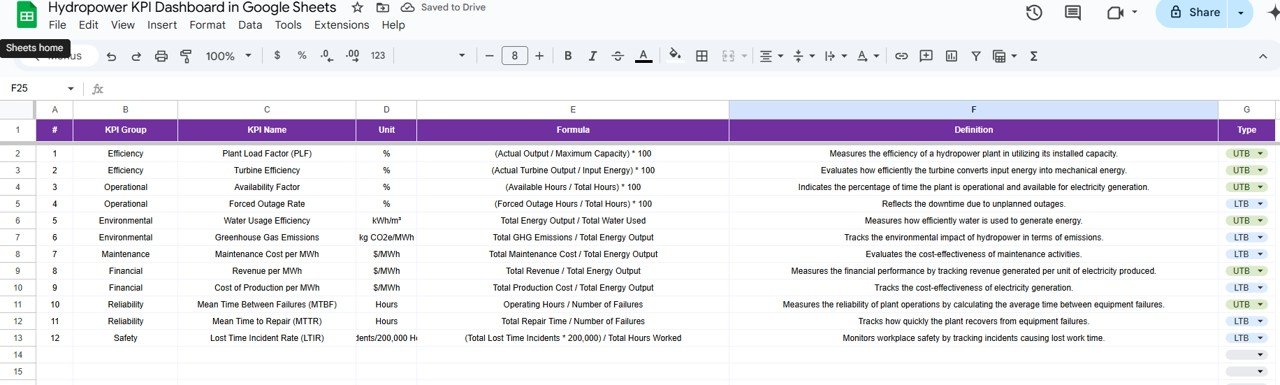
KPI Group, Unit, Type: Displays the KPI’s group (e.g., energy generation, maintenance), unit of measurement (e.g., MWh, $), and whether the KPI is “Lower the Better” (LTB) or “Upper the Better” (UTB).
Formula & Definition: Learn how each KPI is calculated and what it measures.
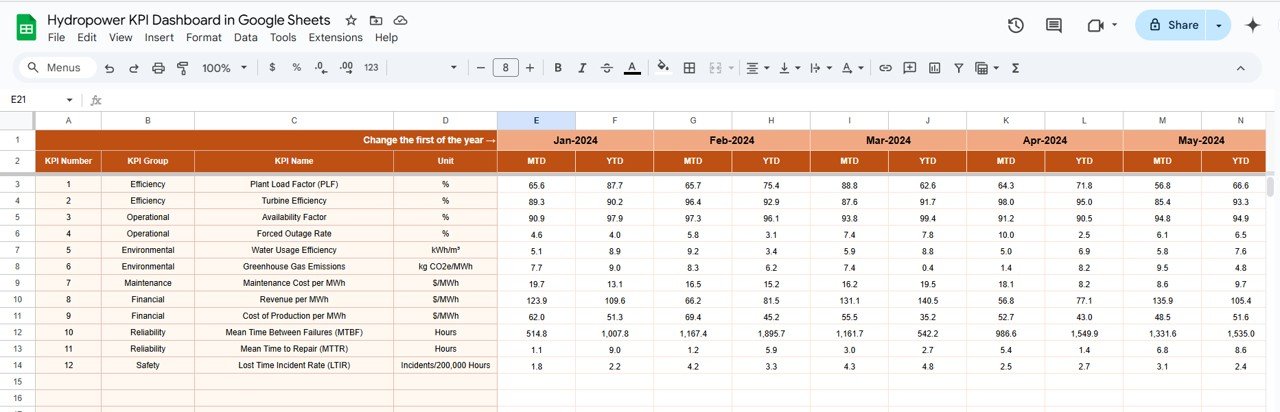
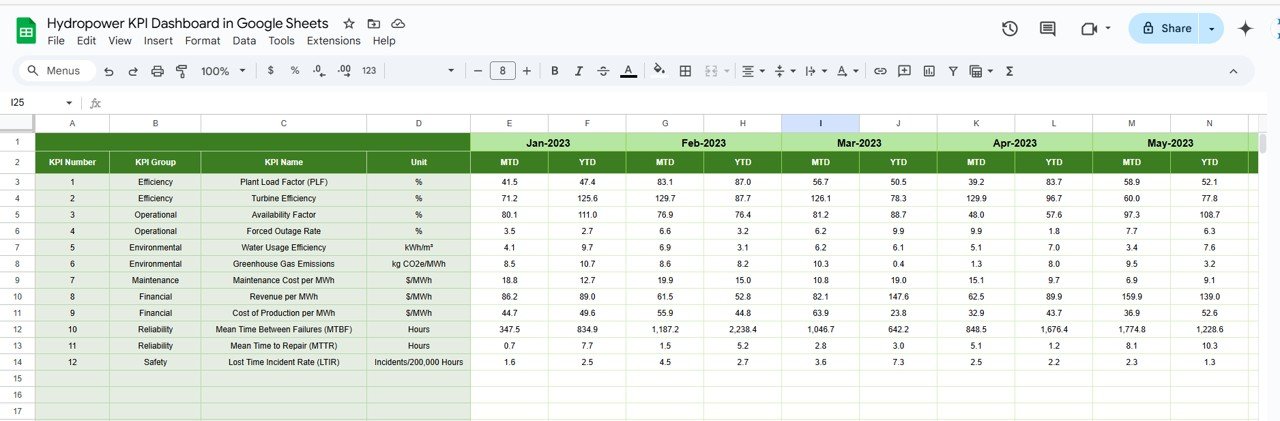
Actual Numbers Sheet Tab
Data Entry: Input monthly actual performance data to keep the dashboard updated with real-time data.
Month Selection: Choose the first month of the year to auto-update the data across the dashboard.
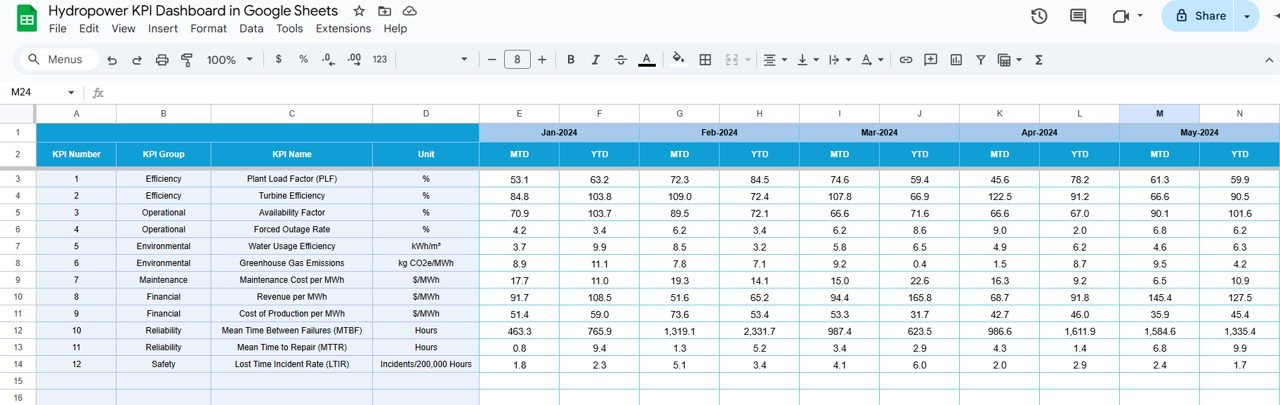
Target Sheet Tab
Set Targets: Enter target values for each KPI to compare actual performance with the goals you’ve set for the plant.
Previous Year Number Sheet Tab
Historical Data: Compare current performance with data from the previous year, allowing you to track trends and assess improvements.
KPI Definition Sheet Tab
Detailed Explanations: View clear definitions and formulas for each KPI, helping users better understand the data and its impact on performance.
⚙️ How to Use the Hydropower KPI Dashboard ⚙️
Input Actual Data: Enter actual performance data for each KPI into the Actual Numbers Sheet to update the dashboard automatically.
Set Targets: Define target values for each KPI in the Target Sheet to track progress and compare against actual results.
Track and Visualize: Use the Dashboard Sheet to view key performance metrics, trends, and comparisons to assess the efficiency and performance of your hydropower plant.
Analyze Trends: Use the KPI Trend Sheet to analyze data over time and identify areas for operational improvements.
🌍 Who Can Benefit from This Hydropower KPI Dashboard 🌍
Hydropower Plant Managers: Track operational performance, energy production, and efficiency to ensure that plant operations are running smoothly.
Energy Analysts: Analyze trends in energy generation and system efficiency, helping to forecast future energy production and optimize resource use.
Project Managers: Ensure that all projects meet energy production goals and are operating efficiently by tracking key metrics.
Sustainability Officers: Monitor environmental impacts, such as carbon offsets, to ensure that your hydropower plant is contributing to sustainability goals.
Investors and Stakeholders: Gain a comprehensive view of plant performance and profitability to make informed decisions about investments and resource allocation.
🌟 Benefits of Using the Hydropower KPI Dashboard 🌟
Real-Time Monitoring: Track KPIs in real-time to make immediate adjustments to improve performance and operational efficiency.
Comparative Analysis: Easily compare actual performance against targets and historical data, allowing for better decision-making.
Financial Insights: Monitor financial performance with metrics like cost per MWh and operational cost per MWh to ensure your plant is operating cost-effectively.
Sustainability Tracking: Measure the environmental impact of your hydropower plant, including carbon offsets, ensuring your operations align with sustainability goals.
Customizable: Tailor the dashboard to meet your specific needs, including adding or removing KPIs and modifying the layout for a better user experience.
Click here to read the detailed blog post
Watch the step-by-step video Demo:
Visit our YouTube channel to learn step-by-step video tutorials
Compatibility and Requirements
- Works in Google Sheets with a free Google account and a web browser.
- Make a copy to your own Google Drive, then share it with your team if you want to work on it together.
- New to Sheets? Google’s guide How to use Google Sheets covers the basics.
Frequently Asked Questions
Which KPIs are on the Hydropower KPI Dashboard?
Total Energy Generated (MWh), Energy Efficiency (%), Cost per MWh, Operational Cost per MWh and Environmental Impact (carbon offset), plus any KPIs you add.
What sheet tabs are included?
Six: Dashboard, KPI Trend, Actual Numbers, Target, Previous Year Number and KPI Definition.
How do I switch between months?
Pick the month from the dropdown on the Dashboard tab. On the Actual Numbers tab you choose the first month of the year once, and the dates follow from it.
Can I compare results with targets and last year?
Yes. Enter targets on the Target tab and last year’s figures on the Previous Year Number tab, and the dashboard compares them with the actual numbers.
What do LTB and UTB mean?
Each KPI is marked Lower the Better (LTB) or Upper the Better (UTB), so the dashboard knows which direction counts as an improvement.
Related Hydropower and Energy Templates
- Hydropower KPI Dashboard in Power BI: the same KPI dashboard in Power BI
- Hydropower KPI Dashboard in Excel: the same KPI dashboard in Excel
- Hydropower KPI Scorecard In Google Sheets: a hydropower KPI scorecard in Google Sheets
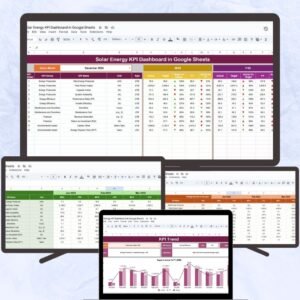
- Solar Energy KPI Dashboard in Google Sheets: KPIs for solar energy in Google Sheets
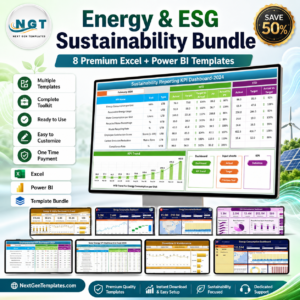
- Energy & ESG Sustainability Bundle: energy and ESG templates in one bundle
Browse all Google Sheets KPI dashboards.










Reviews
There are no reviews yet.