

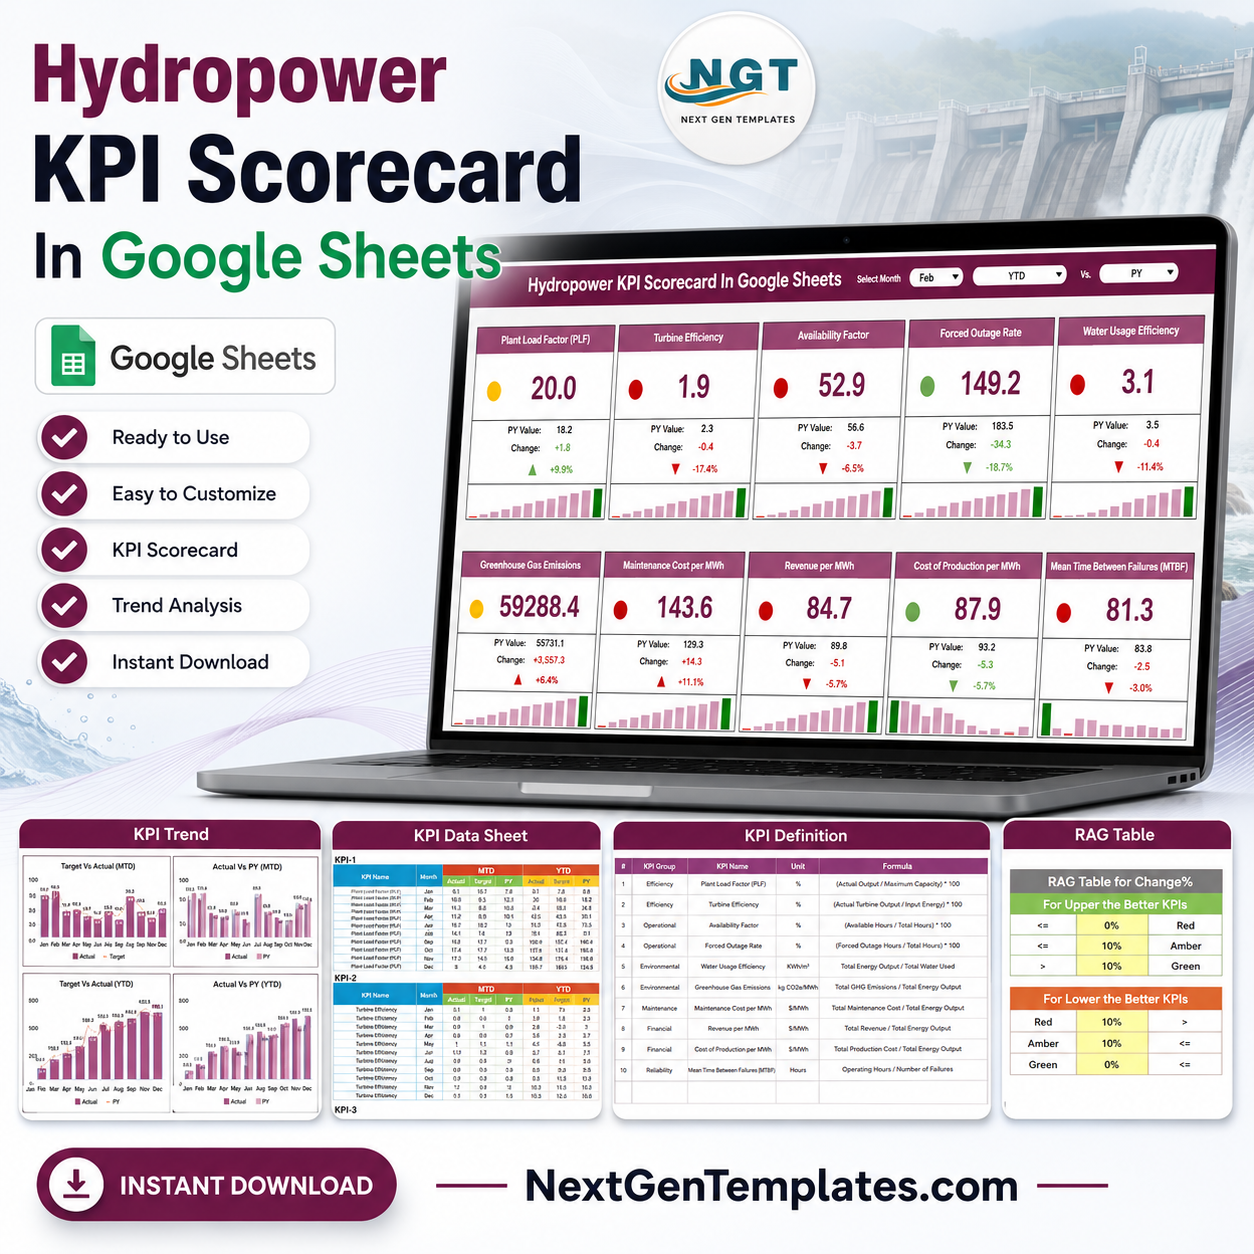
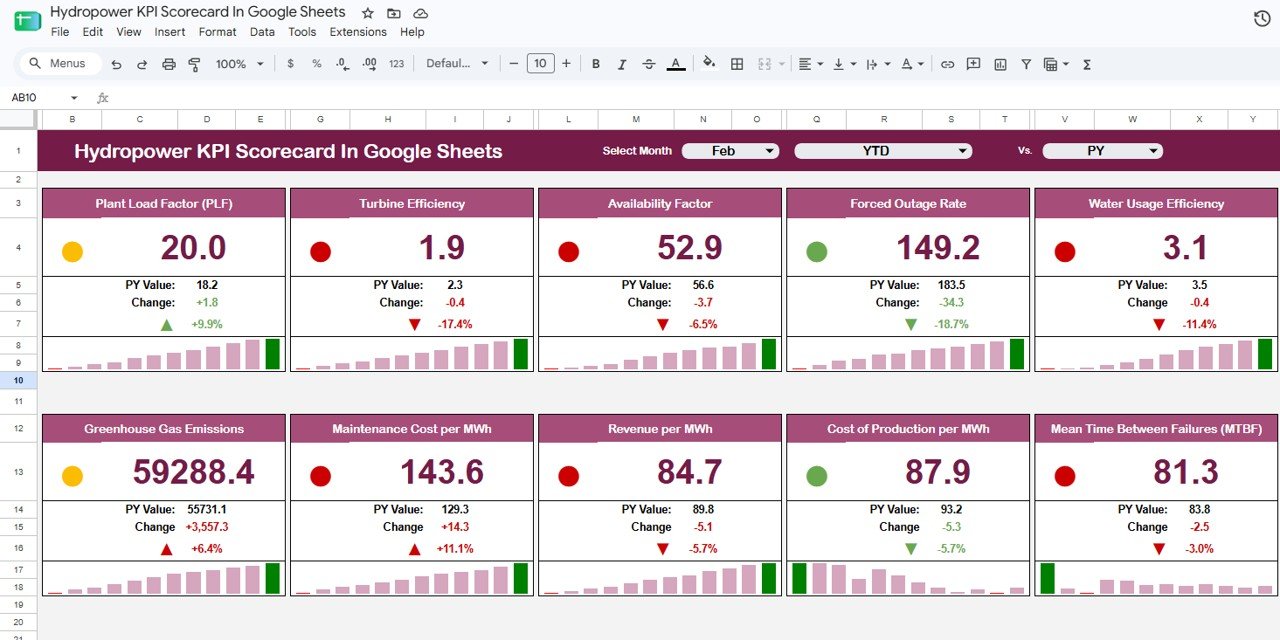
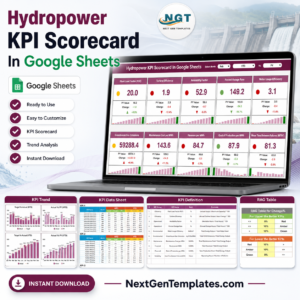
The Hydropower KPI Scorecard In Google Sheets tracks 10 plant performance KPIs across 6 groups (Efficiency, Operational, Environmental, Maintenance, Financial, Reliability), each with month-to-date and year-to-date values, prior-year comparison, and automatic Red-Amber-Green status. Switch the reporting month from one dropdown and every card, arrow, and sparkline recalculates. Setup takes under 10 minutes — paste your monthly readings into the 10 KPI data tabs and the scorecard fills itself in.
🌍 Join 8,400+ teams in 40+ countries using NextGenTemplates to replace paid SaaS tools with one-time-purchase Excel, Google Sheets, Power BI, and HTML templates.
✅ Instant download · One-time payment · No subscription · No per-user fees · Lifetime access
🔑 Key Features of the Hydropower KPI Scorecard in Google Sheets
📊 Ten hydropower KPIs in one view. The scorecard tracks Plant Load Factor (PLF), Turbine Efficiency, Availability Factor, Forced Outage Rate, Water Usage Efficiency, Greenhouse Gas Emissions, Maintenance Cost per MWh, Revenue per MWh, Cost of Production per MWh, and Mean Time Between Failures (MTBF) — grouped under Efficiency, Operational, Environmental, Maintenance, Financial, and Reliability.
🗓️ Month picker with MTD/YTD toggle. Choose any month (Jan–Dec) and flip between month-to-date and year-to-date. Every KPI card, delta, and sparkline updates from the same control set, so a single view serves both monthly reviews and cumulative annual reporting.
🔺 Prior-year comparison on every card. Each tile shows the current value, the PY value, the absolute change, and the percentage change with a colored up or down arrow — so you see performance and direction at a glance without opening a second report.
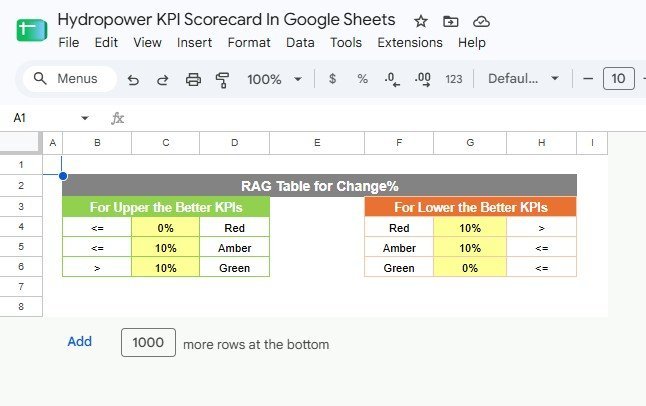
🟢 Automatic Red-Amber-Green scoring. A built-in RAG threshold table drives the status dot on each card. It handles both “Upper-the-Better” KPIs (like PLF and Revenue per MWh) and “Lower-the-Better” KPIs (like Forced Outage Rate and Cost of Production per MWh) using separate rules you can edit.
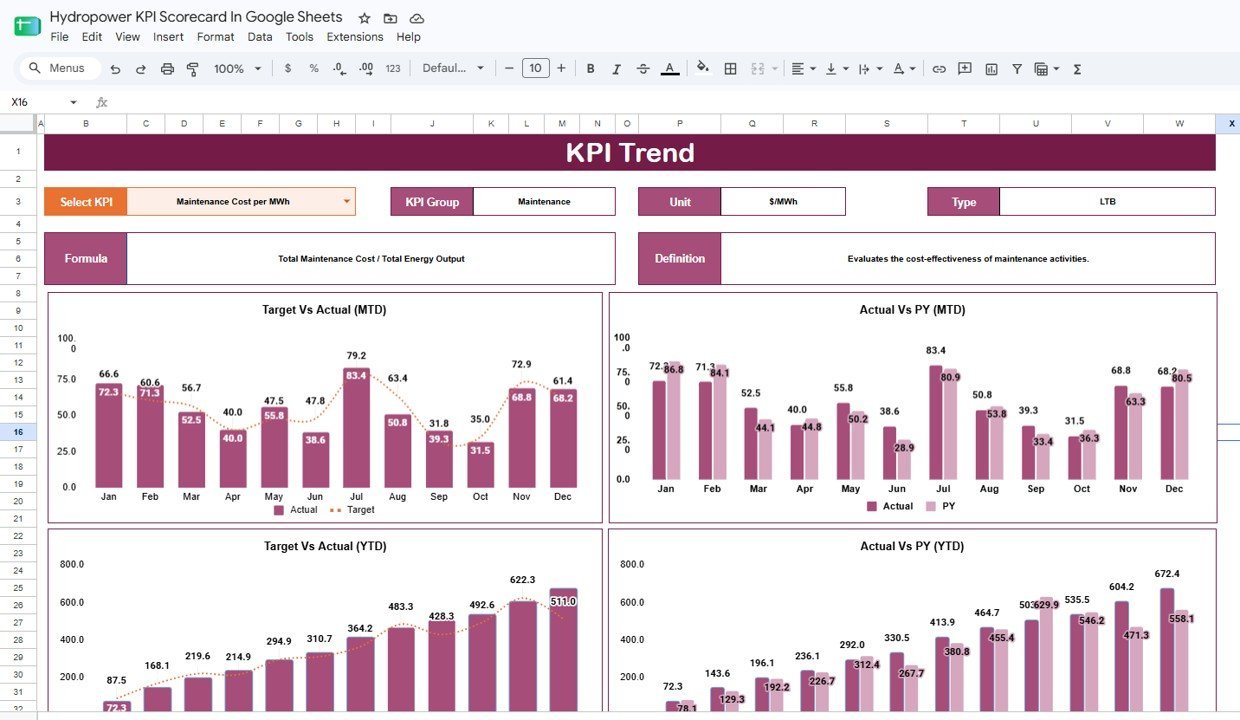
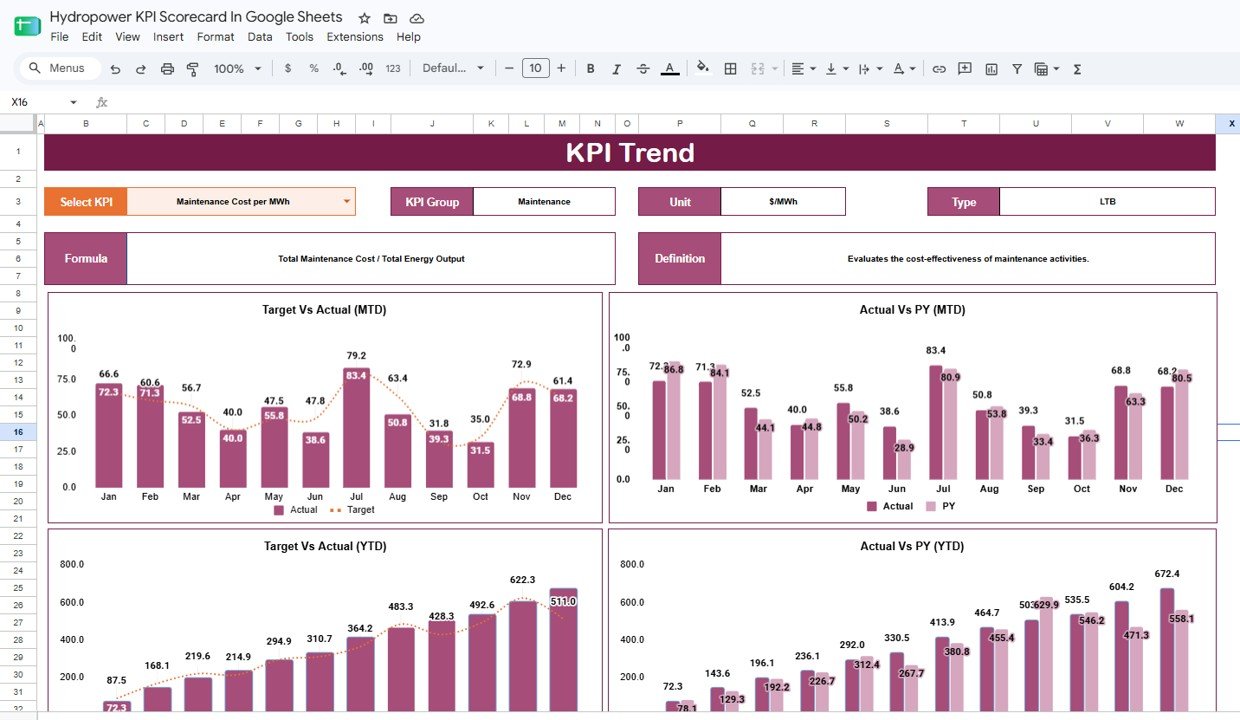
📈 Dedicated KPI Trend page. Pick any KPI from a dropdown and read its group, unit, formula, definition, and Upper/Lower-the-Better type, alongside four charts: Target vs Actual (MTD), Actual vs PY (MTD), Target vs Actual (YTD), and Actual vs PY (YTD).
📦 What’s Inside the Hydropower KPI Scorecard in Google Sheets
Page 1: KPI Scorecard
The main dashboard shows all 10 KPIs as cards in two rows, each with a RAG status dot, the current value, PY value, absolute and % change with an arrow, and a 12-month sparkline. Top controls let you Select Month, toggle MTD vs YTD, and compare against PY.
Page 2: KPI Trend
Select any KPI to see its KPI Group, Unit, Type, formula, and definition, plus four trend charts: Target vs Actual (MTD), Actual vs PY (MTD), Target vs Actual (YTD), and Actual vs PY (YTD). Charts include Actual by Month, Target by Month, and PY by Month.
Page 3: KPI Data Sheets (KPI-1 to KPI-10)
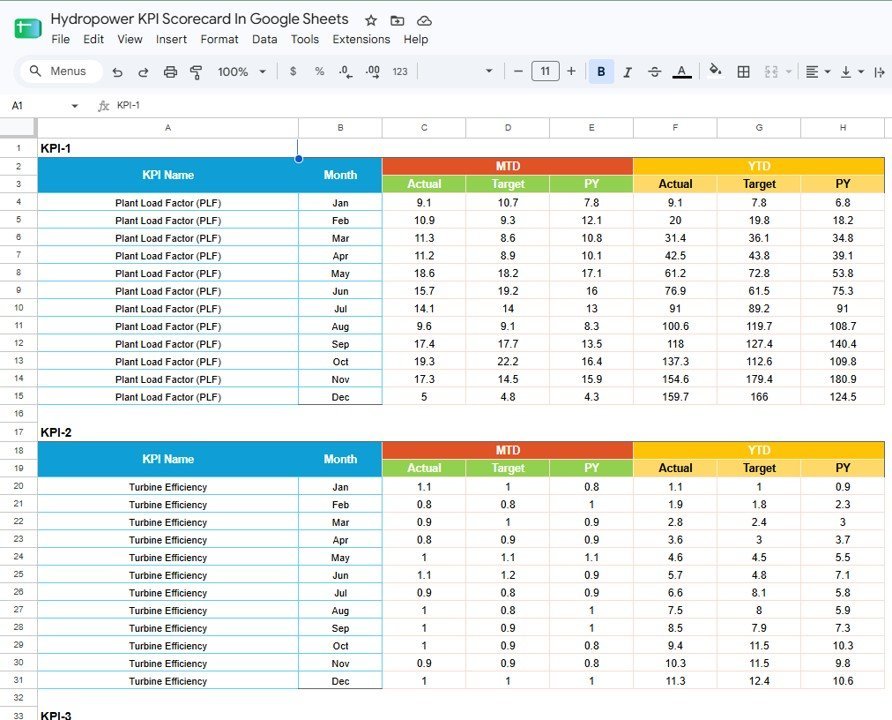
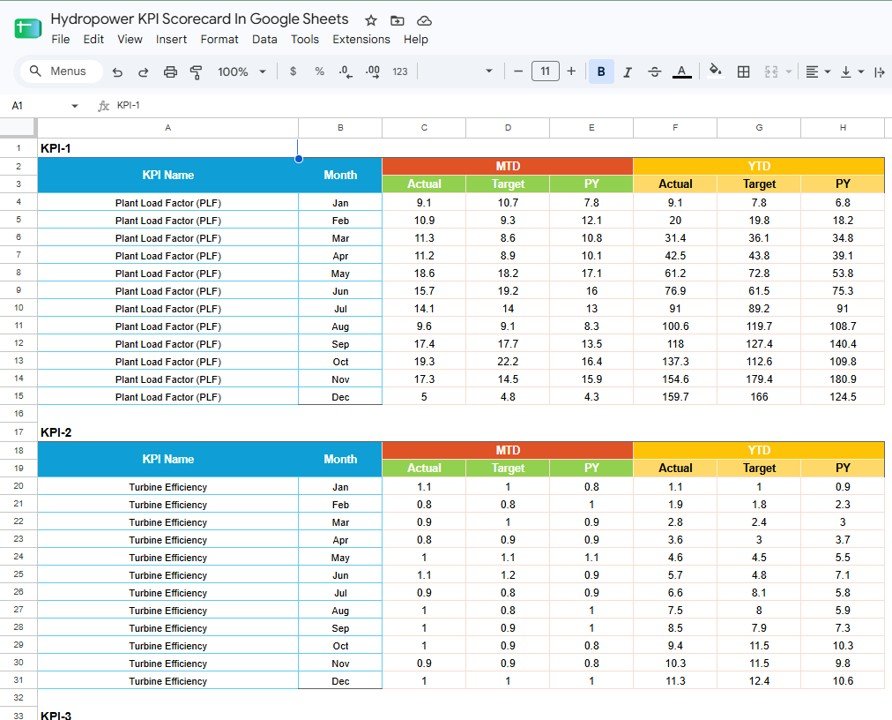
Each KPI has its own input block with Month (Jan–Dec) and six value columns: MTD Actual, MTD Target, MTD PY, YTD Actual, YTD Target, and YTD PY. This is where you paste your monthly plant readings; the scorecard and trend page read directly from here.
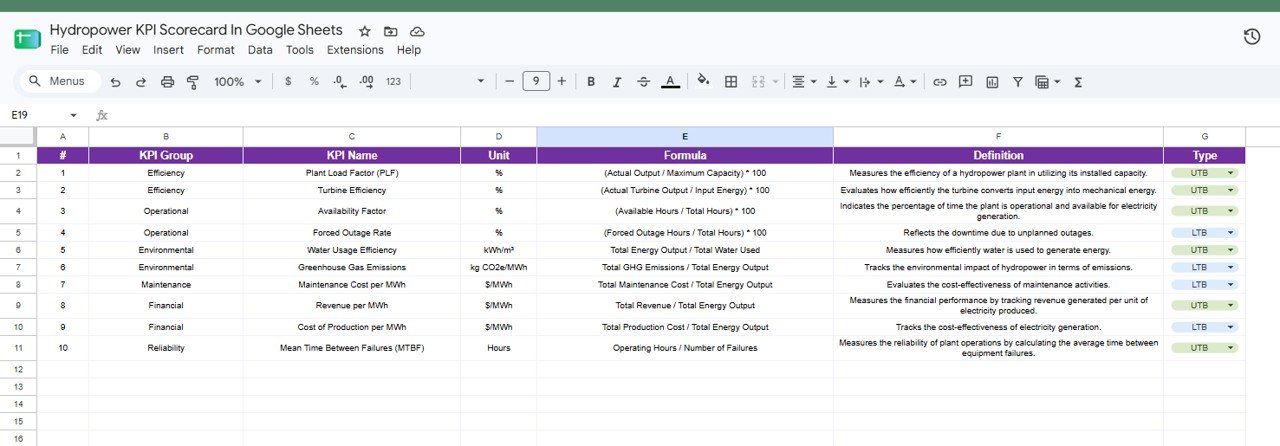
Page 4: KPI Definition Sheet
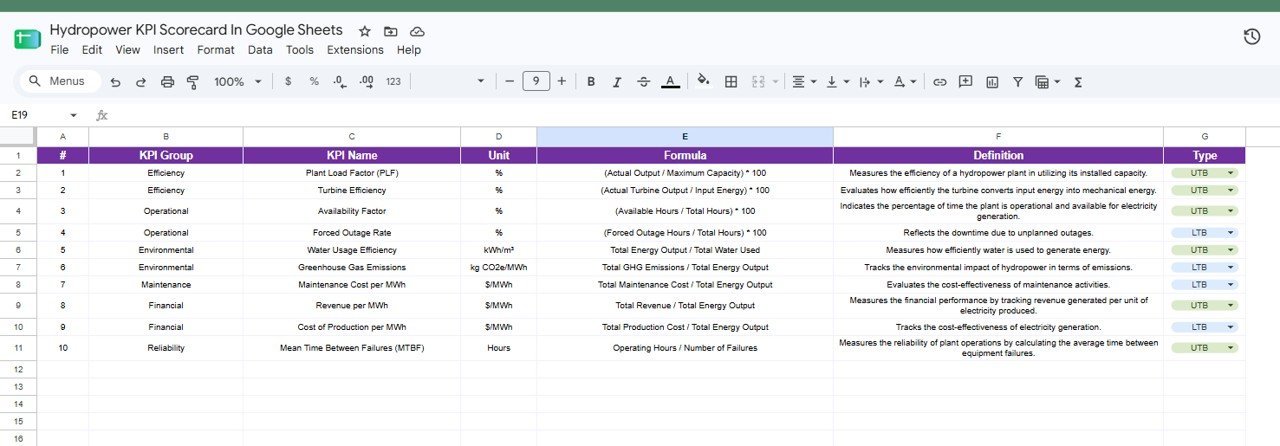
A reference table listing all 10 KPIs with columns for #, KPI Group, KPI Name, Unit, Formula, Definition, and Type (UTB/LTB). For example, Plant Load Factor = (Actual Output / Maximum Capacity) × 100, and Greenhouse Gas Emissions = Total GHG Emissions / Total Energy Output.
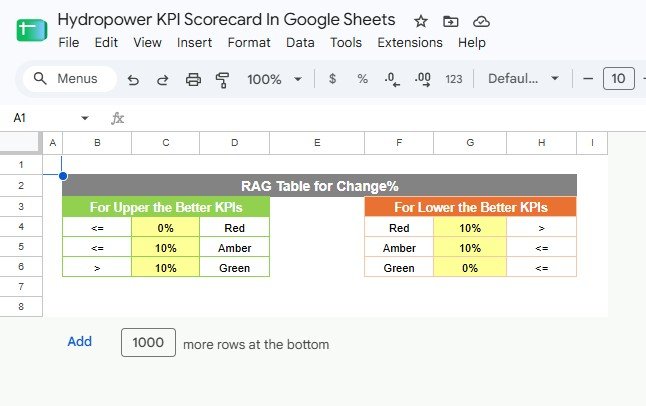
Page 5: RAG Threshold Table
An editable table that sets the Red/Amber/Green cut-offs for Change%. It has two sides — one for “Upper-the-Better” KPIs and one for “Lower-the-Better” KPIs — so you can tune status logic without touching any formulas on the scorecard.
📊 Hydropower KPI Scorecard: Google Sheets vs. Microsoft Excel vs. Paid BI Software — Where This Fits
| Feature | Hydropower KPI Scorecard (Google Sheets) | Microsoft Excel Scorecard | Power BI Pro / Tableau |
|---|---|---|---|
| Cost | $8.99 one-time | $10–30 one-time | $10–70 / user / month |
| Platform | Google Sheets (browser) | Desktop Excel | Desktop app + cloud service |
| Setup time | ✅ Under 10 minutes | Under 10 minutes | Hours to days |
| Real-time team collaboration | ✅ Built in | Limited | ✅ Yes |
| Mobile access | ✅ Any browser / Sheets app | Excel mobile | App required |
| Editable RAG thresholds | ✅ Simple table | ✅ Yes | Needs DAX/config |
| Share with link | ✅ One click | File send | License required |
| Year-1 cost at 5 users | $8.99 total | ~$30 total | $600–4,200 |
For plant and operations teams that want month-over-month and prior-year KPI tracking without paying per-user BI fees, the Hydropower KPI Scorecard in Google Sheets sits in the sweet spot.
👥 Who This Template Is For — and Who It’s Not For
✅ This template is built for:
- Hydropower plant managers and operations leads tracking monthly PLF, availability, and outage rates
- Performance and reliability engineers who report Target vs Actual and Actual vs PY each month
- Renewable energy analysts and consultants who need a fast, shareable scorecard without BI licensing
❌ This template is NOT for:
- Teams needing live SCADA or sensor integration — this template uses manual monthly inputs
- Enterprises requiring row-level security, SSO, or automated data pipelines
⚙️ How to Use the Hydropower KPI Scorecard in Google Sheets
- Open the PDF in your download and click the link to copy the sheet into your own Google Drive.
- Go to the KPI-1 to KPI-10 data tabs and paste your monthly MTD and YTD Actual, Target, and PY values.
- Open the KPI Scorecard page and choose your reporting month, then toggle MTD or YTD.
- Adjust the RAG Threshold Table if you want different Red/Amber/Green cut-offs.
- Use the KPI Trend page to drill into any single KPI’s charts before your monthly review.
💼 Real-World Use Cases
Ravi manages a run-of-river hydropower station. Each month he pastes readings into the 10 KPI tabs, then reviews the scorecard to spot that Forced Outage Rate turned amber before his operations meeting — without exporting anything from the plant’s monitoring system.
Meera is a renewable energy analyst at a consultancy. She copies the scorecard once per client, updates Revenue per MWh and Cost of Production per MWh, and shares a live link so the client sees YTD-vs-PY trends without buying a BI seat.
A reliability engineer uses the KPI Trend page to compare MTBF Target vs Actual across all 12 months and justify a preventive-maintenance schedule change.
❓ Frequently Asked Questions
What KPIs does the Hydropower KPI Scorecard in Google Sheets track?
The Hydropower KPI Scorecard in Google Sheets tracks 10 KPIs: Plant Load Factor, Turbine Efficiency, Availability Factor, Forced Outage Rate, Water Usage Efficiency, Greenhouse Gas Emissions, Maintenance Cost per MWh, Revenue per MWh, Cost of Production per MWh, and Mean Time Between Failures. Each updates automatically after you enter monthly data.
How long does setup take?
Setup takes under 10 minutes. Copy the sheet to your Google Drive, paste your monthly Actual, Target, and PY values into the 10 KPI data tabs, and the scorecard, arrows, sparklines, and trend charts populate on their own.
Can I change the Red-Amber-Green rules?
Yes. The Hydropower KPI Scorecard in Google Sheets includes a RAG Threshold Table with separate rules for Upper-the-Better and Lower-the-Better KPIs. Edit the percentage cut-offs there and every status dot on the scorecard follows the new logic.
Does it compare against last year?
Yes. Every card shows the prior-year (PY) value, the absolute change, and the percentage change with a direction arrow, and the KPI Trend page includes Actual vs PY charts for both MTD and YTD.
How does this compare to Power BI or Tableau?
The Hydropower KPI Scorecard in Google Sheets is a one-time $8.99 purchase with no per-user fees, while Power BI Pro and Tableau charge monthly per seat. For manual monthly KPI reporting it delivers the same scorecard and trend views without licensing or setup overhead.
Do I need to install anything?
No. It runs entirely in Google Sheets in any browser, with no add-ons or macros. You can share it by link and open it on desktop or the Google Sheets mobile app.
👤 About the Author
Built by PK — Microsoft Certified Professional with 15+ years of Excel, Google Sheets, and Power BI experience. Founder of NextGenTemplates, reaching 300K+ subscribers across YouTube channels (@PK-AnExcelExpert, @NextGenTemplates, @NeoTechNavigators). Every template is hand-built and tested before release.
🔗 Explore Related Templates
Pair this with the Solar Energy KPI Scorecard in Google Sheets and the Petroleum Industry KPI Scorecard in Google Sheets to cover your whole energy portfolio. For environmental reporting, add the Carbon Footprint KPI Dashboard in Google Sheets. Browse more Google Sheets Dashboards or the full KPI Scorecard collection.
📖 Click here to read the Detailed Blog Post
🎥 Visit our YouTube channel for step-by-step video tutorials
👉 YouTube.com/@NextGenTemplates
Watch the step-by-step video Demo:
📅 Last updated: August 2026




























Reviews
There are no reviews yet.