



In the renewable energy world, hydropower is a cornerstone of sustainability — but tracking its performance can be a real challenge. That’s where the Hydropower KPI Dashboard in Power BI steps in. This dynamic, interactive dashboard is tailor-made for energy analysts, power plant managers, and operations teams who want to make data-driven decisions fast.
From equipment uptime to power generation, this dashboard gives you real-time, drillable insights across all critical KPIs — helping you improve efficiency, reduce downtime, and hit your targets with confidence.
✨ Key Features of Hydropower KPI Dashboard in Power BI
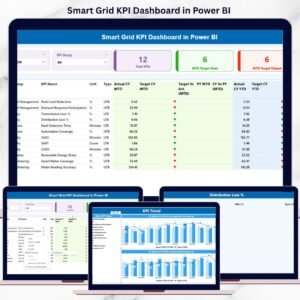
📊 Summary Dashboard

Your one-stop snapshot for all KPIs. Filter by Month or KPI Group, then explore:
✅ Total KPIs Count
🎯 MTD Target Met vs Missed
📋 Visual KPI table with trends, variances & red/green indicators
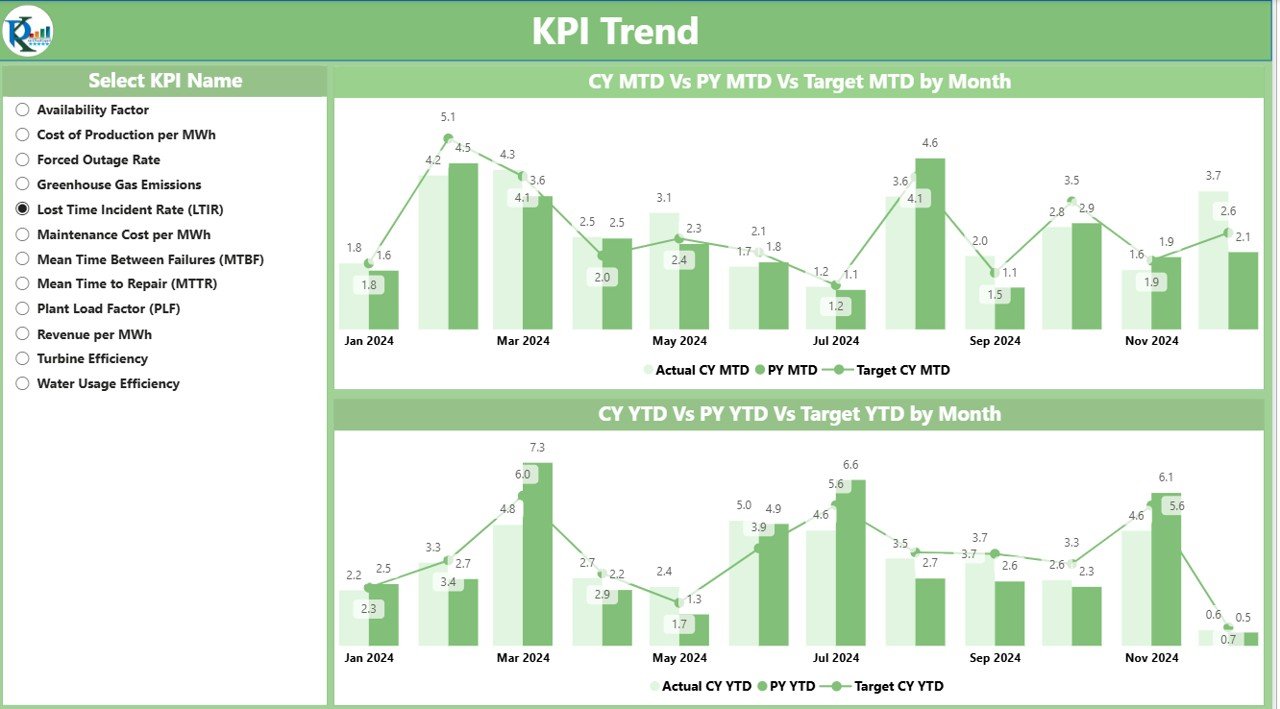
📈 KPI Trend Page
Track your performance like a pro. See MTD and YTD Trends across:
Current Year vs Target
Current Year vs Previous Year
Combo charts for side-by-side comparison
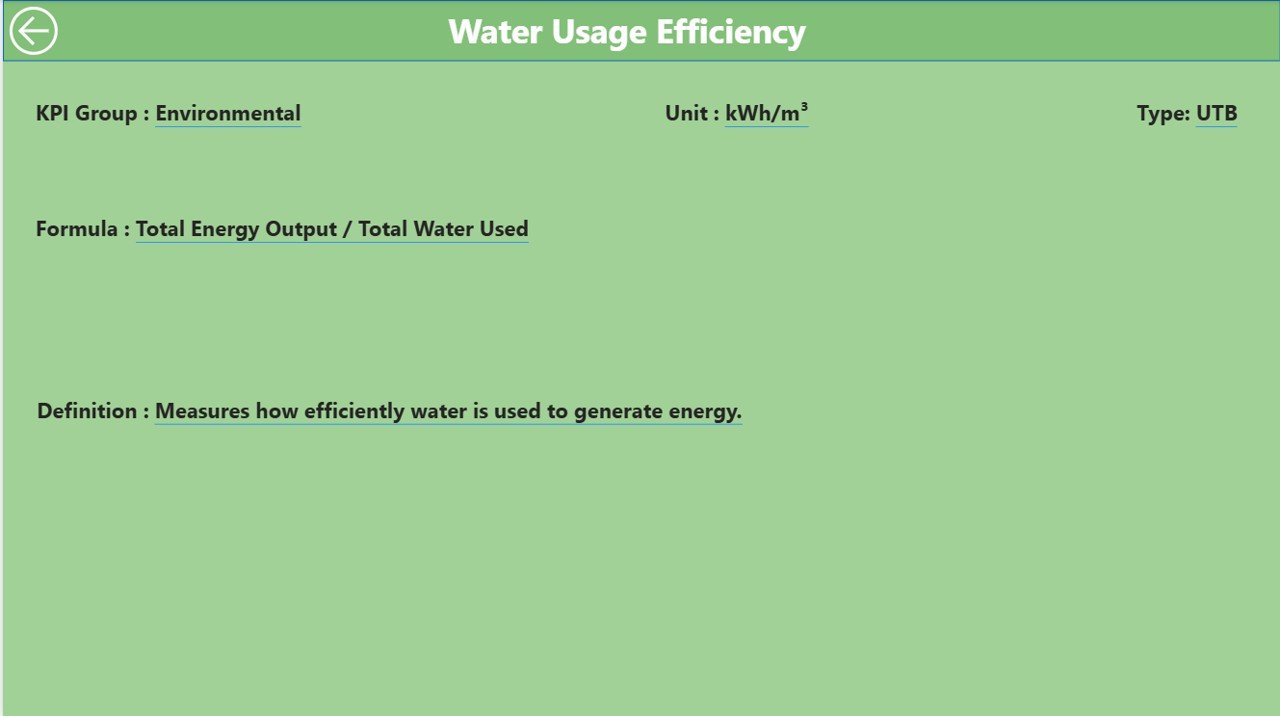
🔍 KPI Definition Page
Drill down into KPI logic! View the formula, unit, and definition of any KPI with a click. Then return instantly using the built-in Back Button.
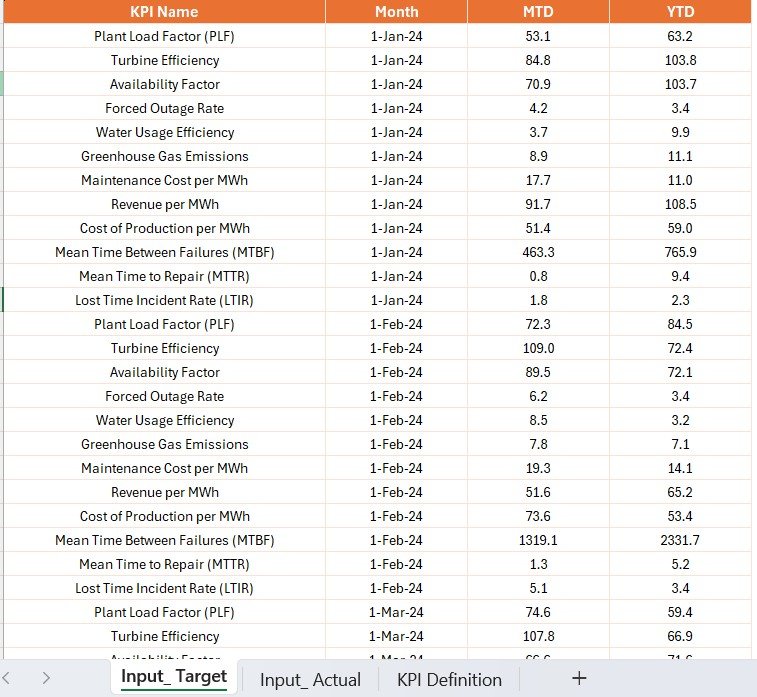
⚡ Excel-Powered Data Source
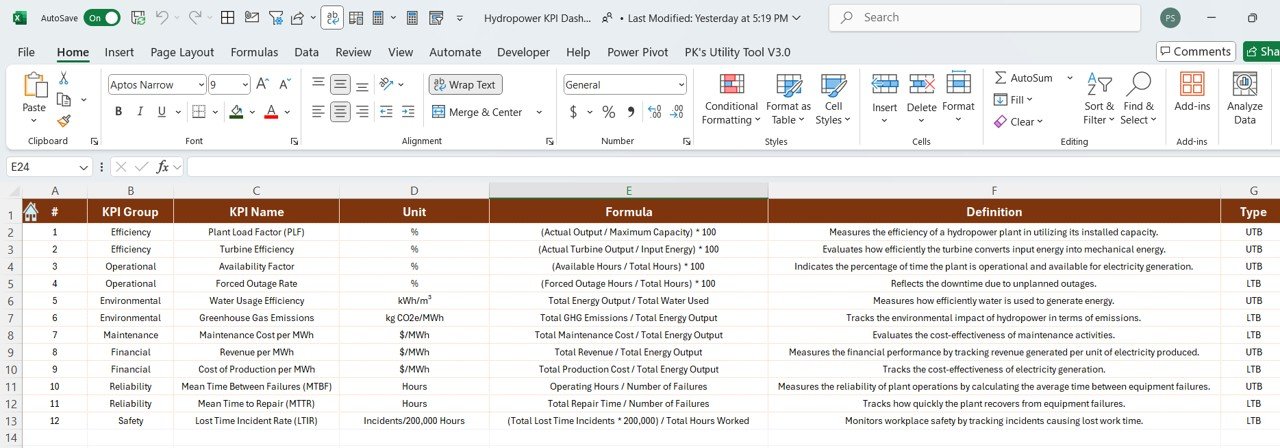
All KPI values and targets are pulled from a structured Excel file with three tabs:
Actual Input – MTD and YTD values
Target Input – Performance benchmarks
KPI Definitions – Metadata, grouping, formulas, and KPI types
📦 What’s Inside the Hydropower KPI Dashboard?
Power BI File (.pbix) – Fully interactive, no setup required
Excel Data Source (.xlsx) – Includes Actual, Target, and KPI Definition sheets
Pre-Built Pages:
✅ Summary Page
📈 KPI Trend Page
🔍 Drill-through Definition Page
Visual Cues:
▲ ▼ icons, red/green colors, performance variance in %
Everything is built with clarity and usability in mind — even for non-tech users.
🛠 How to Use the Hydropower KPI Dashboard
Prepare Your Excel Data
Fill in your actuals, targets, and definitions in the provided template.Open Power BI File
Refresh the file to pull the latest metrics into the dashboard.Start Exploring!
Use slicers to filter by KPI group or month, track trends, and review target achievements.Drill Down for More Info
Click any KPI row to view formula, type, and details on the KPI Definition page.Repeat Monthly
Update your Excel source regularly to keep your reports fresh and accurate.
👥 Who Can Benefit from This Dashboard?
✅ Power Plant Managers – Stay on top of generation goals and operational health
✅ Energy Analysts – Monitor performance, uncover inefficiencies, and report with clarity
✅ Operations Teams – Drill into trends and benchmark progress monthly
✅ Renewable Energy Consultants – Deliver better client insights with real-time visuals
✅ Sustainability Leads – Track environmental impact metrics efficiently
If your job involves hydropower or energy reporting, this dashboard is your secret weapon!






Reviews
There are no reviews yet.