



The Food Supply Chain KPI Dashboard in Excel is an essential tool for businesses in the food industry looking to streamline their supply chain operations. Whether you’re managing a farm, warehouse, distribution center, or a retail business, this Excel-based dashboard allows you to track and manage key performance indicators (KPIs) related to your food supply chain, ensuring efficiency and minimizing disruptions.
From inventory management and demand forecasting to transportation and order fulfillment, this dashboard provides real-time insights into every stage of the food supply chain. It helps you monitor vital metrics such as order cycle time, inventory turnover, on-time delivery, and product quality, ensuring that you maintain a smooth and reliable operation.
With the Food Supply Chain KPI Dashboard, you can easily identify bottlenecks, track supplier performance, and make data-driven decisions that improve operational efficiency, customer satisfaction, and profitability.
Key Features of the Food Supply Chain KPI Dashboard in Excel
📦 Inventory Management Tracking
Monitor inventory levels, track stock movements, and ensure timely replenishment. Keep an eye on stockouts, excess inventory, and order fulfillment to maintain optimal stock levels.
🚚 Transportation & Delivery Monitoring
Track key logistics metrics such as on-time delivery, transportation costs, and carrier performance. Ensure that products reach their destinations on time and in good condition.
📊 Order Fulfillment & Lead Time Analysis
Analyze the order cycle time and lead time from order placement to delivery. This helps optimize the order fulfillment process, reduce delays, and improve customer satisfaction.
📈 Supplier & Vendor Performance Tracking
Evaluate supplier performance by tracking metrics such as delivery accuracy, quality of goods, and lead times. Make informed decisions when selecting and managing suppliers.
💡 Demand Forecasting & Planning
Utilize historical data to predict future demand, ensuring that the supply chain is prepared for fluctuations in demand. This helps avoid overstocking or understocking issues.
📉 Performance Dashboard & Reporting
Visualize supply chain performance with dynamic charts and graphs. Track KPIs over various time periods and generate reports to evaluate the efficiency of your supply chain operations.
Why You’ll Love the Food Supply Chain KPI Dashboard in Excel

✅ Comprehensive Supply Chain Monitoring
Track key metrics like inventory turnover, order fulfillment, and transportation efficiency all in one place. Ensure smooth operations by having a clear view of every aspect of your food supply chain.
✅ Improve Operational Efficiency
Identify bottlenecks and inefficiencies in your supply chain. Use data to optimize inventory, transportation, and supplier performance, ultimately improving overall efficiency.
✅ Enhance Customer Satisfaction
Monitor order fulfillment times and ensure on-time deliveries, keeping your customers satisfied with timely deliveries and high-quality products.
✅ Make Informed Decisions
Leverage data insights to make informed decisions on inventory management, demand forecasting, supplier selection, and cost optimization.
✅ Customizable for Your Needs
Easily adapt the dashboard to reflect your business needs. Customize KPIs, add data sources, and tailor the dashboard to suit the specific requirements of your food supply chain.
What’s Inside the Food Supply Chain KPI Dashboard in Excel?
Inventory Management Tracking: Keep track of stock levels, replenishment, and inventory turnover.
Transportation & Delivery Monitoring: Track transportation metrics and ensure on-time deliveries.
Order Fulfillment & Lead Time Analysis: Analyze order cycle time and lead times.
Supplier Performance Tracking: Monitor supplier performance and quality of goods.
Demand Forecasting & Planning: Predict future demand based on historical data.
Performance Reporting: Visualize KPIs with charts and graphs for easy analysis.
How to Use the Food Supply Chain KPI Dashboard in Excel
1️⃣ Download the Template: Access the Food Supply Chain KPI Dashboard in Excel instantly.
2️⃣ Enter Your Supply Chain Data: Input data such as inventory levels, order details, and supplier performance.
3️⃣ Monitor KPIs & Performance: Track key metrics such as inventory turnover, on-time delivery, and supplier performance.
4️⃣ Analyze Trends & Patterns: Use time-based analysis to identify trends and areas for improvement in your supply chain.
5️⃣ Optimize Your Supply Chain: Use the insights to make data-driven decisions that improve efficiency, reduce costs, and enhance customer satisfaction.
Who Can Benefit from the Food Supply Chain KPI Dashboard in Excel?
🔹 Food Manufacturers & Processors
🔹 Retailers & Distributors
🔹 Warehouse & Inventory Managers
🔹 Supply Chain & Logistics Managers
🔹 Procurement & Sourcing Teams
🔹 Business Owners & Operations Managers
🔹 Enterprises in the Food Industry
Ensure efficient management of your food supply chain with the Food Supply Chain KPI Dashboard in Excel. Optimize your processes, reduce costs, and improve customer satisfaction—all with the power of data.
Click here to read the Detailed blog post
Visit our YouTube channel to learn step-by-step video tutorials
Youtube.com/@PKAnExcelExpert
Compatibility and Requirements
- Works in Microsoft Excel desktop (Excel 2016 or later, or Microsoft 365).
- The dashboard uses charts to show your supply chain KPIs. Microsoft explains how to build them in Create a chart from start to finish.
Frequently Asked Questions
What can I track with this dashboard?
It covers inventory levels and turnover, transportation and on-time delivery, order cycle time and lead time, supplier performance, and demand forecasting.
Can I use it for suppliers and vendors?
Yes. It tracks supplier performance through delivery accuracy, quality of goods and lead times, so you can compare vendors.
Can I change the KPIs?
Yes. You can customize the KPIs, add data sources and adapt the dashboard to your own food supply chain.
Does it show trends over time?
Yes. It uses charts and graphs and a time-based analysis, so you can follow your KPIs over different periods.
Is there a Google Sheets or Power BI version?
Yes. See the Food Supply Chain KPI Dashboard in Google Sheets and the Food Supply Chain KPI Dashboard in Power BI.
Related Supply Chain Templates
- Food Supply Chain KPI Dashboard in Power BI: the same dashboard in Power BI
- Food Supply Chain KPI Dashboard in Google Sheets: the Google Sheets edition
- Food Supply Chain KPI Scorecard in Excel: a scorecard view of the same metrics
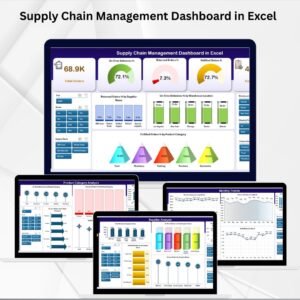
- Supply Chain Management Dashboard in Excel: a general supply chain dashboard
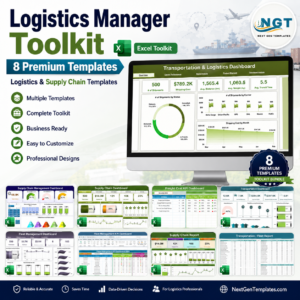
- Logistics Manager Toolkit: 8 logistics templates in one download
Browse all Excel KPI dashboards.































Reviews
There are no reviews yet.