


In today’s competitive manufacturing world, automotive companies deal with massive volumes of data every day. From production quantity and material usage to costs, defects, and revenue—everything needs to be tracked accurately. However, when this data is scattered across multiple spreadsheets, it becomes difficult to gain clear insights.
So, how can you simplify this complexity and make faster, smarter decisions?
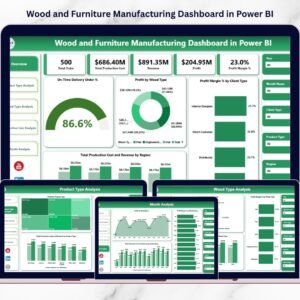
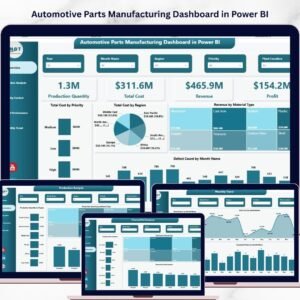
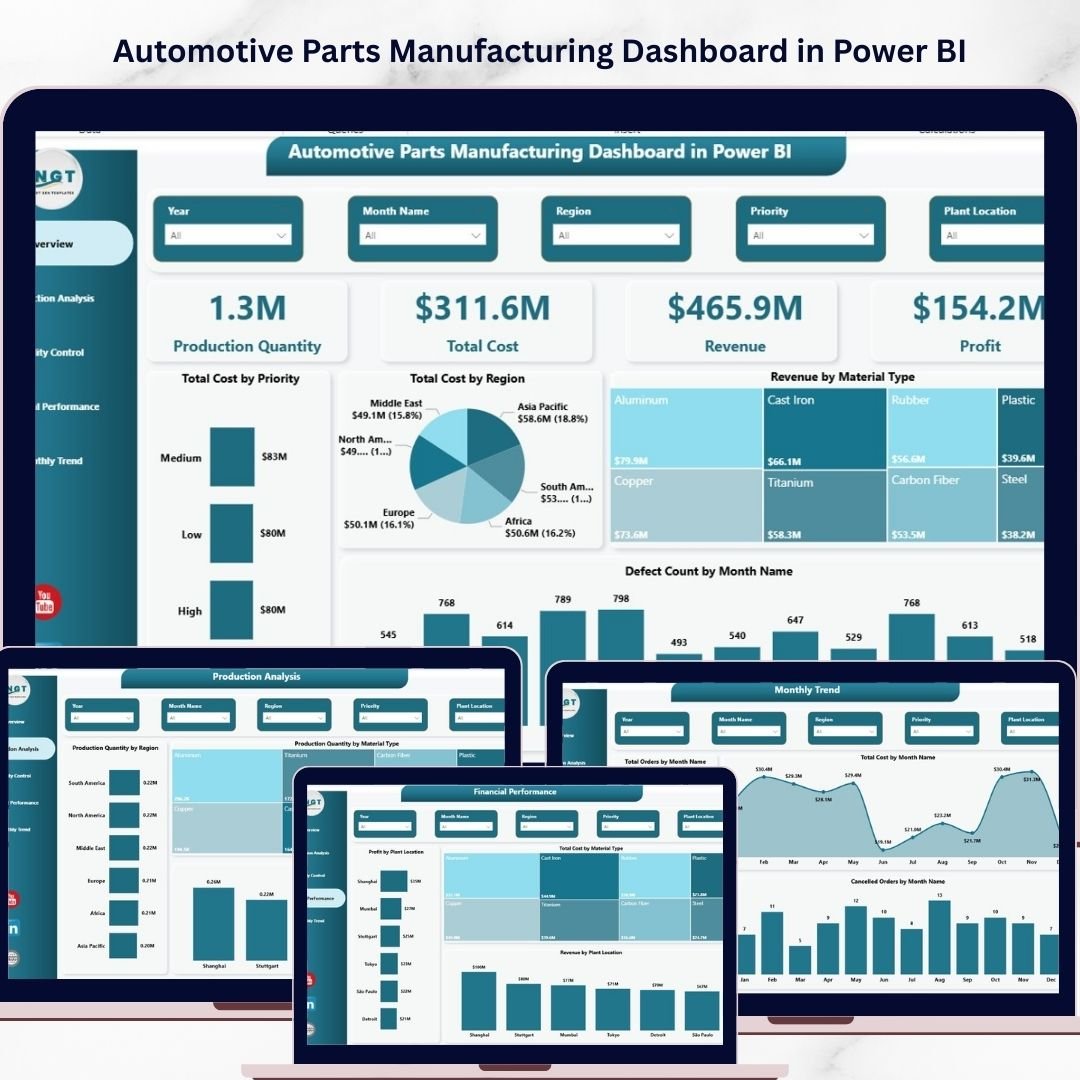
The answer is the Automotive Parts Manufacturing Dashboard in Power BI.
This powerful, ready-to-use dashboard transforms your raw manufacturing data into meaningful insights using interactive visuals, KPI cards, and trend analysis. As a result, you can monitor performance, identify issues, and improve profitability—all in one place.
📊 Key Features of Automotive Parts Manufacturing Dashboard in Power BI
✨ 5 Interactive Dashboard Pages – Get a complete 360° view of your manufacturing performance
📈 KPI Cards for Quick Insights – Track Production Quantity, Total Cost, Revenue, and Profit instantly
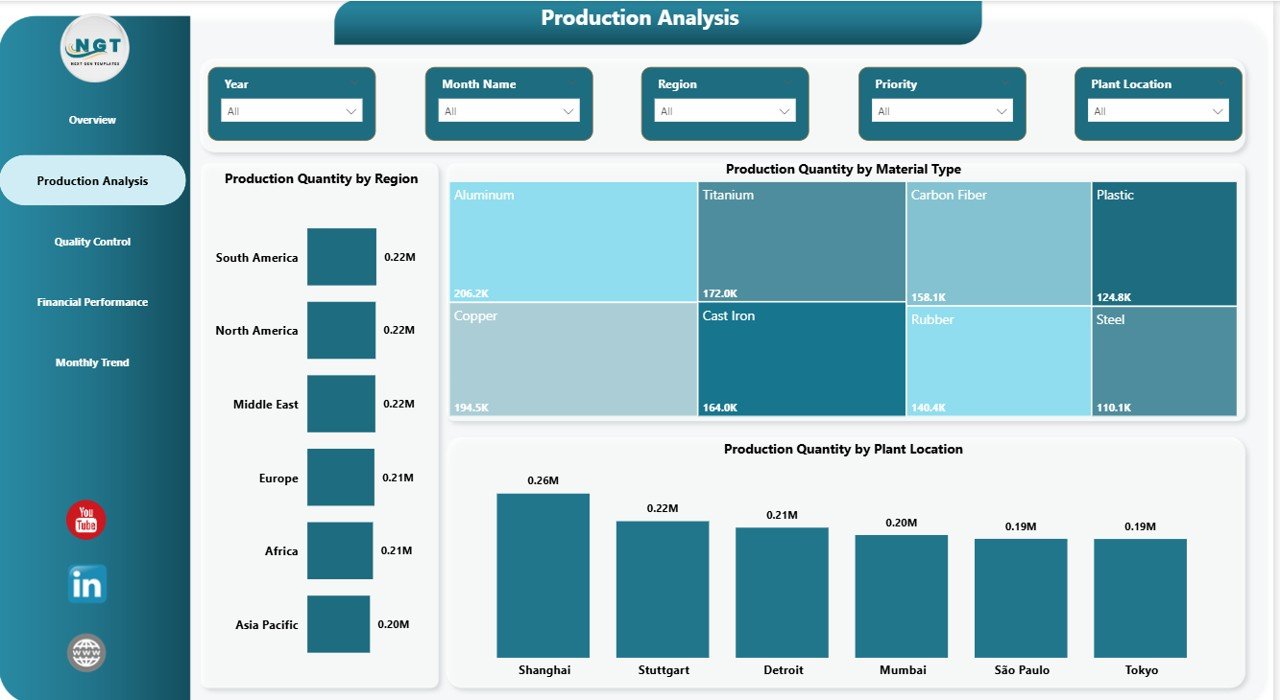
🌍 Regional & Plant Analysis – Understand performance by location and optimize operations
⚙️ Production Performance Tracking – Analyze production by material type, region, and plant
🚨 Quality Control Monitoring – Identify defects, delayed orders, and problem areas
💰 Financial Performance Analysis – Track profit, cost drivers, and revenue streams
📅 Monthly Trend Analysis – Monitor orders, costs, and cancellations over time
🎯 Interactive Filters (Slicers) – Drill down into data easily without technical skills

📦 What’s Inside the Automotive Parts Manufacturing Dashboard in Power BI
📁 Power BI Dashboard File (.pbix) – Fully designed and ready to use
📊 5 Structured Pages – Overview, Production Analysis, Quality Control, Financial Performance, Monthly Trend
📌 Pre-built Visuals & Charts – No need to create anything from scratch
🔍 Dynamic Filters & Drill-down Features – Explore your data in detail
📑 Well-Organized Layout – Easy navigation and user-friendly design
⚡ How to Use the Automotive Parts Manufacturing Dashboard in Power BI
1️⃣ Import your manufacturing data into Power BI
2️⃣ Connect your tables with the dashboard model
3️⃣ Use slicers to filter data by region, plant, or material
4️⃣ Analyze KPIs like production, cost, revenue, and defects
5️⃣ Identify trends and performance gaps
6️⃣ Take data-driven actions to improve efficiency and profitability
Even if you are a beginner, you can easily use this dashboard thanks to its intuitive design and simple visuals.
👥 Who Can Benefit from This Automotive Parts Manufacturing Dashboard in Power BI
👨🏭 Production Managers – Monitor production efficiency and optimize plant performance
👨💼 Business Owners – Track profitability and make strategic decisions
📊 Data Analysts – Analyze trends and generate powerful reports quickly
🛠️ Quality Teams – Identify defects and improve product quality
🏭 Manufacturing Companies – Centralize data and improve operational efficiency
This dashboard is not just a reporting tool—it is a complete decision-making system. It helps you reduce inefficiencies, improve quality, and boost profitability with real-time insights.
If you want to stay ahead in the automotive manufacturing industry, this dashboard is a must-have solution.
Click here to read the Detailed blog post
Watch the step-by-step video tutorial: