


Fleet-as-a-Service (Faas) models demand complete visibility into cost, revenue, contracts, fuel usage, and service quality. Unlike traditional fleet management, success here depends on how efficiently trips are delivered, contracts perform, and margins are protected. However, when fleet data lives across scattered spreadsheets, decision-making becomes slow and risk prone.
The Fleet-as-a-Service Dashboard in Excel solves this challenge by transforming raw fleet and mobility data into clear, visual, and actionable insights. Fleet-as-a-Service Dashboard in Excel This ready-to-use Excel dashboard allows fleet managers, mobility providers, finance teams, and leadership to monitor trips, costs, contracts, service packages, and trends from a single interactive file.
Built entirely in Excel using structured data tables, Pivot Tables, slicers, and charts, this dashboard offers powerful analytics without complex BI tools. As a result, organizations gain control, transparency, and confidence in fleet profitability and operations.
🚀 Key Features of the Fleet-as-a-Service Dashboard in Excel
🚗 Centralized Fleet Performance Monitoring – Track cost, revenue, and profit in one dashboard
💰 Cost & Profit Visibility – Monitor trip cost, fuel cost, tolls, and margins instantly
📄 Contract Performance Analysis – Evaluate active, on-hold, and profitable contracts
📦 Service Package Insights – Understand which service packages drive profit
⛽ Fuel & Energy Analysis – Compare fuel types by cost, profit, and driver rating
📅 Monthly Trend Analysis – Identify seasonality and performance shifts
🎯 Interactive Slicers & Pivot Analytics – Filter insights dynamically
🧭 Built-in Page Navigator – One-click movement across dashboard pages
📦 What’s Inside the Fleet-as-a-Service Dashboard
This Excel dashboard includes five structured analytical pages, supported by backend data sheets for smooth performance analysis.
🟢 Overview Page
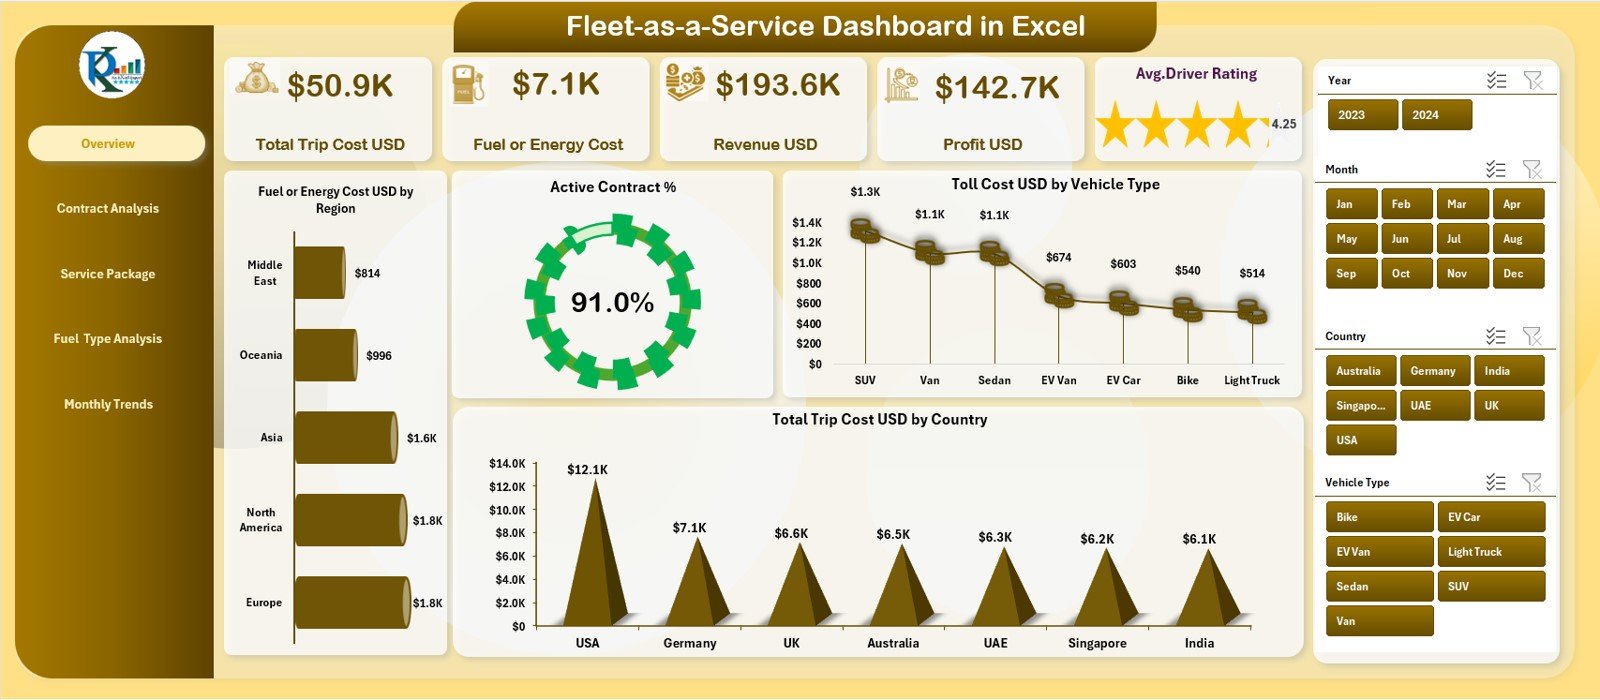
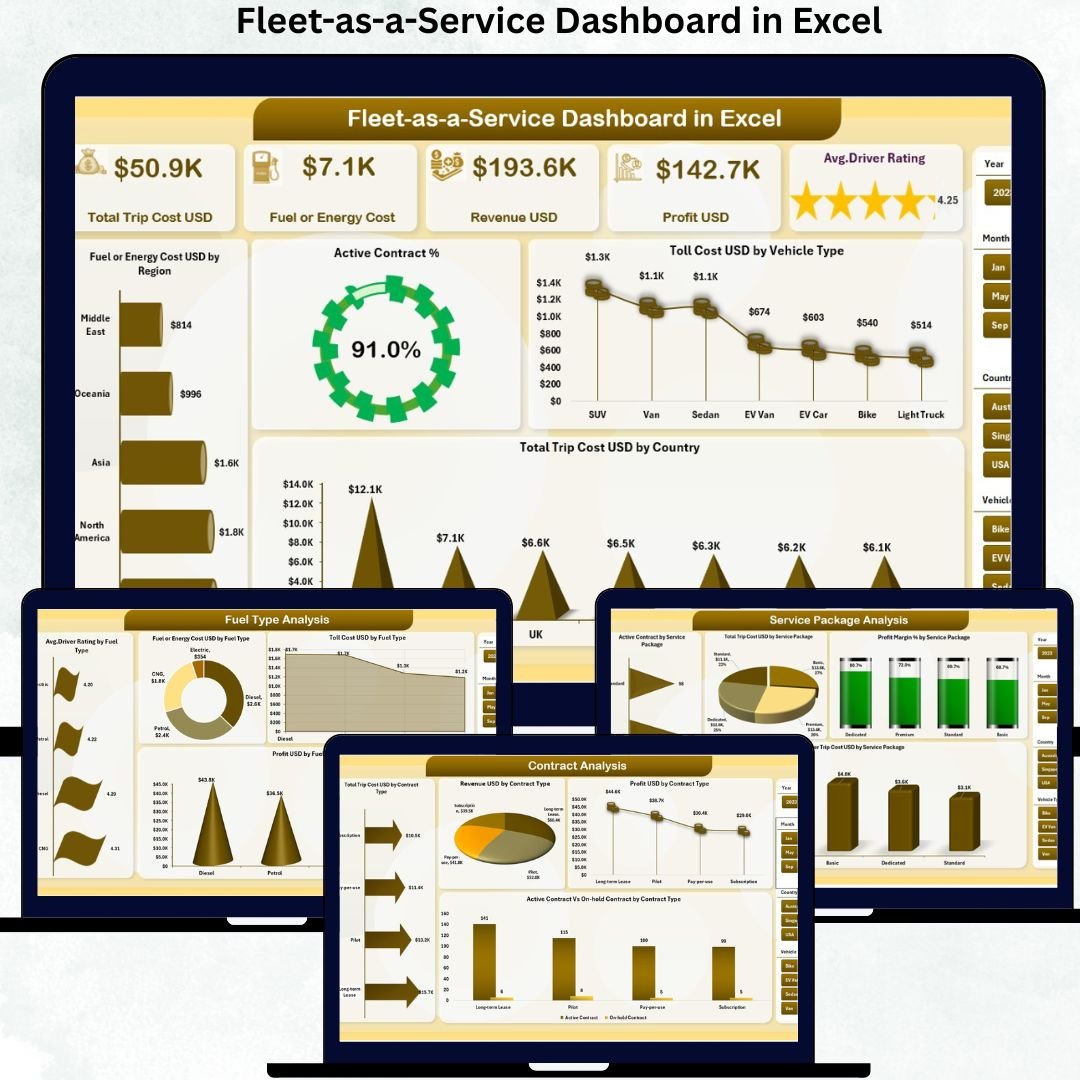
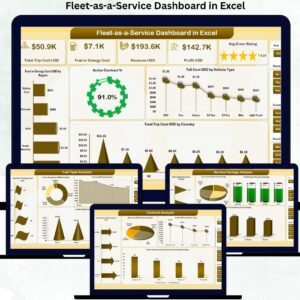
The main snapshot of fleet health. It displays KPI cards for Total Trip Cost, Fuel/Energy Cost, Revenue, Profit, and Average Driver Rating. Visuals highlight fuel costs by region, active contract percentage, toll cost by vehicle type, and trip cost by country.
📄 Contract Analysis Page
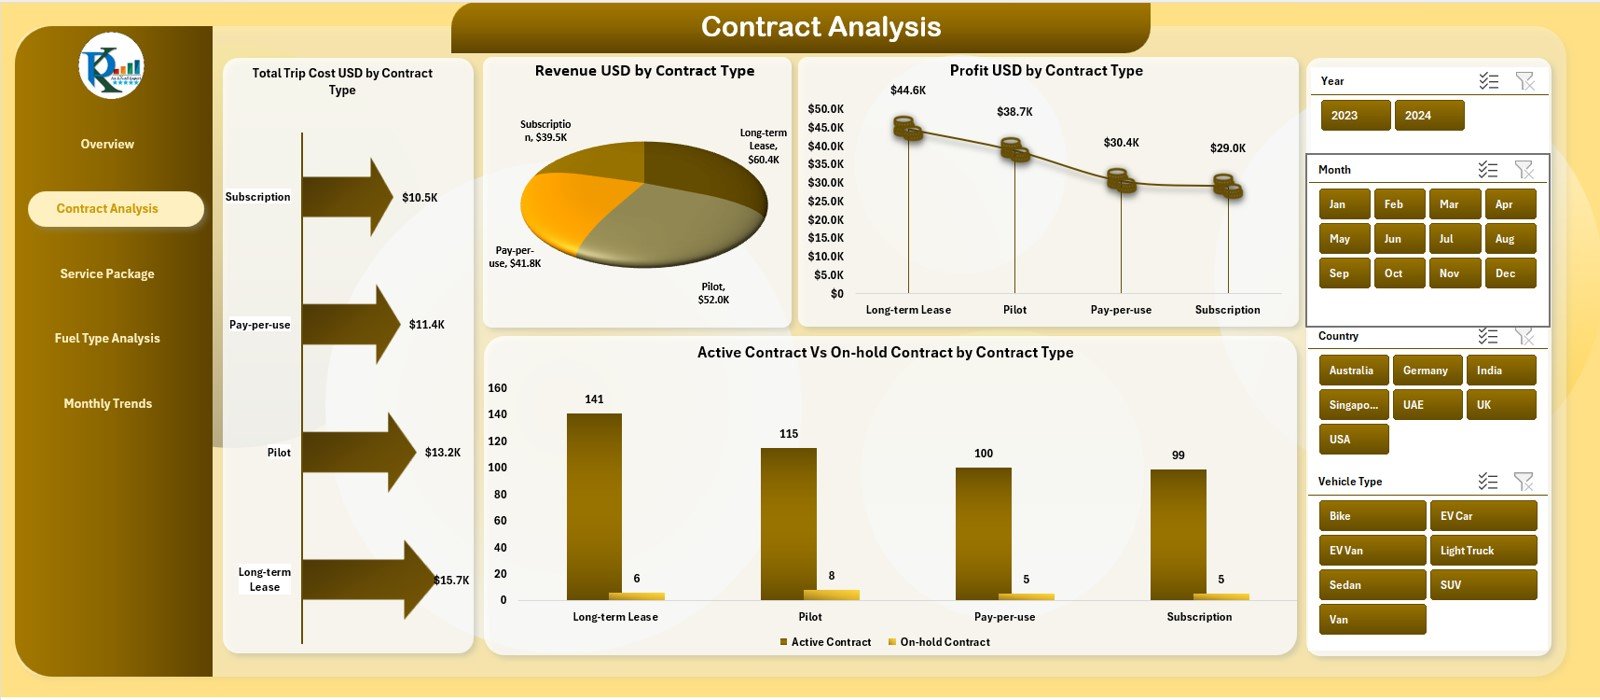
Focuses on contract-level performance. Charts show Total Trip Cost, Revenue, Profit, and Active vs On-Hold Contracts by contract type—helping optimize contract strategies.
📦 Service Package Analysis Page
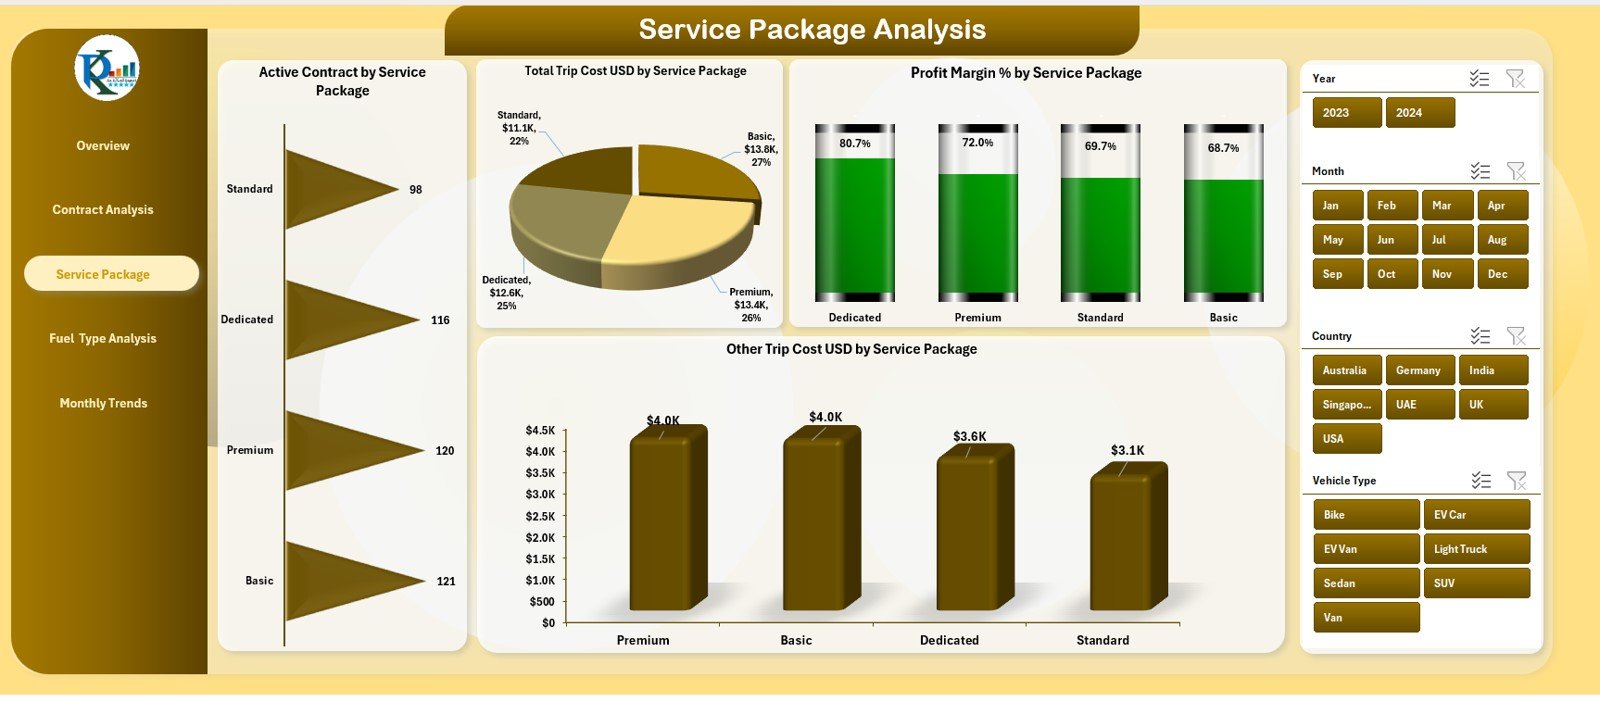
Analyzes fleet performance across service offerings. It includes charts for Active Contracts, Trip Cost, Profit Margin %, and Other Costs by service package—highlighting profitable and cost-heavy services.
⛽ Fuel Type Analysis Page
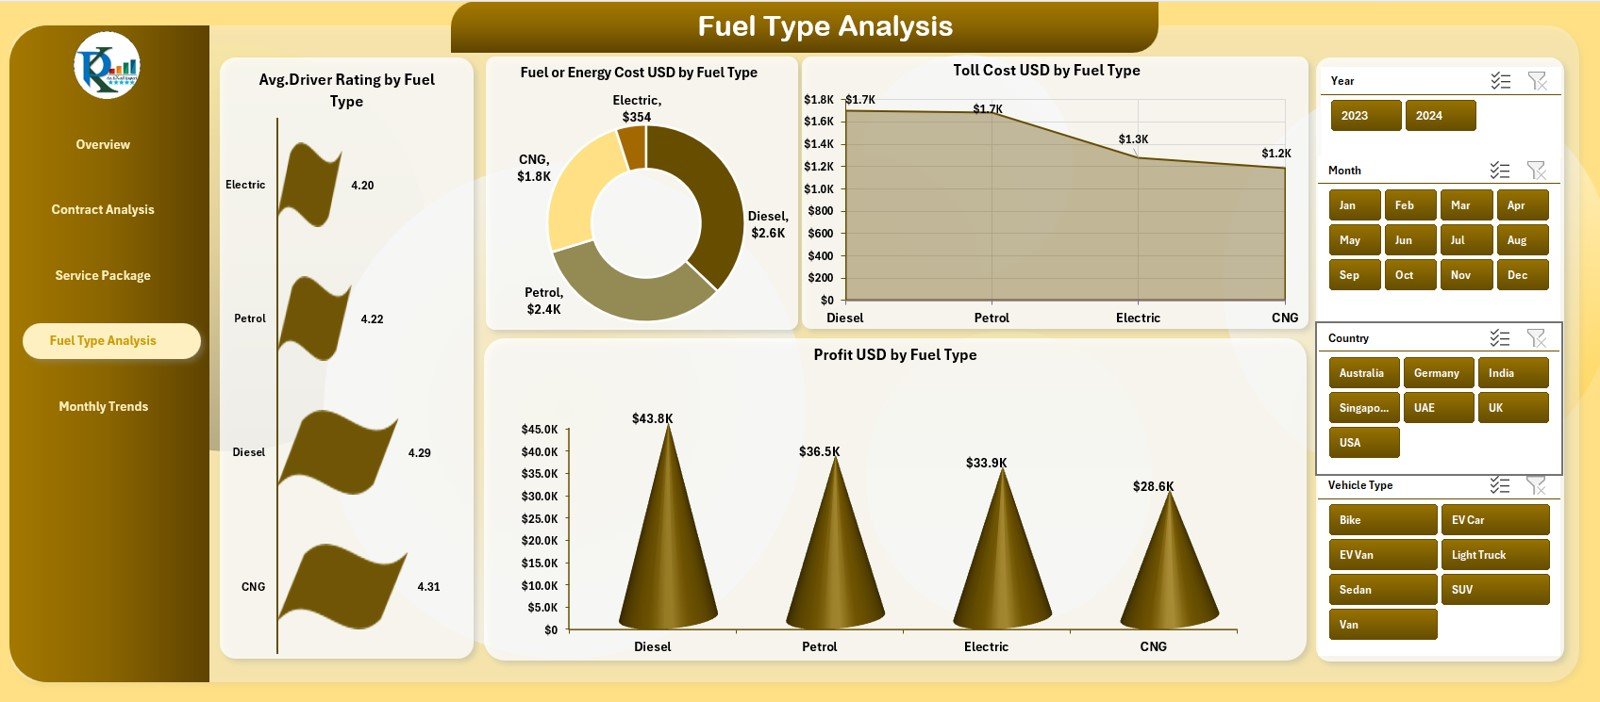
Evaluates performance by fuel or energy type. Charts display Driver Ratings, Fuel/Energy Cost, Toll Cost, and Profit, supporting sustainability and fuel strategy decisions.
📆 Monthly Trends Page
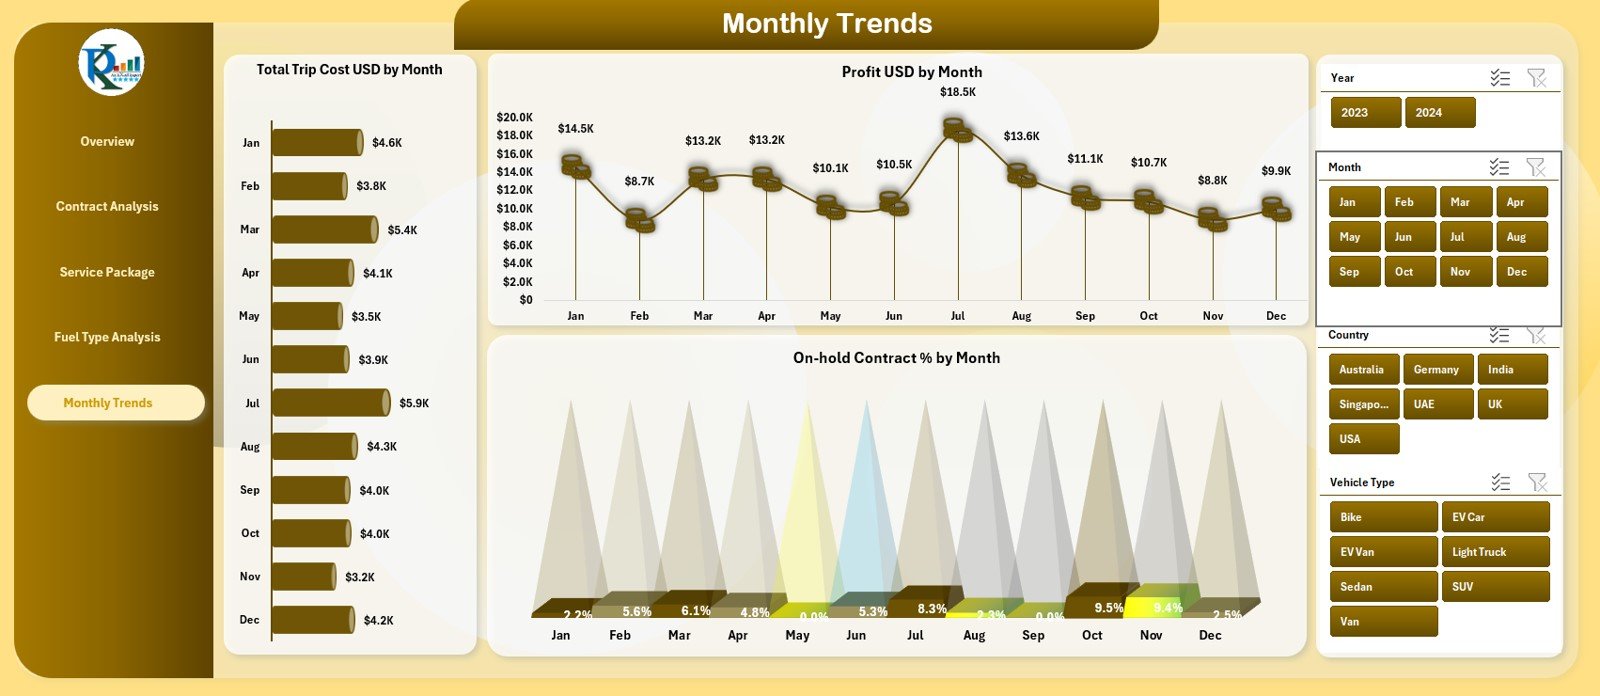
Tracks Trip Cost, Profit, and On-Hold Contract % month by month. This page supports forecasting, stability checks, and long-term planning.
All pages are powered by a structured Data Sheet that automatically updates visuals when data changes.
🛠️ How to Use the Fleet-as-a-Service Dashboard
✅ Step 1: Update fleet data in the Data Sheet
✅ Step 2: Refresh Pivot Tables if required
✅ Step 3: Use slicers to filter by region, fuel type, contract, or service package
✅ Step 4: Review KPIs, charts, and trends
✅ Step 5: Share insights with operations and leadership teams
No advanced Excel skills are required. The dashboard is plug-and-play and business-ready.
👥 Who Can Benefit from This Fleet Dashboard?
🚗 Fleet Managers
📦 Mobility & FaaS Providers
📊 Operations Managers
💼 Finance & Profitability Teams
📈 Strategy & Leadership Teams
Any organization operating under a Fleet-as-a-Service or mobility-driven model will gain immediate value from this dashboard.
🔗 Click here to read the Detailed blog post
🎥 Visit our YouTube channel to learn step-by-step video tutorials
Watch the step-by-step video tutorial:
Compatibility and Requirements
- Works in Microsoft Excel desktop (Excel 2016 or later, or Microsoft 365).
- The dashboard uses Pivot Tables and slicers to filter by region, fuel type, contract or service package. Microsoft explains slicers in Use slicers to filter data.
Frequently Asked Questions
Which pages does the dashboard include?
Five analysis pages: Overview, Contract Analysis, Service Package Analysis, Fuel Type Analysis and Monthly Trends. They are backed by a Data Sheet.
Which KPIs are on the Overview page?
KPI cards show Total Trip Cost, Fuel/Energy Cost, Revenue, Profit and Average Driver Rating. Charts show fuel costs by region, active contract percentage, toll cost by vehicle type and trip cost by country.
How do I update the dashboard with my data?
Enter your fleet data in the Data Sheet and refresh the Pivot Tables if needed. The charts and KPIs update from that data.
Can I filter the results?
Yes. Slicers let you filter by region, fuel type, contract or service package.
Do I need advanced Excel skills?
No. You update the Data Sheet, refresh, and use the slicers and the built-in page navigator to move between pages.
Related Fleet and Operations Templates
- Fleet Management Dashboard in Excel: a broader fleet performance view
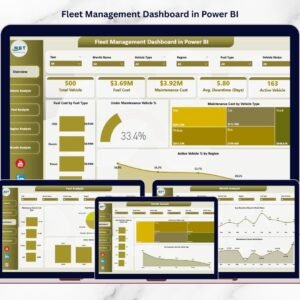
- Fleet Management Dashboard in Power BI: the fleet dashboard in Power BI
- Fleet Management KPI Dashboard in Excel: KPI tracking for fleet operations
- Fleet Utilization KPI Dashboard in Excel: a focus on how much each vehicle is used
- Transportation Services KPI Dashboard in Excel: KPIs for transport services
Browse all Excel dashboards and logistics templates.













Reviews
There are no reviews yet.