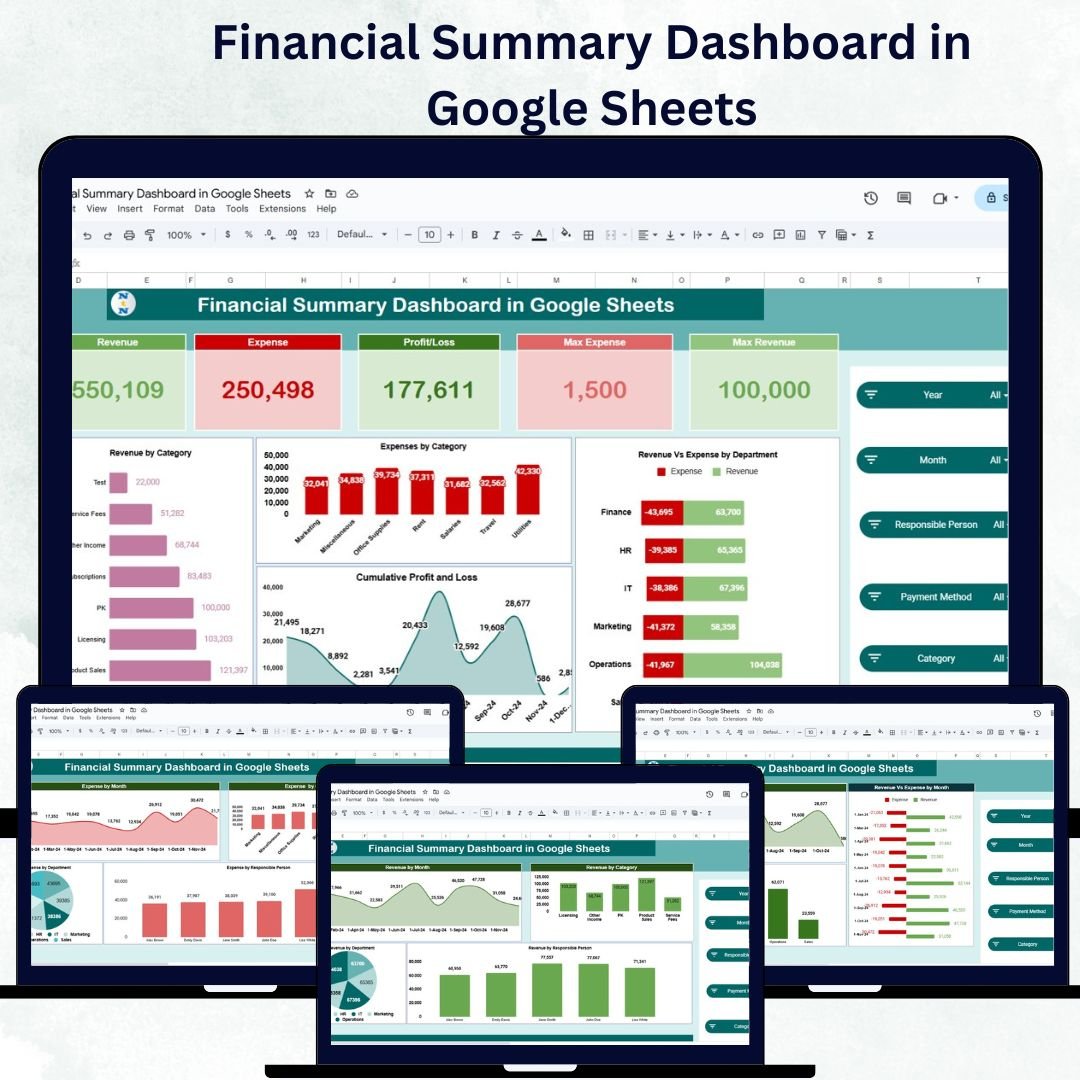


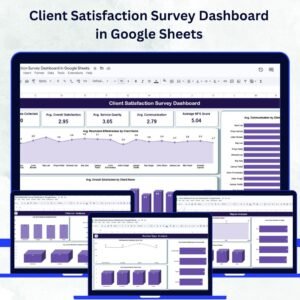
Managing finances effectively is the cornerstone of every successful business. The Financial Summary Dashboard in Google Sheets is a ready-to-use, professional-grade tool designed to help organizations track revenue, expenses, and profits in real time. This intuitive dashboard turns raw financial data into powerful visual insights, empowering decision-makers to improve profitability and financial transparency.
Built entirely in Google Sheets, this dashboard combines flexibility, accessibility, and collaboration—making it perfect for finance teams, business owners, and executives who want a clear view of their financial health at any moment. 🧾💼

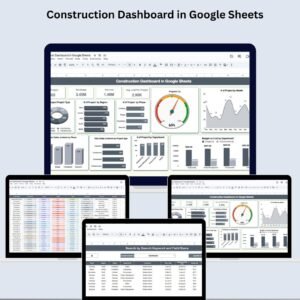
🔑 Key Features of the Financial Summary Dashboard in Google Sheets
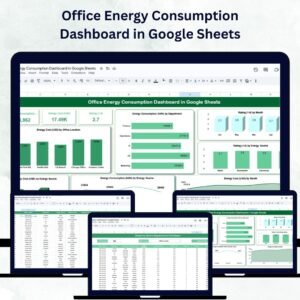
📊 Overview Sheet
Gain an instant snapshot of your financial performance with interactive charts and summary cards:
-
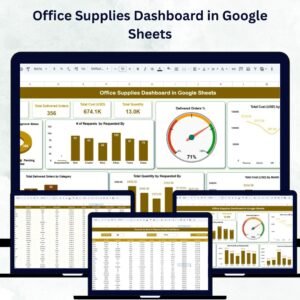
Cards Section:
-
💵 Revenue: Total income generated
-
💰 Expense: Total spending during the selected period
-
📈 Profit-Loss: Net profit or loss value
-
🏆 Max Revenue: Highest revenue recorded
-
⚠️ Max Expense: Highest cost identified
-
-
Charts Section:
-
Revenue by Category: Understand where your income comes from
-
Expenses by Category: Identify key spending areas
-
Revenue vs Expense by Department: Compare performance across teams
-
Cumulative Profit & Loss: Visualize overall growth and performance over time
-
This sheet acts as the main financial dashboard, combining all critical metrics in one place for real-time decision-making.
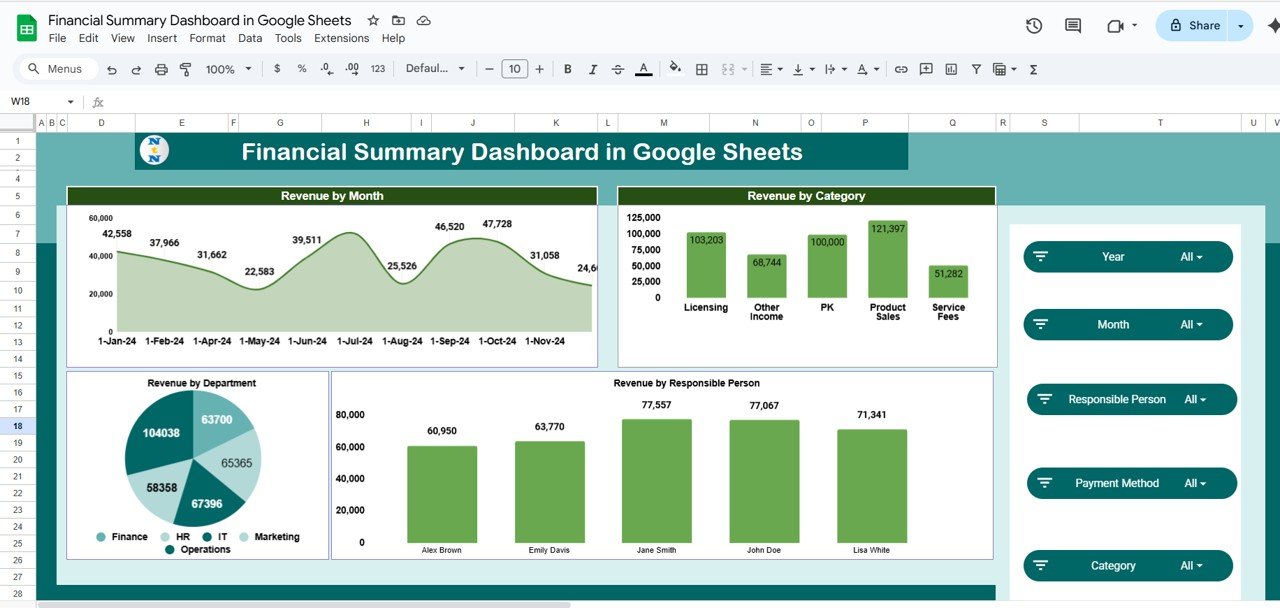
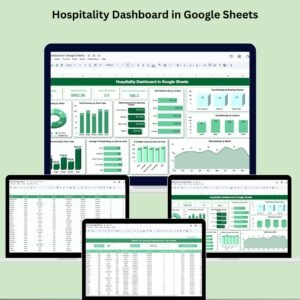
📈 Revenue Sheet
Dive deeper into your revenue analysis:
-
Revenue by Month: Track sales and revenue trends over the year
-
Revenue by Category: Identify best-performing products or services
-
Revenue by Responsible Person: Evaluate contributions by sales representatives
-
Revenue by Department: See which departments are driving financial growth
This sheet helps you understand which areas are fueling success—and where improvements can be made.
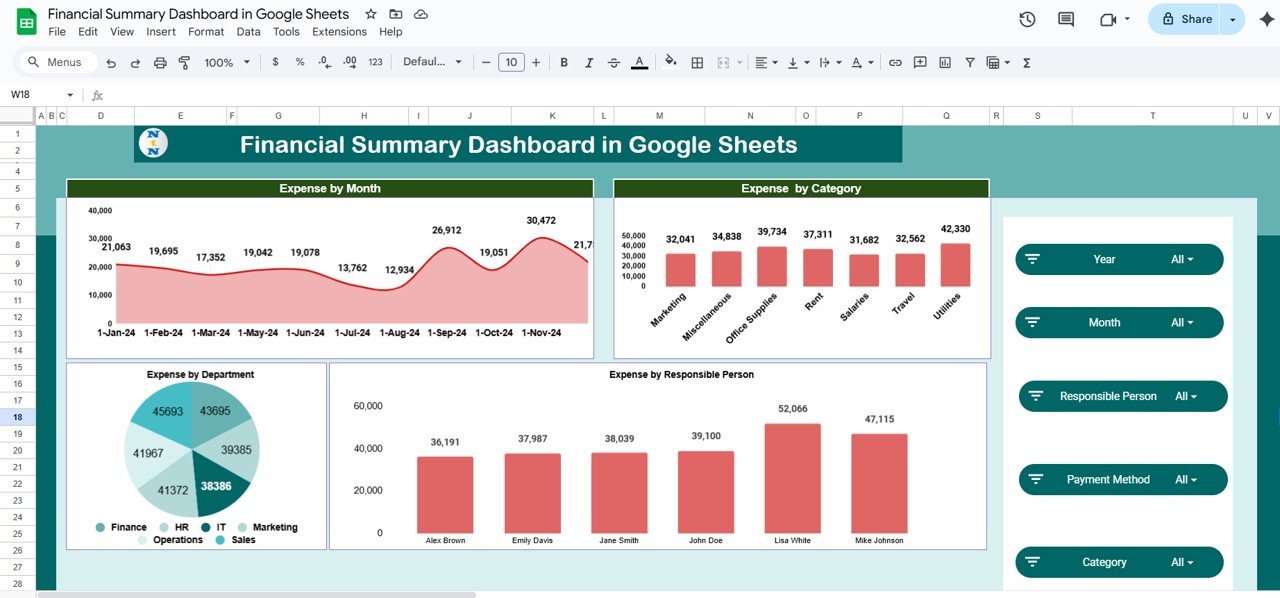
💸 Expense Sheet
Keep your spending in check:
-
Expense by Month: Monitor expenses over time and detect peaks
-
Expense by Category: Analyze cost breakdowns for better budgeting
-
Expense by Responsible Person: Evaluate cost accountability
-
Expense by Department: Identify which departments are overspending
This sheet gives you a clear financial picture, helping reduce waste and optimize budgets.
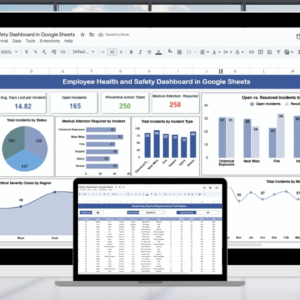
💹 Profit-Loss Sheet
Measure what truly matters—profitability:
-
Profit/Loss by Month: Evaluate monthly net performance
-
Revenue vs Expense by Month: Track correlation between earnings and costs
-
Profit/Loss by Department: Identify which teams are driving or draining profit
These insights allow for strategic cost-cutting and investment planning.
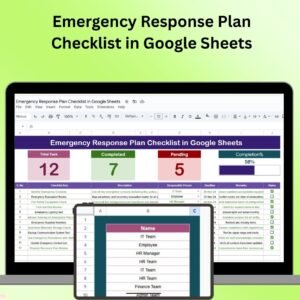
🧾 Data Sheet
The foundation of your dashboard—simply input your data and let automation do the rest:
-
Record Revenue, Expenses, Profit, Category, Department, Responsible Person, and Date
-
All charts and calculations update automatically
This ensures accuracy, consistency, and effortless data management.
💡 Advantages of Using the Financial Summary Dashboard
✅ Centralized Data View: Manage all key financial metrics in one structured file
📊 Real-Time Insights: Instantly visualize trends as you enter data
💼 Budget Optimization: Identify cost-saving opportunities across departments
📈 Departmental Comparison: Evaluate which teams are most efficient or profitable
🧠 Data-Driven Decisions: Improve financial planning with clear visual insights
🕒 Time Efficiency: Eliminate manual reporting with automated summaries
⚙️ Customizable: Add or modify categories to suit your organization’s needs
Whether you’re a CFO, finance analyst, or small business owner, this dashboard gives you complete financial control—without needing complex accounting software.
🧠 Best Practices for Using the Dashboard
-
Update Data Regularly: Keep inputs current for accurate reporting
-
Segment Your Data: Use categories and departments for better insights
-
Set Monthly Targets: Compare actuals with goals to track performance
-
Use Conditional Formatting: Highlight variances automatically
-
Collaborate with Teams: Share the dashboard with department heads for transparency
-
Review Trends Frequently: Identify long-term growth or decline patterns
🧾 How This Dashboard Helps Organizations
-
Monitors Financial Health: Consolidates revenue, expense, and profit metrics
-
Improves Accountability: Tracks departmental and individual contributions
-
Supports Forecasting: Use trends to predict future profits and losses
-
Saves Time: Reduces manual effort in creating reports
-
Empowers Decision-Makers: Delivers data visualization for better financial decisions
The Financial Summary Dashboard in Google Sheets transforms complex data into actionable insights. From daily expense tracking to quarterly profit reviews, it’s your all-in-one finance management tool for clarity, control, and confidence. 💰📈


Reviews
There are no reviews yet.