


In today’s digital age, fans are more than just an audience—they are the heartbeat of success for sports teams, entertainment brands, creators, and influencers. Keeping them engaged, measuring their loyalty, and tracking how they interact with your brand is essential for growth.
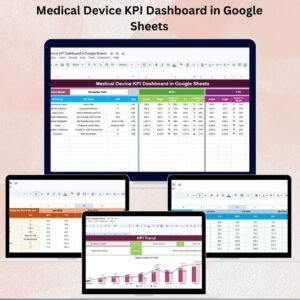
That’s where the 🎯 Fan Engagement KPI Dashboard in Google Sheets comes in — a ready-to-use, fully interactive, and dynamic template that helps you track, visualize, and analyze fan engagement performance across platforms. Built with simplicity, collaboration, and flexibility in mind, this dashboard empowers you to make smarter decisions that keep your audience connected.
⚙️ Key Features of the Fan Engagement KPI Dashboard in Google Sheets
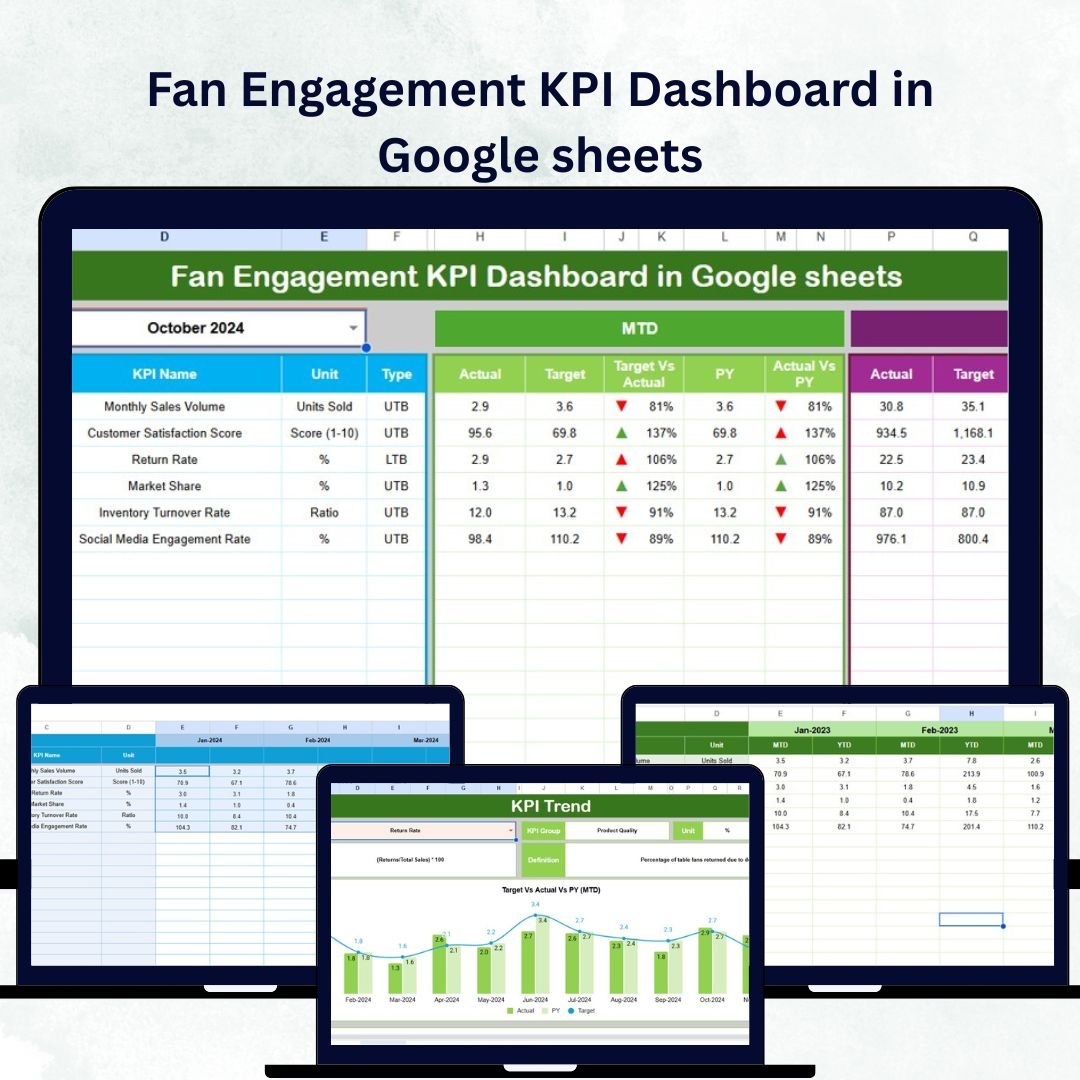
✅ All-in-One Dashboard: View all key performance indicators (KPIs) on one visual dashboard, including MTD (Month-to-Date) and YTD (Year-to-Date) values.
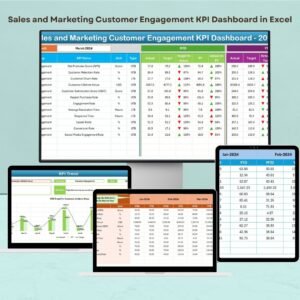
📊 Automatic Performance Updates: Change the month from the drop-down menu, and watch your data, charts, and metrics update instantly.Fan Engagement KPI Dashboard in Google sheets
🔁 Actual vs Target & PY Comparison: Compare actual performance with targets and previous year data using clear conditional formatting arrows for quick insights.Fan Engagement KPI Dashboard in Google sheets
📈 Trend Analysis Sheet: Select any KPI to see trend charts, definitions, and formulas that reveal performance patterns over time.
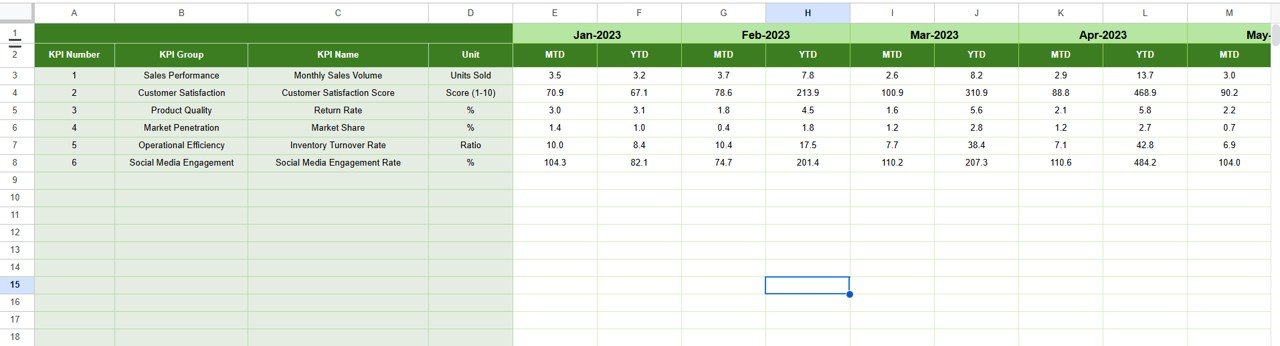
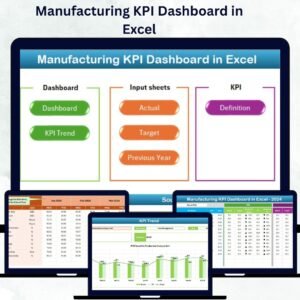
🧩 Complete Data Structure: Separate sheets for Actual Numbers, Targets, Previous Year Data, and KPI Definitions ensure full data transparency.
🌍 Collaborative & Cloud-Based: Multiple team members can access, edit, and update the dashboard simultaneously in real-time.
💡 Completely Customizable: Adaptable for sports clubs, event organizers, entertainment brands, musicians, and influencers.

📂 What’s Inside the Fan Engagement KPI Dashboard in Google Sheets
💠 Dashboard Sheet Tab:
A powerful, visual summary of all KPIs with MTD/YTD data, color-coded arrows, and automatic comparisons.
📈 KPI Trend Sheet:
Analyze performance trends by selecting any KPI and viewing MTD and YTD visual charts.
🧾 Actual Numbers Input Sheet:
Enter monthly data for each KPI. The dashboard updates automatically for seamless tracking.
🎯 Target Sheet:
Set and monitor engagement targets for each month to align with strategic goals.
📆 Previous Year Sheet:
Maintain historical context and identify long-term engagement patterns.
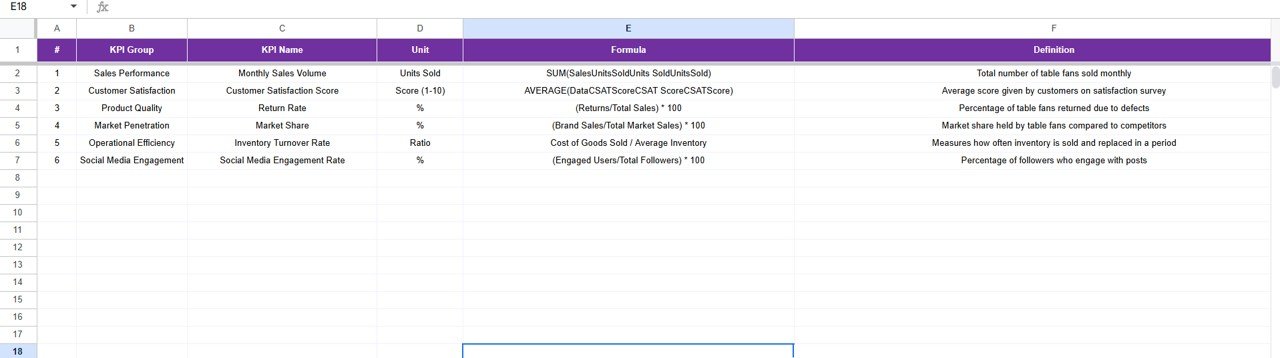
📚 KPI Definition Sheet:
A structured list of all KPIs with their units, formulas, and definitions for clarity and standardization.
🧠 How to Use the Fan Engagement KPI Dashboard in Google Sheets
1️⃣ Download and Open the Template in Google Sheets.
2️⃣ Define KPIs — choose metrics such as Engagement Rate, Event Attendance, or Followers Growth.
3️⃣ Input Data Monthly in the Actual and Target Sheets.
4️⃣ Switch Months using the drop-down menu to view updated insights.
5️⃣ Compare Results across months and previous year trends.
6️⃣ Use Charts and Arrows to identify where performance is improving or declining.
7️⃣ Take Action — optimize your content, campaigns, and fan interactions based on real-time insights.
This template transforms raw engagement numbers into actionable insights that help you drive fan growth, loyalty, and satisfaction.
👥 Who Can Benefit from This Fan Engagement KPI Dashboard
🎯 Sports Teams & Leagues: Track ticket sales, attendance, and fan engagement across games or seasons.
🎬 Entertainment Companies & Studios: Monitor show ratings, event participation, and social media interactions.
🎵 Artists & Musicians: Understand fan reactions, streaming activity, and campaign engagement.
💻 Content Creators & Influencers: Track followers, likes, shares, and engagement rates across platforms.
🏢 Marketing Agencies: Use it as a reporting tool for client engagement campaigns.
📱 Event Managers: Measure participation, satisfaction, and ROI of both physical and virtual events.
🎯 Why Choose This Template
This ready-to-use Google Sheets template is cost-effective, collaborative, and fully automated. You don’t need coding, macros, or complex software. Everything runs with built-in formulas and visual charts.
Whether you want to analyze social media reach, event performance, or community engagement, this dashboard gives you complete visibility in one place.


Reviews
There are no reviews yet.