



In the petroleum industry, monitoring performance across various dimensions such as production, safety, and financial health is crucial for business success. The Petroleum Industry KPI Dashboard in Google Sheets is a powerful tool that helps you track and analyze critical metrics, making it easier to optimize operations and make data-driven decisions. This comprehensive and customizable dashboard offers a real-time view of key performance indicators (KPIs), providing insights into production levels, safety incidents, financial performance, and more.
Designed specifically for the petroleum industry, this dashboard aggregates essential data into one easy-to-use platform, allowing managers and decision-makers to assess performance efficiently and take timely action to improve outcomes.

Key Features of the Petroleum Industry KPI Dashboard
🔑 Real-Time Data Tracking
Track essential KPIs such as production volume, safety incidents, and financial performance in real-time. With automatic updates, you’ll always have up-to-date insights into your business operations.
📊 Comprehensive Performance Insights
The dashboard consolidates multiple metrics across various areas such as production, safety, and operations, making it easier to monitor performance and identify trends over time.
📅 Customizable Metrics
Track the KPIs that matter most to your business. Whether you need to monitor refining capacity or revenue, the dashboard can be tailored to fit your specific needs.
💼 Multiple Data Sheets for Easy Management
The dashboard is divided into several sheets, each focused on a specific area:
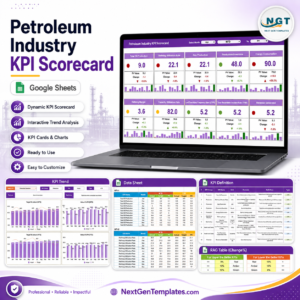
Overview Sheet: Provides an at-a-glance view of key metrics and performance indicators.
KPI Trend Sheet: Tracks performance trends over time, helping you spot long-term changes in operations.
Actual Numbers Sheet: Enter your actual data for MTD and YTD metrics.
Target Sheet: Set monthly and yearly performance targets for your KPIs.
Previous Year Sheet: Compare your current performance against the previous year to assess progress.
KPI Definition Sheet: Provides detailed definitions for each KPI, ensuring clarity in tracking.
📈 Data Visualization
The dashboard includes charts and visual indicators like up and down arrows to quickly highlight whether you’re meeting or missing targets. Easily interpret performance data with visual representations.
What’s Inside the Petroleum Industry KPI Dashboard
📋 Comprehensive Data Tracking
From production volumes to safety incidents, the dashboard includes a wide variety of KPIs to help you monitor every aspect of your petroleum operations.
📅 Monthly and Yearly Comparisons
The dashboard allows you to compare actual performance with targets and previous year data, helping you identify performance gaps and areas for improvement.
📊 Historical Trends
The KPI Trend Sheet allows you to track key metrics over time, offering a clear view of how performance is evolving, helping you make data-driven adjustments.
How to Use the Petroleum Industry KPI Dashboard
1️⃣ Download and Open the Template
Download the Petroleum Industry KPI Dashboard and open it in Google Sheets.
2️⃣ Input Actual Performance Data
Enter your actual performance data into the Actual Numbers Sheet. The dashboard will automatically update the charts and graphs with the latest data.
3️⃣ Set and Track Targets
Use the Target Sheet to input your performance targets for MTD and YTD. Track progress toward these goals using the dashboard’s visualizations.
4️⃣ Monitor Historical Trends
Track the performance of your key metrics over time using the KPI Trend Sheet. This helps you identify long-term trends and make proactive decisions.
5️⃣ Collaborate with Your Team
Share the dashboard with key team members to ensure everyone is aligned on business goals and performance targets.
Who Can Benefit from This Petroleum Industry KPI Dashboard
💼 Petroleum Industry Professionals
Whether you’re managing operations, production, or safety, this dashboard is designed to help you track all your critical KPIs in one place.
📊 Data Analysts
Use this dashboard to simplify the process of analyzing performance data. Track key metrics such as safety incidents and production rates, and visualize them in a way that’s easy to understand.
💼 Business Leaders & Managers
Monitor financial performance, track operational efficiency, and make data-driven decisions that enhance productivity and profitability.
📉 Safety Managers
Track safety metrics and ensure that safety standards are being met, helping you maintain a secure working environment.
Click here to read the Detailed blog post
Watch the step-by-step video Demo:
Visit our YouTube channel to learn step-by-step video tutorials
YouTube.com/@NeotechNavigators
Compatibility and Requirements
- Works in Google Sheets. You need a free Google account and a web browser.
- Charts and up and down arrows show where you meet or miss targets. Google explains charts in Add & edit a chart or graph.
Frequently Asked Questions
Which sheets are included?
Six sheets: Overview, KPI Trend, Actual Numbers, Target, Previous Year and KPI Definition.
What can I track?
KPIs such as production volume, safety incidents, refining capacity, revenue and other financial and operational metrics.
How do I update it?
Enter actual MTD and YTD data in the Actual Numbers sheet and targets in the Target sheet. The charts update with the latest data.
Can I compare with last year?
Yes. The Previous Year sheet lets you compare current performance with the previous year.
Is there an Excel or Power BI version?
Yes. See the Petroleum Industry KPI Dashboard in Excel and the Petroleum Industry KPI Dashboard in Power BI.
Related Oil and Gas Templates
- Petroleum Industry KPI Dashboard in Excel: the same KPIs in Excel
- Petroleum Industry KPI Dashboard in Power BI: the Power BI edition
- Petroleum Industry KPI Scorecard in Google Sheets: a scorecard view in Google Sheets
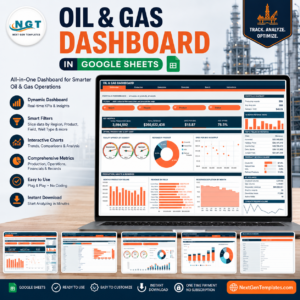
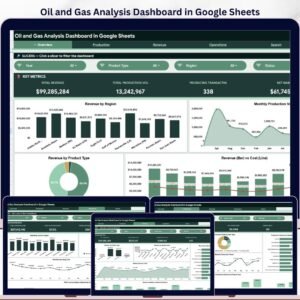
- Oil & Gas Dashboard in Google Sheets: an operations dashboard for oil and gas
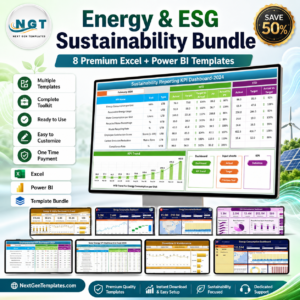
- Energy & ESG Sustainability Bundle: 8 energy templates in one download
Browse all Google Sheets KPI dashboards.



Reviews
There are no reviews yet.