
Struggling to track your document processing performance? Say goodbye to scattered data and hello to streamlined monitoring with the Document Management KPI Dashboard in Google Sheets. This powerful, ready-to-use dashboard helps you measure document retrieval time, accuracy, processing efficiency, and more—all in one place.
Whether you’re managing physical or digital records, this dashboard gives you real-time visibility into key document-related metrics and empowers you to improve organizational efficiency like never before.
⚙️ Key Features of the Document Management KPI Dashboard
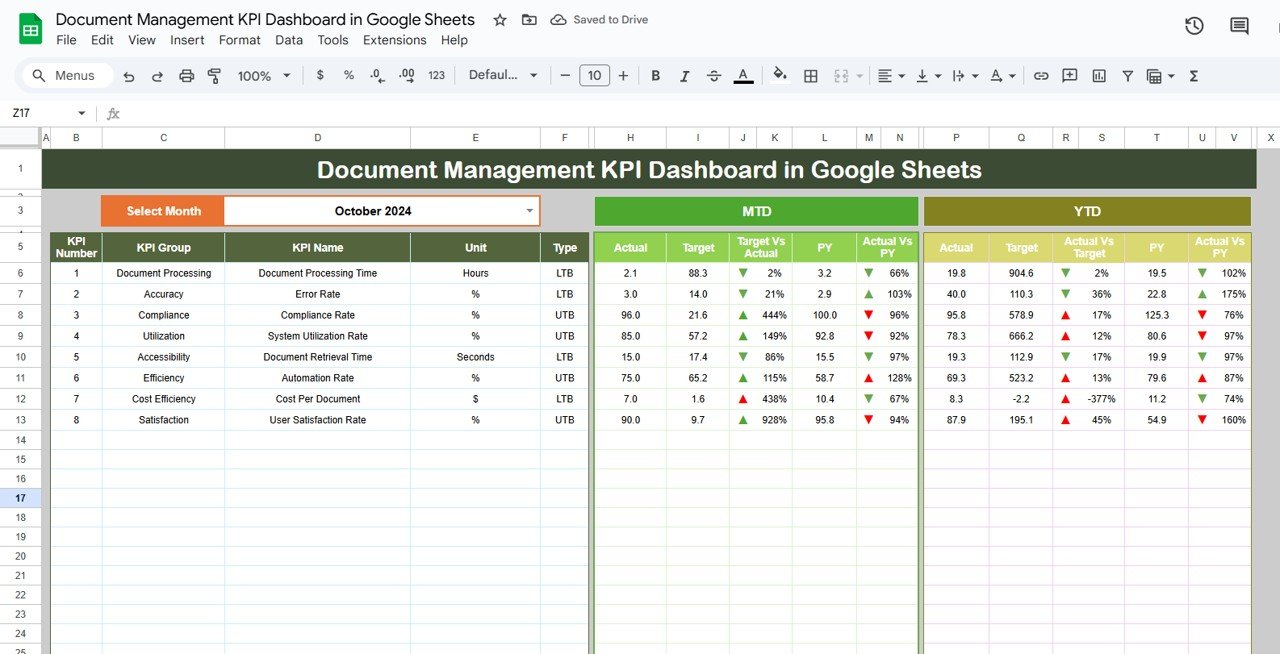
📌 Dashboard Sheet Tab (Main View)
Your central hub for tracking performance with up-to-date visualizations:
-
📈 MTD Actual vs Target – Track month-to-date performance
-
📊 Previous Year Comparison – See year-over-year progress
-
🎯 Target vs Actual Analysis – Measure gaps using smart visuals
-
🔺🔻 Color-coded Arrows – Instantly know if KPIs are above or below target
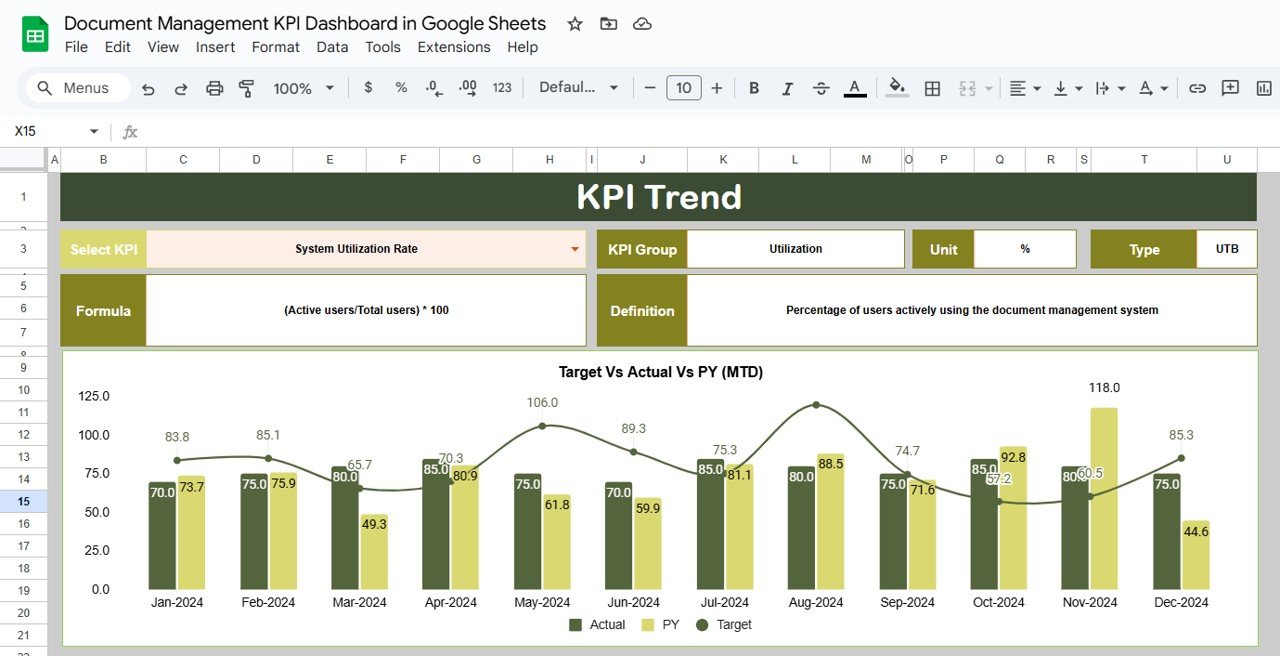
📉 KPI Trend Sheet Tab
Focus on one KPI at a time and track its performance over time:
-
🔍 Select KPIs via dropdown
-
📆 View trends for document retrieval time, storage accuracy, etc.
-
🧠 See KPI group, formula, unit, and definitions
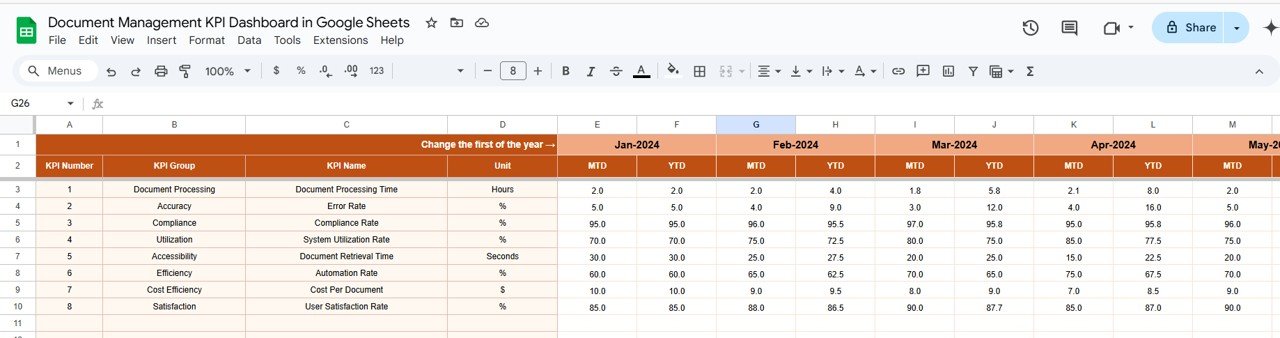
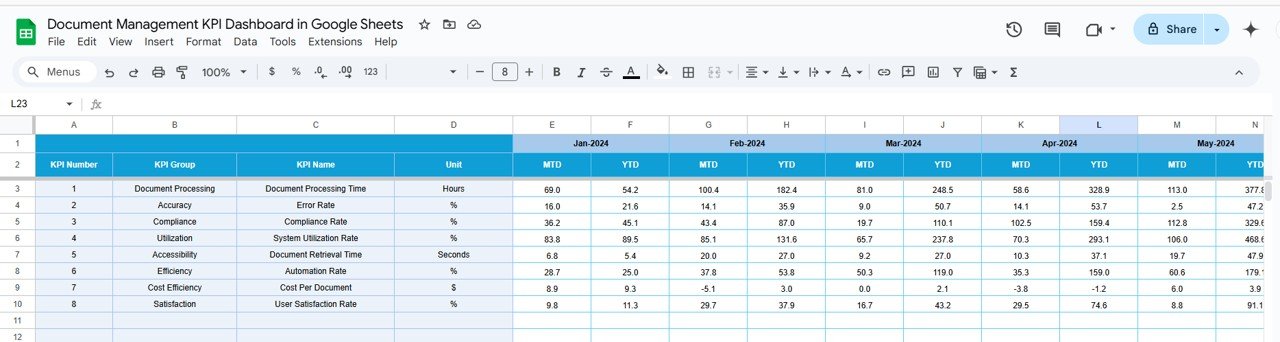
📥 Actual Number Sheet Tab
This is where the action happens—input your performance metrics here:
-
✍️ MTD and YTD values input
-
🔁 Dynamic month selection to auto-update dashboards
-
🗂️ Easy-to-use format
🎯 Target Sheet Tab
Set your monthly and yearly goals with clarity:
-
📅 Input KPI targets
-
🧭 Compare actual performance vs targets
-
📈 Get automated visuals for tracking progress
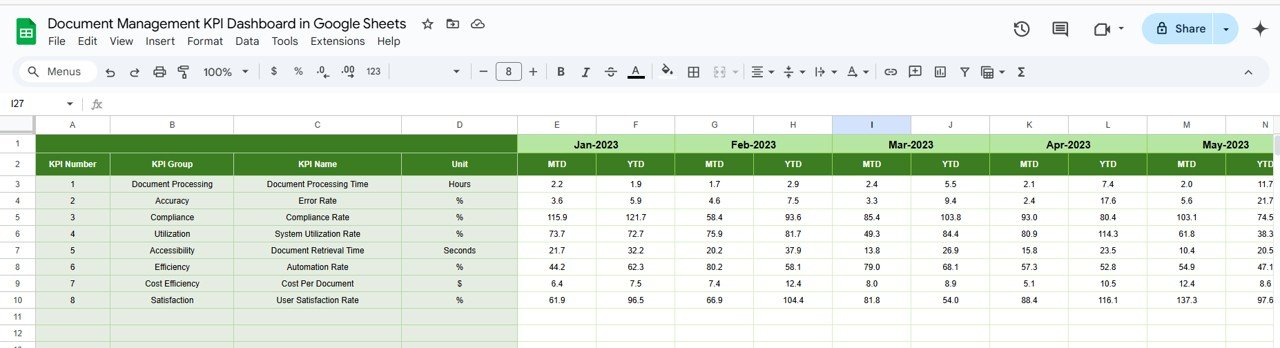
📆 Previous Year Data Sheet Tab
Understand how your performance stacks up historically:
-
📊 Compare each KPI against last year’s results
-
🔄 Identify trends and performance shifts
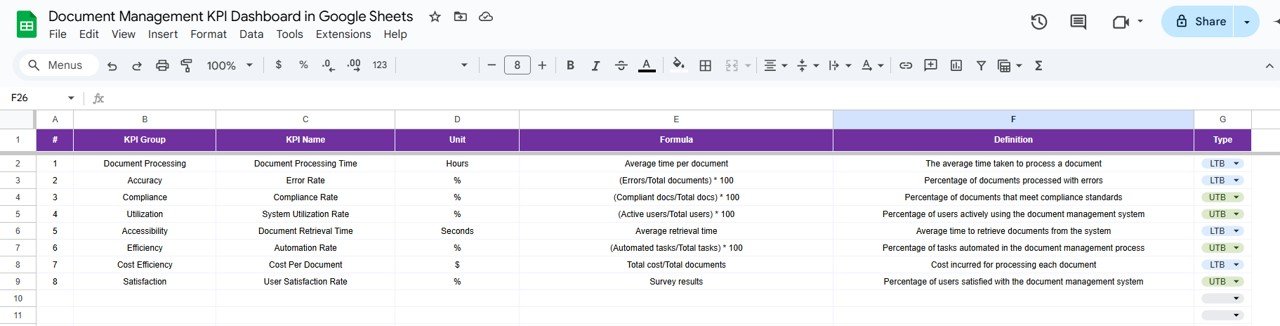
📖 KPI Definition Sheet Tab
A built-in reference sheet for all tracked KPIs:
-
🧠 Includes KPI name, group, unit, formula & definition
-
📚 Perfect for onboarding new team members or audits
📁 What’s Inside the Document Management KPI Dashboard
Everything is organized across six powerful worksheets:
-
🧭 Dashboard Sheet (Main View)
-
🔄 KPI Trend Analysis
-
📝 Actual Numbers Input
-
🎯 Target Setting Sheet
-
📊 Previous Year Comparison
-
📖 KPI Definition Sheet
✅ Fully editable
✅ Dynamic updates
✅ Designed for teams of all sizes
✅ No coding required
✅ Built-in dropdowns and conditional formatting
📌 How to Use the Document Management KPI Dashboard
📥 Step 1: Open in Google Sheets
No special software needed—just a browser and a Google account.
📝 Step 2: Input Actual & Target Data
Use the Actual Number and Target Sheet to feed the dashboard.
📊 Step 3: Visualize KPIs
View trends, target gaps, and comparisons on the dashboard instantly.
📅 Step 4: Monitor Monthly
Adjust the month in the Actual Sheet for real-time updates.
📈 Step 5: Analyze and Act
Use insights to improve document processing, reduce delays, and raise accuracy.
🎯 Who Can Benefit from This Dashboard?
🗃️ Operations Teams – Streamline document workflows
📂 Records Managers – Optimize storage and retrieval systems
🧑💼 Compliance Officers – Ensure document accuracy and timely access
📊 Admin Teams – Track document processing efficiency
📎 Project Managers – Improve process transparency and reporting
Whether you manage 100 or 100,000 files, this dashboard works for you.
💡 Why Choose This Google Sheets Dashboard?
✅ 100% cloud-based—no installation needed
✅ Real-time updates with dynamic charts
✅ Centralized tracking across KPIs
✅ Fully editable layout and formulas
✅ Easy collaboration across teams
✅ Built-in historical comparison and trend view
🔗 Click here to read the Detailed blog post
Click here to read the Detailed blog post


Reviews
There are no reviews yet.