


Managing debt isn’t just about paying bills—it’s about understanding where your money goes, how it grows, and what you can do to stay financially fit. Whether you’re managing personal loans, corporate liabilities, or a portfolio of debts, having an organized, visual, and actionable overview of your performance is key.
That’s exactly what the Debt Management KPI Dashboard in Google Sheets delivers! 💥
With dynamic dashboards, real-time calculations, customizable KPIs, and year-over-year comparisons—all packed into one spreadsheet—you can gain complete control over your debt portfolio. No complex software or finance background needed!

✨ Key Features of Debt Management KPI Dashboard in Google Sheets
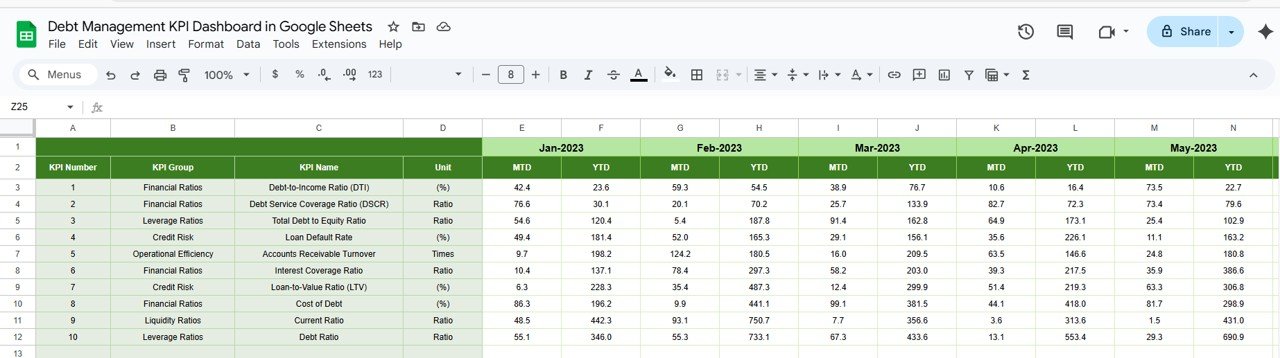
📊 Real-Time KPI Monitoring
Track all your MTD (Month-to-Date) and YTD (Year-to-Date) numbers side by side:
-
📈 MTD Actual vs MTD Target
-
🕒 YTD Actual vs YTD Target
-
🔁 Previous Year Comparisons
-
🔺🔻 Conditional Arrows for quick visual insights on over/underperformance
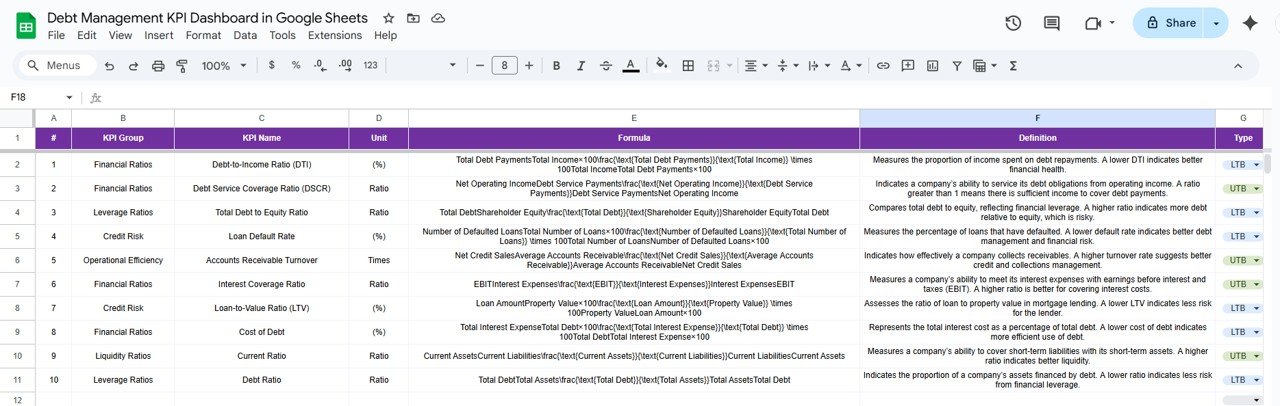
🧠 Detailed KPI Definitions & Trends
Dive deep into each KPI via the KPI Trend Sheet:
-
Select KPI from dropdown
-
See formula, unit, definition, and whether it’s UTB (Upper The Better) or LTB (Lower The Better)
Perfect for both financial analysts and beginners looking to understand what each metric means.
📥 Easy Data Input
Use structured tabs to input:
-
✅ Actual Numbers – Real MTD/YTD values
-
🎯 Target Numbers – Your financial goals
-
🗓 Previous Year Numbers – For trend tracking
Just update these sheets and the dashboard auto-refreshes! 🔁
📦 What’s Inside the Debt Management KPI Dashboard?
📍 Dashboard Sheet Tab
Your main control panel! View all KPIs with:
-
Instant visuals of MTD & YTD data
-
Target vs Actual bars and percentage gaps
-
Conditional arrows (▲/▼) indicating performance
-
Sleek, professional design perfect for presentations or personal tracking
🔍 KPI Trend Sheet
Click and analyze! Select a KPI from a dropdown and view:
-
KPI Group (e.g., Loan Metrics, Payment Metrics)
-
Unit of Measurement
-
Type (UTB/LTB)
-
Formula and simplified definition
Great for understanding how your KPIs are calculated and what impacts them.
🧾 Actual Number Sheet
Input your real numbers for each KPI on a monthly basis.
🗓 Change the first month in cell E1 and the rest adjusts automatically!
🎯 Target Sheet
Define your financial goals here. Add MTD and YTD targets for every KPI and track your performance visually on the dashboard.
📆 Previous Year Number Sheet
Insert past year’s data to enable year-over-year analysis. Ideal for tracking improvements and long-term financial strategy.
🧮 KPI Definition Sheet
Get clarity on every KPI you’re tracking:
-
KPI Name
-
Group
-
Formula
-
Definition
-
Unit
A handy reference for users and stakeholders alike.
🛠 How to Use the Debt Management KPI Dashboard
1️⃣ Start with the KPI Definition Sheet to configure your key metrics.
2️⃣ Fill in the Target Sheet with your financial goals.
3️⃣ Add real figures in the Actual Number Sheet each month.
4️⃣ Update Previous Year Sheet for historical tracking.
5️⃣ Watch your Dashboard update automatically!
6️⃣ Review the KPI Trend Sheet to analyze performance deeper.
7️⃣ Share with your team for collaborative financial planning.
👥 Who Can Benefit from This Debt Dashboard?
✅ Finance Managers – Monitor business liabilities monthly
✅ Small Business Owners – Track loans, credit lines & repayments
✅ Individuals – Manage personal loans, EMIs, and credit card debt
✅ Accountants – Help clients visualize debt goals
✅ Financial Advisors – Report KPI performance to stakeholders
✅ Startups – Set realistic repayment goals and monitor progress
✅ Nonprofits – Stay accountable with grant and operational debts
🚀 Key Benefits at a Glance
-
💡 Visual Insights: Spot trends and red flags at a glance
-
🛠 Fully Customizable: Add your own KPIs, formulas & visuals
-
📆 Monthly Monitoring: Update once a month, track all year
-
🔄 Historical Tracking: See where you’ve improved over time
-
🧑🤝🧑 Collaboration-Ready: Built-in Google Sheets = easy sharing
-
📊 No Tools Needed: Just open, edit, and review—all in Sheets
-
⏱️ Save Time: All calculations & charts auto-update
-
💰 Financial Discipline: Stay aligned with your debt goals


Reviews
There are no reviews yet.