Protect data. Comply with laws. Track performance—all in one place.
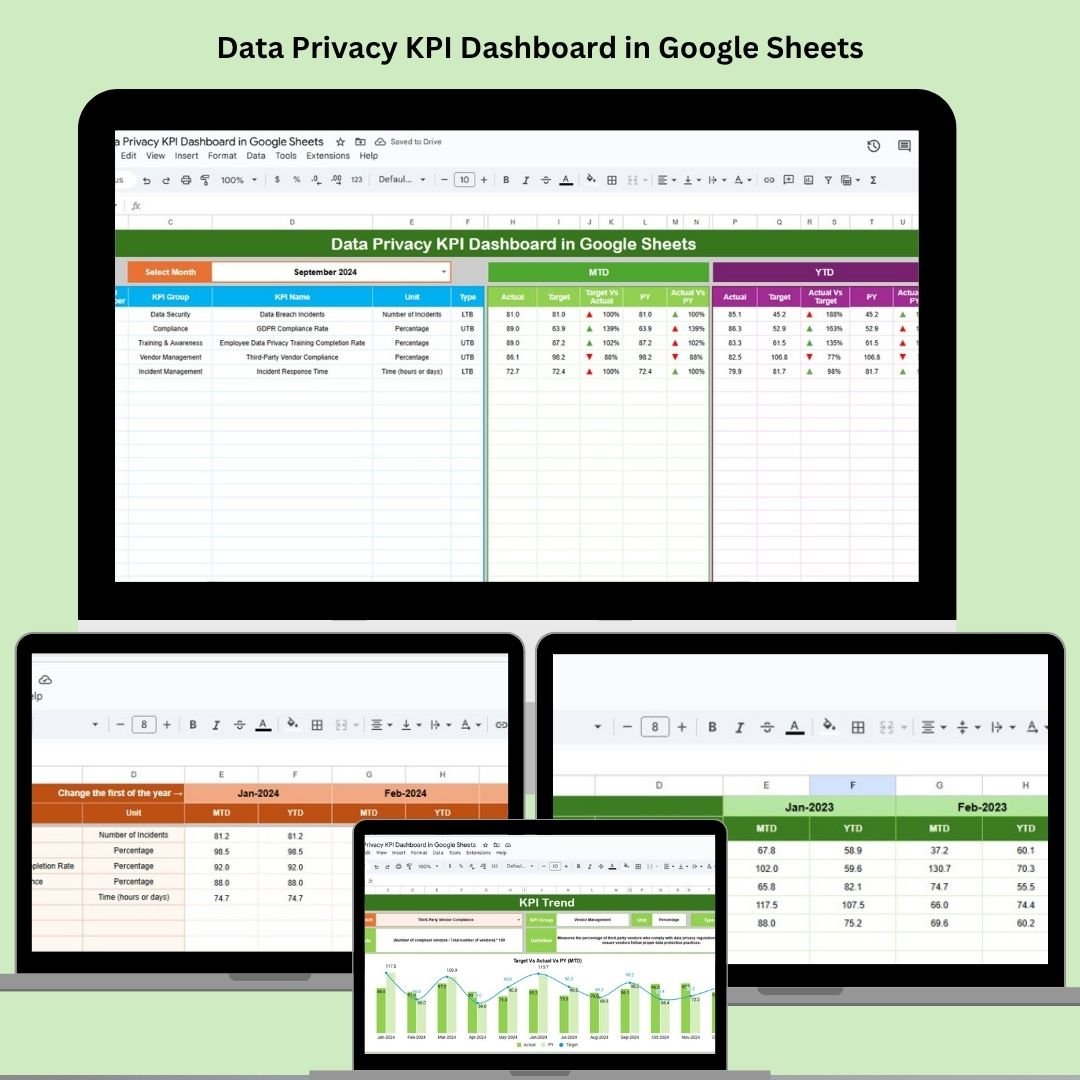
The Data Privacy KPI Dashboard in Google Sheets is a powerful, ready-to-use tool designed for modern businesses that take data protection seriously. Whether you’re managing GDPR, CCPA, or internal data governance, this dashboard helps you monitor, improve, and stay ahead of data privacy risks with real-time performance metrics.
This customizable dashboard offers clear visibility into your data privacy efforts, enabling smarter decisions and faster action.
⚙️ Key Features of the Data Privacy KPI Dashboard
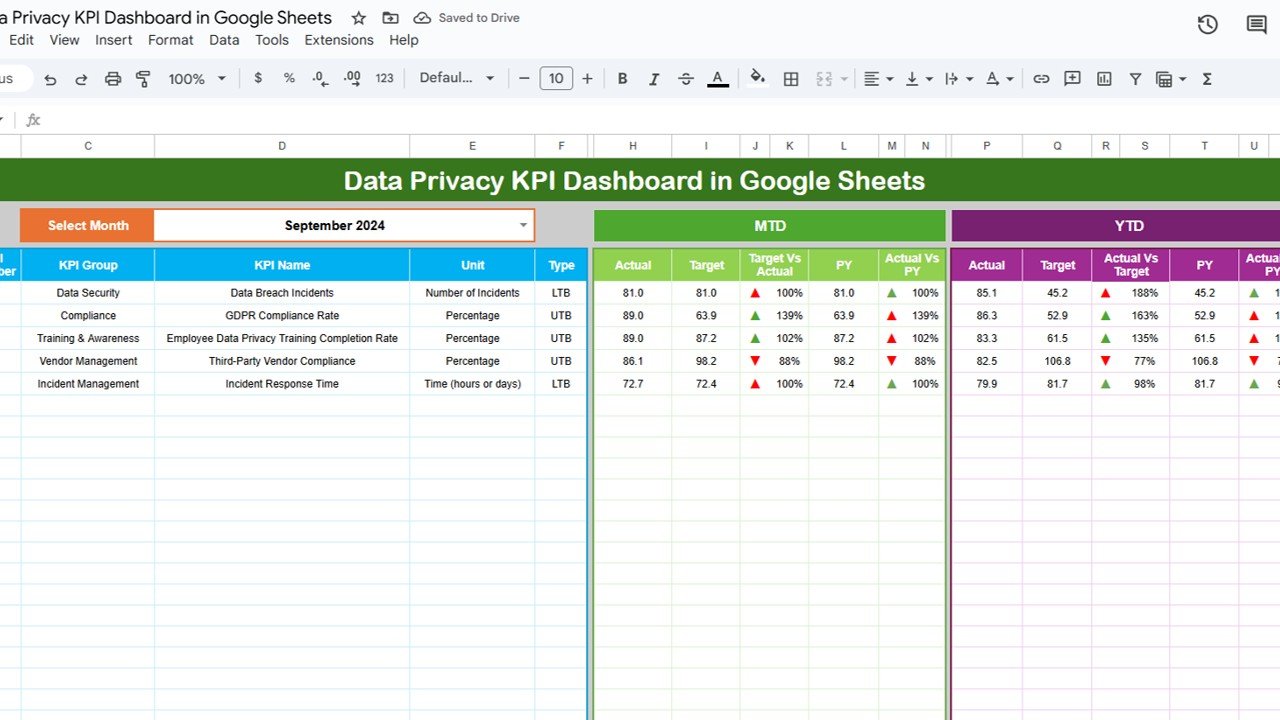
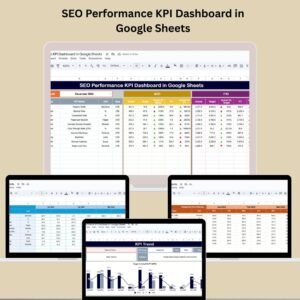
📊 Dashboard Sheet – Monthly & Yearly Privacy Snapshot
Track your Month-to-Date (MTD) and Year-to-Date (YTD) performance:
-
📅 Month Selector (D3) to toggle across reporting periods
-
🎯 MTD & YTD vs. Target & Previous Year data
-
📈 Visual arrows indicate performance (up/down trends)
-
📌 Instant compliance health check at a glance
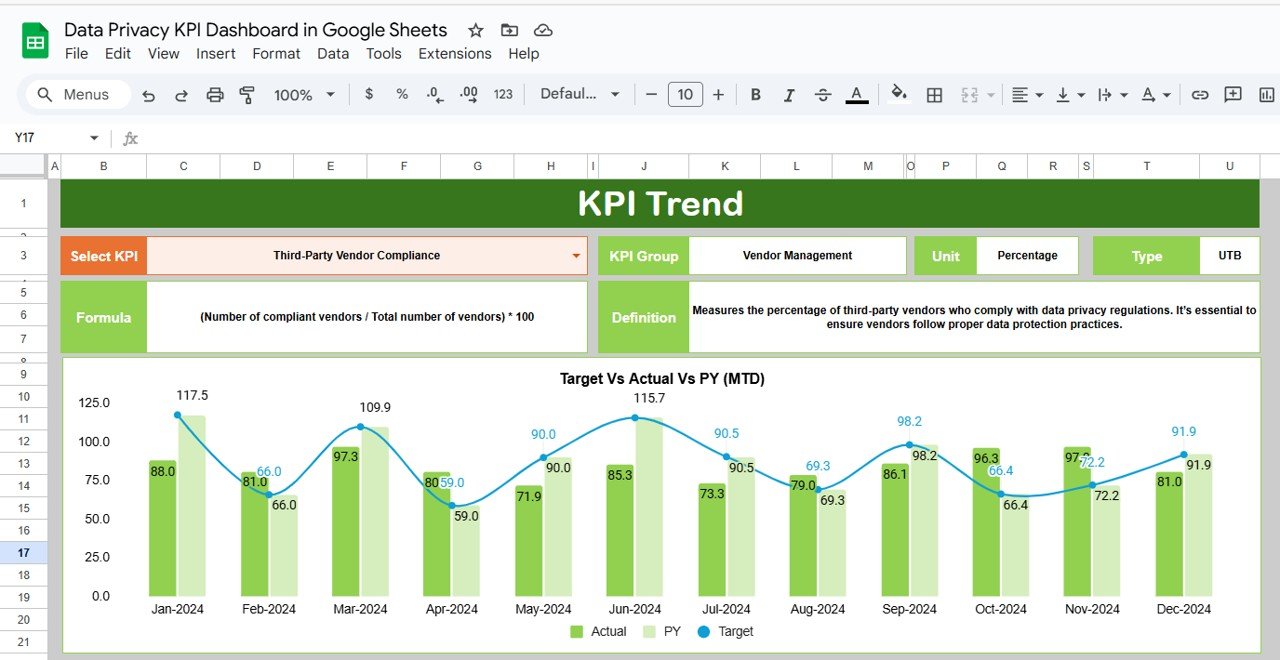
📈 KPI Trend Sheet – View Privacy KPI Progress Over Time
Analyze how your key metrics are trending monthly.
-
🧾 Select any KPI from the dropdown (C3)
-
📊 Shows KPI Group, Unit, and Type (UTB or LTB)
-
🧠 Includes formula and definition for full understanding
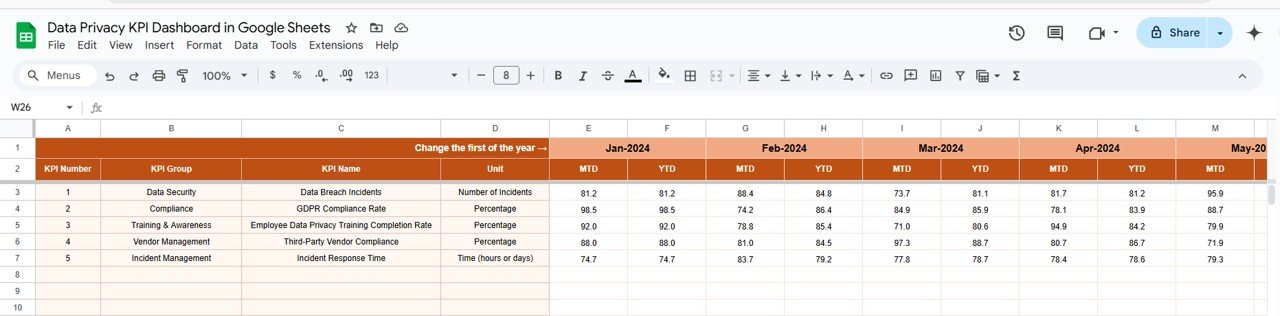
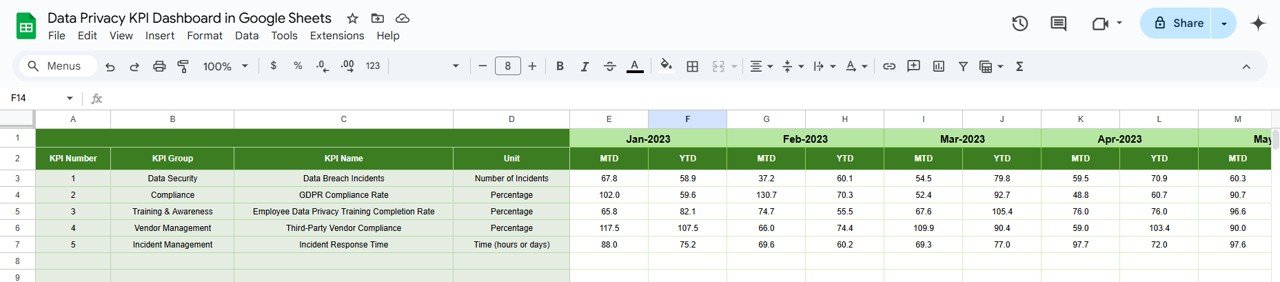
📋 Actual Numbers Sheet – Log Real-Time Performance
Easily input actual monthly and YTD performance values.
-
🖊️ Keeps your dashboard auto-updated
-
📤 Great for periodic privacy reviews and audits
🎯 Target Sheet – Set Compliance Goals That Matter
Define your data privacy KPIs and set monthly/YTD benchmarks.
-
🎯 Enables comparison against actual performance
-
🧭 Helps identify gaps and opportunities in data compliance
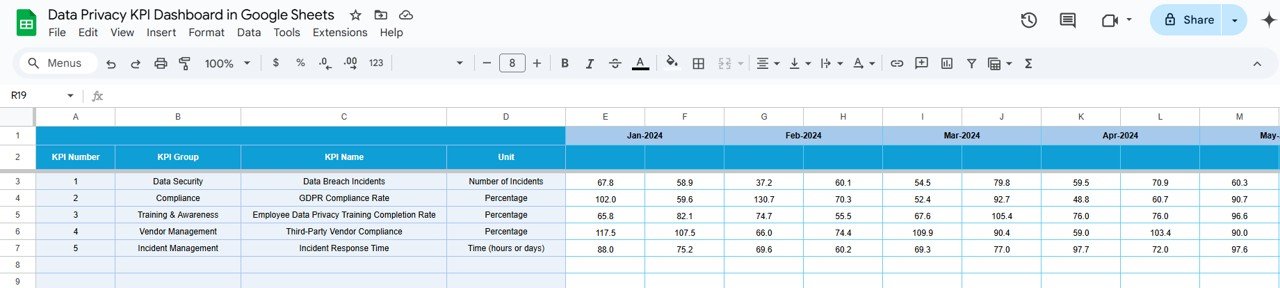
📆 Previous Year Sheet – Analyze Past Performance
Track where you were last year and how far you’ve come.
-
🔁 Year-over-year KPI comparisons
-
📈 Spot long-term trends or recurring issues
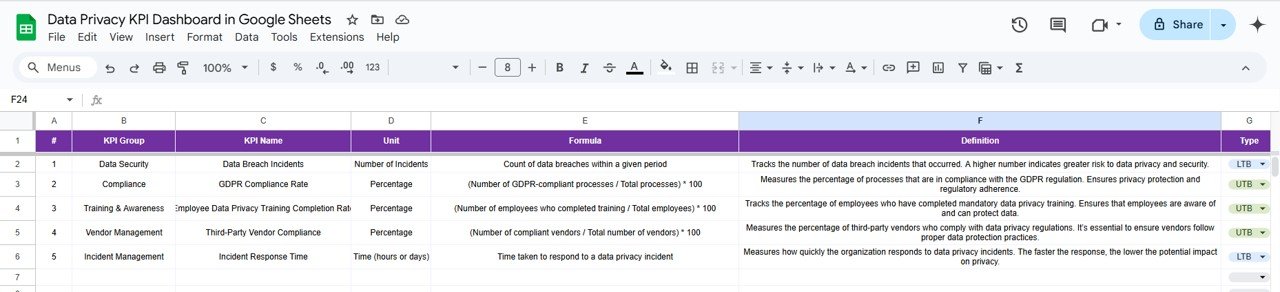
📘 KPI Definition Sheet – Standardize and Clarify Metrics
Understand every metric tracked on your dashboard.
-
🧾 KPI Name, Group, Unit
-
📐 Formula and explanation included
-
🧠 Clear alignment with compliance frameworks
🧭 How to Use the Data Privacy KPI Dashboard
1️⃣ Open the template in Google Sheets
2️⃣ Select the reporting month in the dashboard sheet
3️⃣ Input MTD & YTD data in the “Actual Numbers” tab
4️⃣ Set monthly/YTD targets in the “Target” sheet
5️⃣ Compare results with previous year metrics
6️⃣ Review KPI trends and visualize gaps
7️⃣ Use charts and arrows to present insights to your compliance team
👥 Who Can Benefit from This Dashboard?
🛡️ Data Protection Officers (DPOs) – Stay audit-ready
⚖️ Compliance Managers – Ensure regulations like GDPR & CCPA are met
💼 Legal Teams – Monitor risk, regulatory deadlines, and DSARs
🧑💻 IT Security Teams – Align KPIs with cybersecurity goals
🏢 SMBs & Enterprises – Scale your data privacy efforts with ease
💡 Why Choose This Google Sheets Dashboard?
✅ Real-time KPI tracking
✅ Fully editable & customizable
✅ Visual feedback for quick decisions
✅ Easily shareable with cross-functional teams
✅ Streamlines reporting and audits
✅ No software needed—runs directly in Google Sheets
🔗 Click here to read the Detailed blog post
Click here to read the Detailed blog post


Reviews
There are no reviews yet.