In today’s digital world, cyber incidents are not a question of “if” but “when.” The real differentiator lies in how quickly and effectively you respond—and to do that, you need visibility. The Cyber Incident Response KPI Dashboard in Google Sheets gives you exactly that.
This powerful, cloud-based dashboard lets you track key metrics in your cybersecurity workflow—from detection to resolution—without needing expensive software or complex tools. Whether you’re an IT security manager, CISO, or incident responder, this dashboard empowers you to monitor performance, identify gaps, and make smarter decisions.
✨ Key Features of the Cyber Incident Response KPI Dashboard
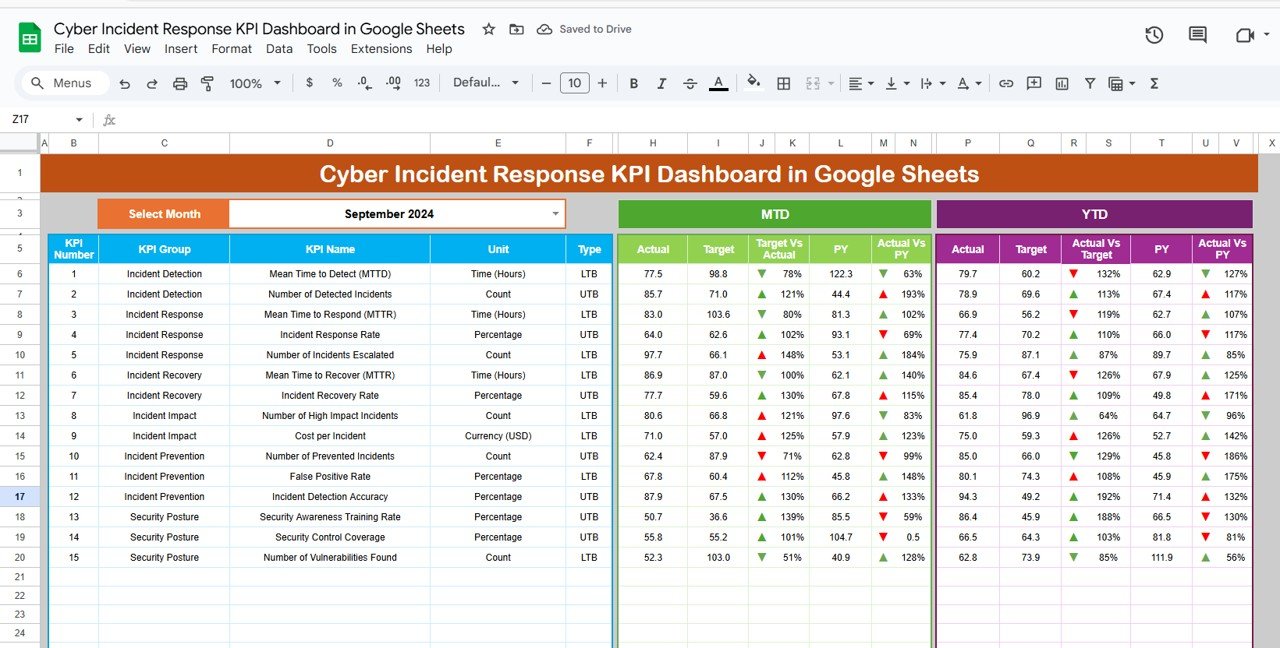
📆 Dynamic Monthly Selector – Choose any month in the dropdown, and the entire dashboard updates automatically!
📌 MTD/YTD Data Cards – View real-time Month-to-Date and Year-to-Date stats for each KPI.
📈 Target vs. Actual Comparisons – Instantly compare performance against set targets and past benchmarks.
🔄 Up/Down Arrows & Conditional Formatting – Visual indicators show trends for quick decision-making.
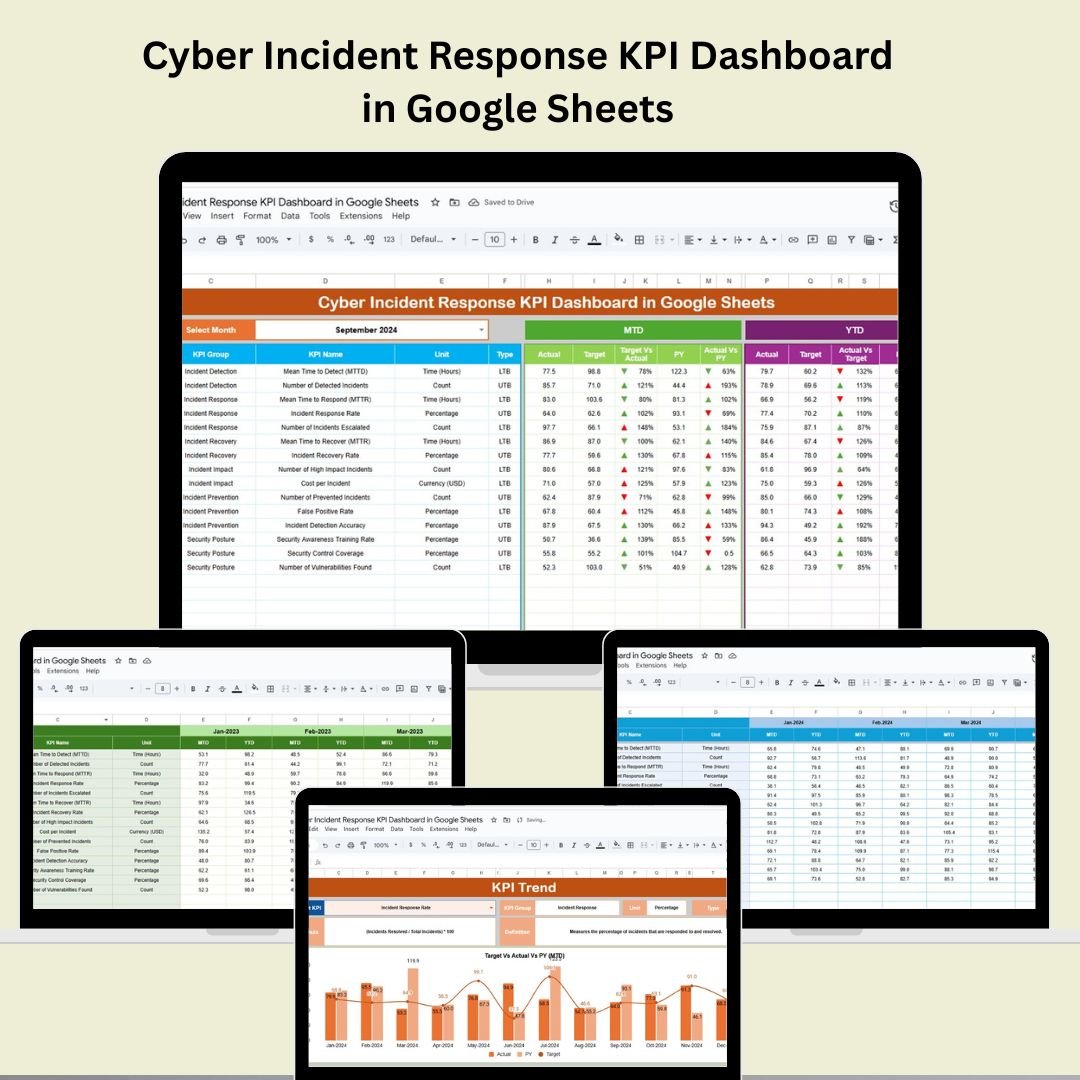
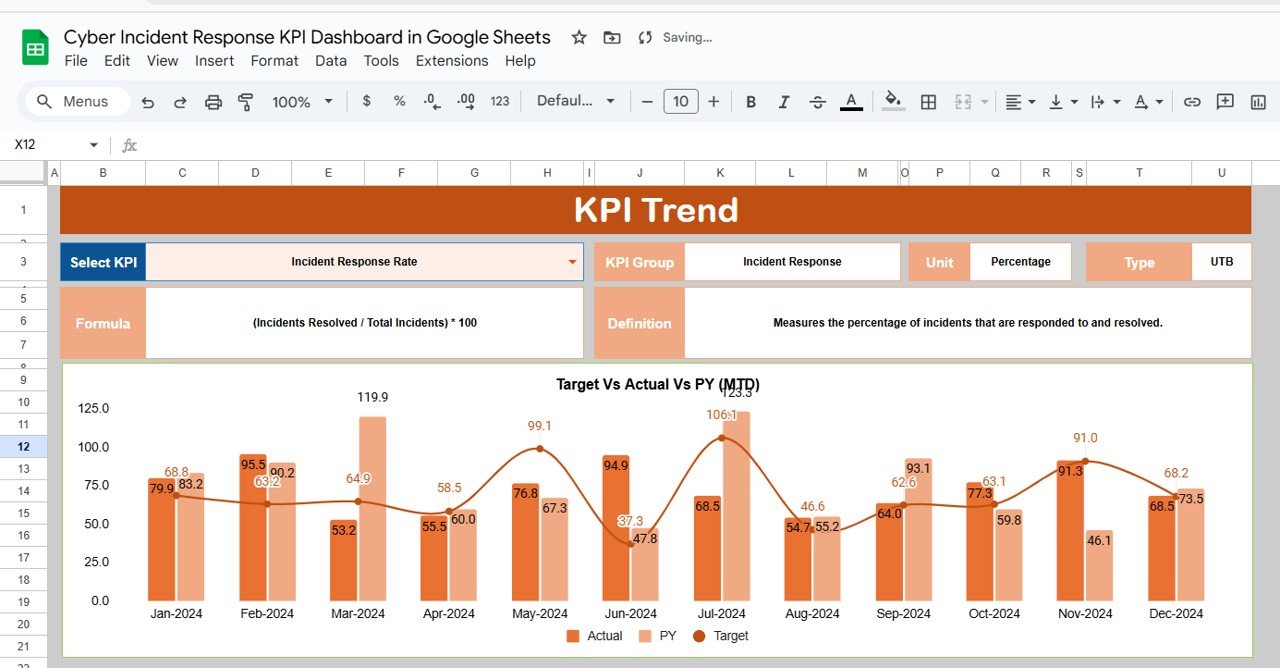
📊 KPI Trend Sheet – Analyze trends of selected KPIs over time. Drill down into definitions, formulas, and performance.
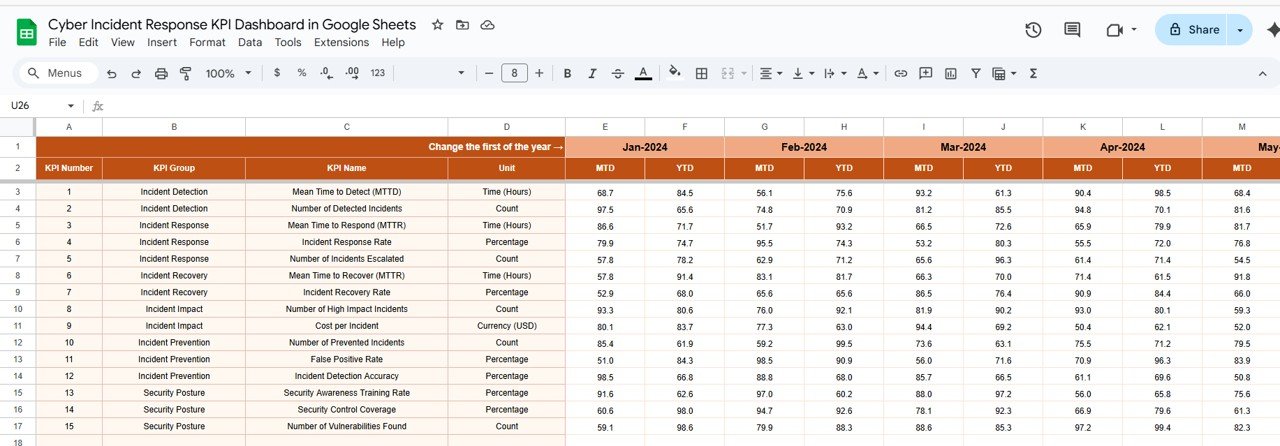
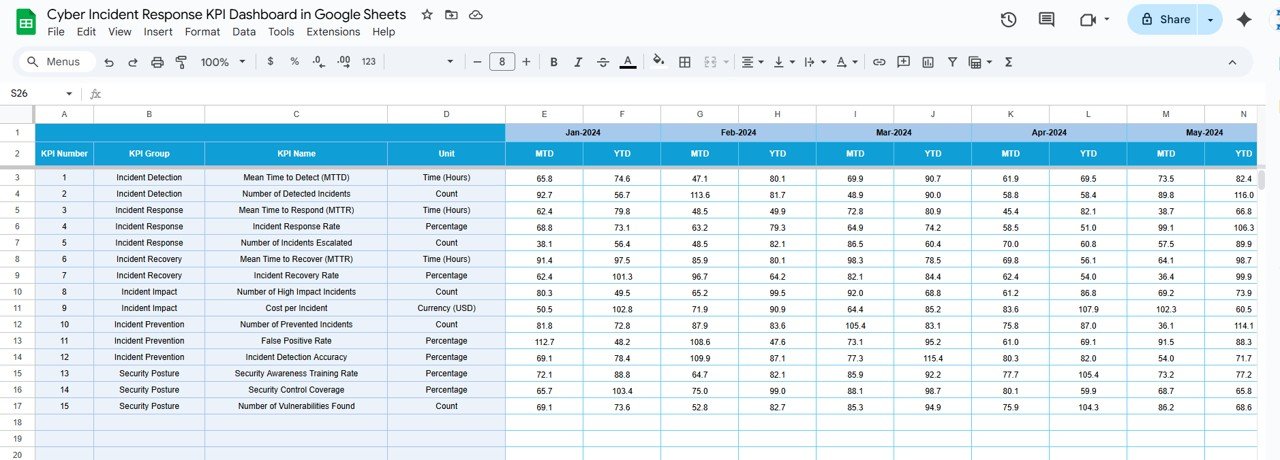
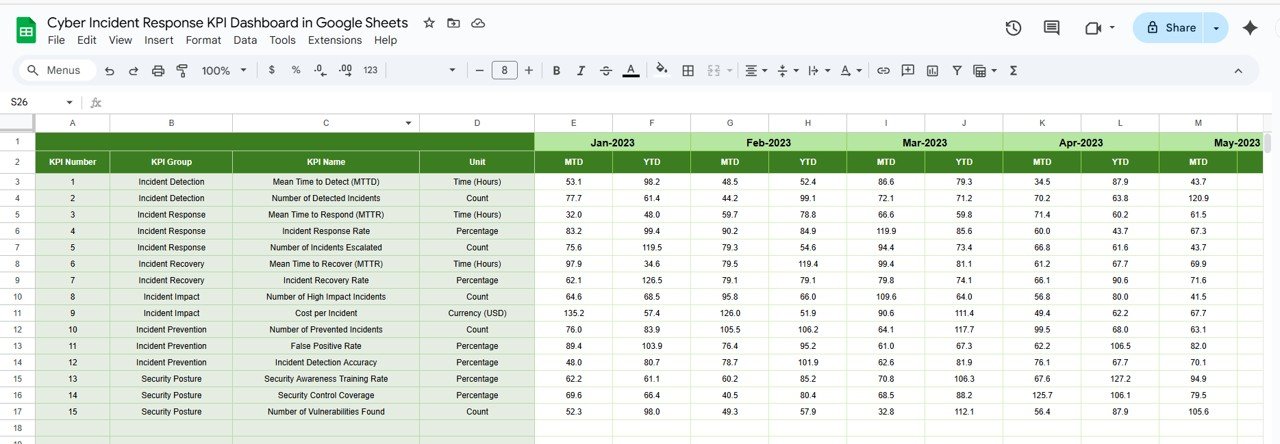
🧾 Actual, Target & Historical Sheets – Input and compare MTD/YTD values across different timelines.
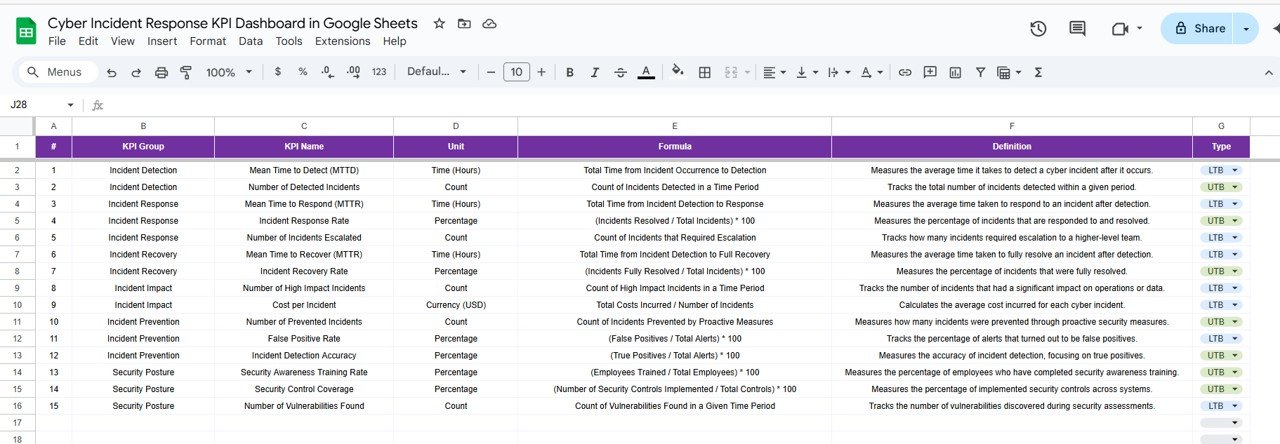
📋 KPI Definition Sheet – A built-in glossary for clarity on how each KPI is calculated and interpreted.
📦 What’s Inside the Dashboard
1️⃣ Dashboard Sheet Tab
Your main visual interface with MTD/YTD cards, monthly selector, comparison visuals, and automatic updates.
2️⃣ KPI Trend Sheet Tab
Pick any KPI from the dropdown and analyze its performance trend. See group, type (UTB or LTB), unit, and formula.
3️⃣ Actual Numbers Sheet
Input monthly actuals (MTD & YTD). The backbone of the dashboard’s visuals and metrics.
4️⃣ Target Sheet Tab
Set monthly and yearly targets for all KPIs—ideal for measuring SLA compliance.
5️⃣ Previous Year Sheet Tab
Track improvements or declines by comparing with last year’s data.
6️⃣ KPI Definition Sheet Tab
A glossary-like tab to ensure all stakeholders understand each KPI’s meaning, formula, and expected direction.
🚀 How to Use the Cyber Incident Response KPI Dashboard
🖊️ Step 1: Enter your current incident data in the “Actual Numbers” tab
🎯 Step 2: Fill target values for each KPI in the “Target” tab
📆 Step 3: Input previous year’s figures to enable year-over-year insights
🔍 Step 4: Select a month from the Dashboard dropdown (cell D3) to view trends
📊 Step 5: Use the “KPI Trend” tab for deeper insights and performance analytics
💬 Step 6: Present insights in meetings or share with your team for collaboration
👥 Who Can Benefit from This Dashboard?
✅ Cybersecurity Teams – Monitor SLA compliance and response speed
✅ IT Managers – Track risk exposure across departments
✅ CISOs & Executives – Get a snapshot of security performance
✅ SOC Analysts – Prioritize high-severity issues with clarity
✅ Compliance Officers – Ensure data protection policies are enforced
✅ MSSPs – Share KPI dashboards with clients in real-time
Whether you’re managing a small IT team or overseeing enterprise risk, this dashboard is your secret weapon.
💡 Why This Dashboard Is a Must-Have
✔ Real-Time Visibility – No more blind spots in your response efforts
✔ Easy to Share – Built on Google Sheets, accessible anytime, anywhere
✔ Saves Money – No premium software needed
✔ Simple to Use – Designed for non-techies too
✔ Fully Customizable – Add more KPIs, change formulas, automate alerts
✔ Perfect for Presentations – Visual-ready for stakeholders and clients
🔗 Click here to read the Detailed blog post Cyber Incident Response KPI Dashboard
Click here to read the Detailed blog post
🎥 Visit our YouTube channel to learn step-by-step video tutorialsCyber Incident Response KPI Dashboard
Watch the step-by-step video Demo:















Reviews
There are no reviews yet.