

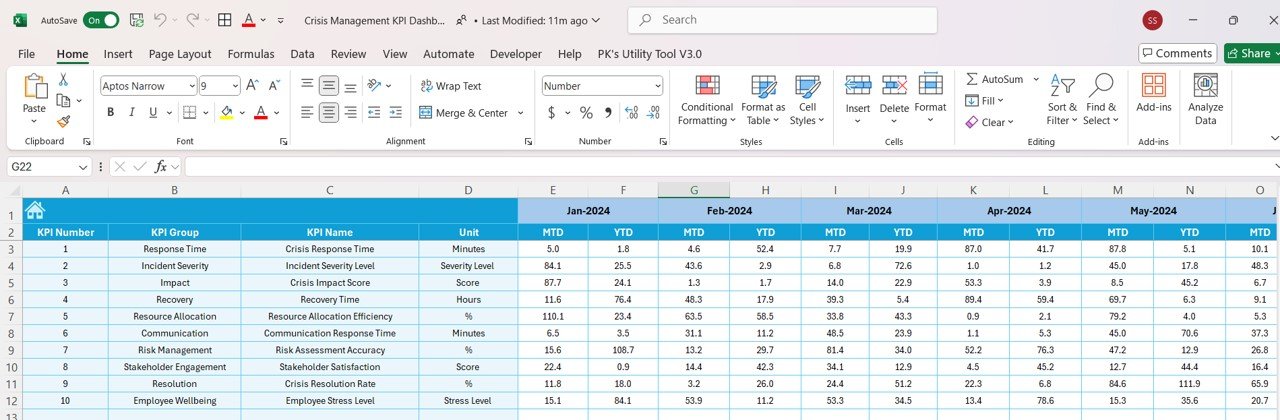
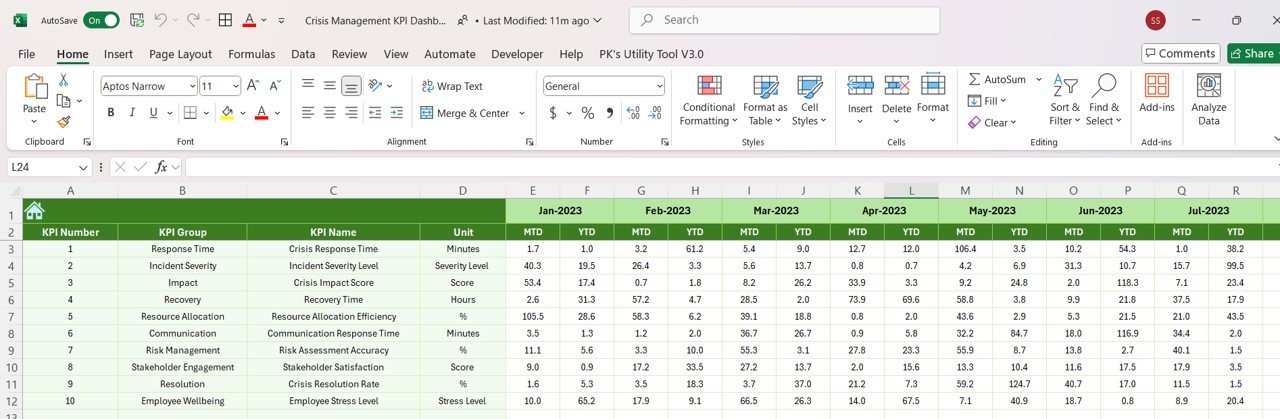
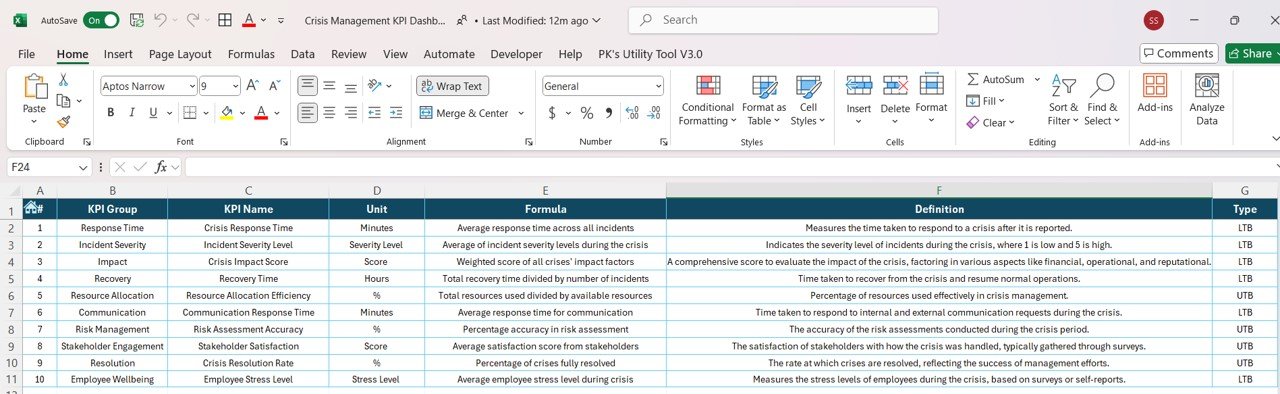

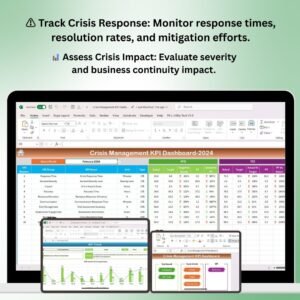
The Crisis Management KPI Dashboard in Excel is an essential tool for businesses and organizations to track, analyze, and manage their crisis response efforts. Whether you’re dealing with operational disruptions, public relations challenges, or emergency responses, this Excel-based dashboard provides a structured way to monitor key performance indicators (KPIs) and make data-driven decisions during a crisis.
With real-time tracking, this dashboard helps you assess the effectiveness of your crisis management plan, identify areas for improvement, and ensure that your response strategies are aligned with your business goals. Use it to track crisis response times, mitigation strategies, and communication effectiveness, all in one place.
Key Features of the Crisis Management KPI Dashboard in Excel
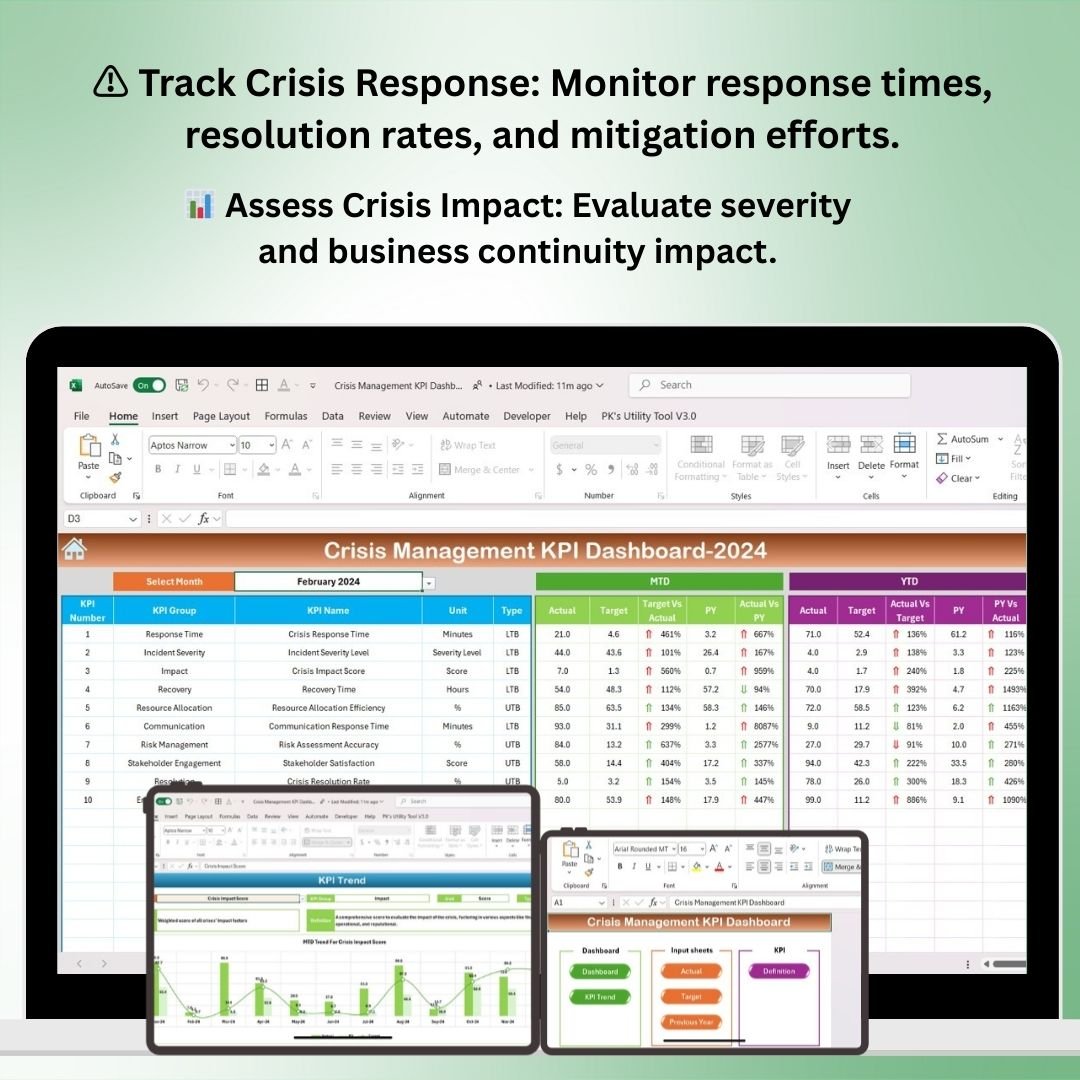
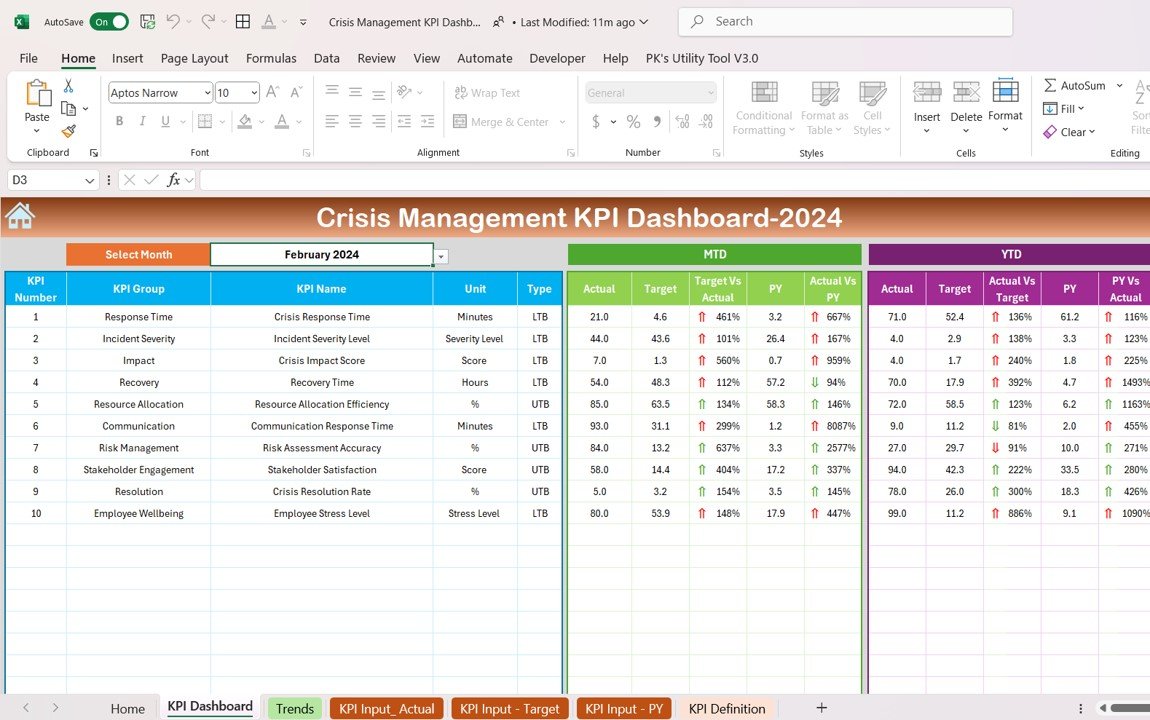
⚠️ Track Crisis Response & Management
Monitor key KPIs related to crisis management, including response times, resolution rates, and mitigation efforts. Understand how quickly your team is responding to crises and whether your mitigation strategies are effective.
📊 Evaluate Crisis Severity & Impact
Assess the severity of each crisis and its impact on your operations. Track critical incidents and understand how they affect business continuity, customer satisfaction, and brand reputation.
📅 Timeline & Deadlines Monitoring
Set and track deadlines for crisis resolution. Ensure your team is meeting critical response timelines and that every step of the crisis management plan is completed within the required timeframe.
💡 Communication & Coordination Effectiveness
Track the effectiveness of internal and external communications during a crisis. Measure how well your team coordinates with stakeholders, customers, and the public to manage the situation.
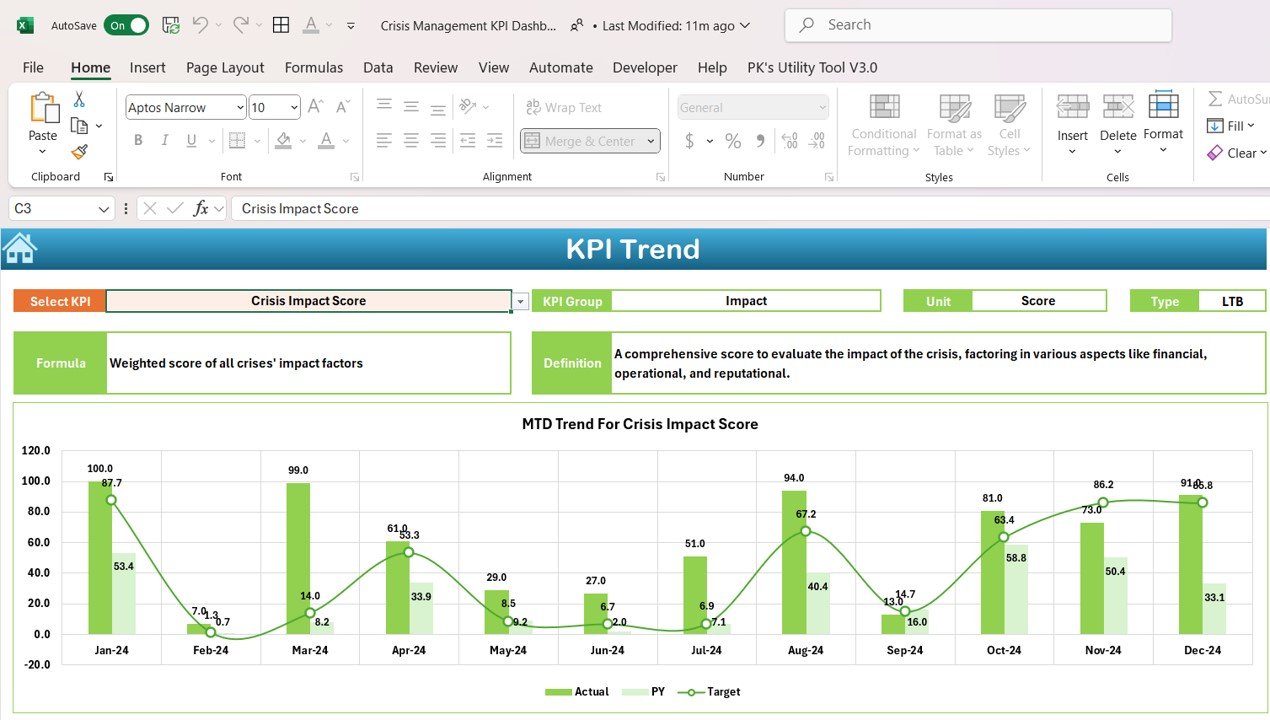
📉 KPI Trend Analysis & Reporting
Analyze crisis management trends over time. View historical data and monitor improvements in crisis response strategies, helping you optimize your future crisis management plans.
🖥️ Interactive & Customizable Dashboard
This Excel dashboard is interactive, allowing you to filter data, track KPIs, and drill down into specific crisis scenarios. It’s customizable to fit the unique needs of your organization.
Why You’ll Love the Crisis Management KPI Dashboard in Excel
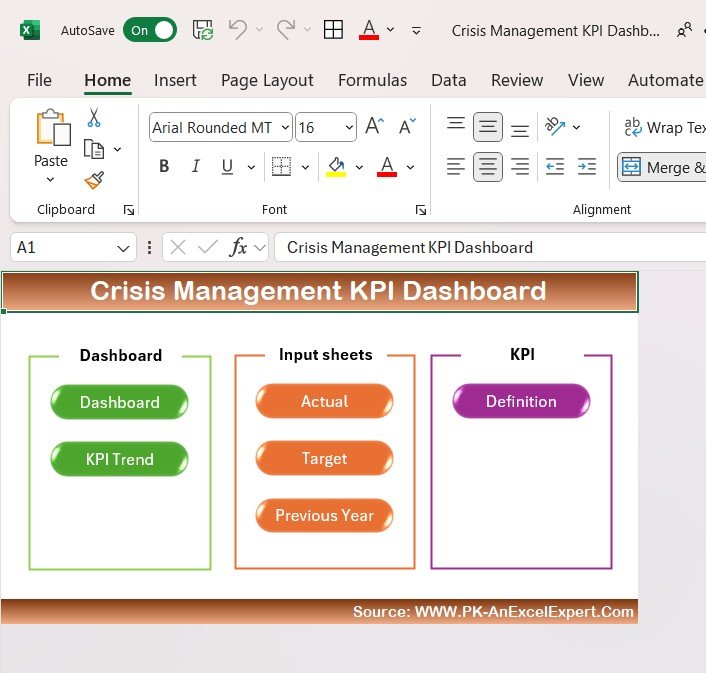
✅ Real-Time Crisis Tracking
Monitor and track crisis management performance in real-time, enabling quick adjustments to response strategies and helping you stay ahead during critical situations.
✅ Optimize Crisis Response Strategies
Track response times, resolution rates, and communication effectiveness to ensure that your team is following best practices and minimizing impact.
✅ Improve Crisis Coordination & Communication
Assess how well your team communicates and coordinates during a crisis, leading to improved transparency and better crisis management outcomes.
✅ Data-Driven Decision Making
Use the data collected in the dashboard to make informed decisions, refine your crisis management plans, and prepare for future incidents.
✅ Fully Customizable & Scalable
Adapt the dashboard to suit your organization’s crisis management needs. Whether you’re handling one crisis or managing multiple, this template scales to fit your requirements.
What’s Inside the Crisis Management KPI Dashboard Template in Excel?
- Crisis Tracking: Monitor the details of each crisis, including type, severity, and response times.
- Impact Analysis: Assess the impact of each crisis on business continuity, customer satisfaction, and brand reputation.
- Response Time & Resolution Metrics: Track time to respond and resolve each crisis.
- Communication Effectiveness: Evaluate how well your team communicates and coordinates during the crisis.
- Trend Analysis: Track improvements and trends in crisis management over time.
- Interactive Filters & Customization: Use slicers and charts to filter data and focus on specific crisis types or time periods.
How to Use the Crisis Management KPI Dashboard in Excel
1️⃣ Download the Template: Get instant access to the Crisis Management KPI Dashboard in Excel.
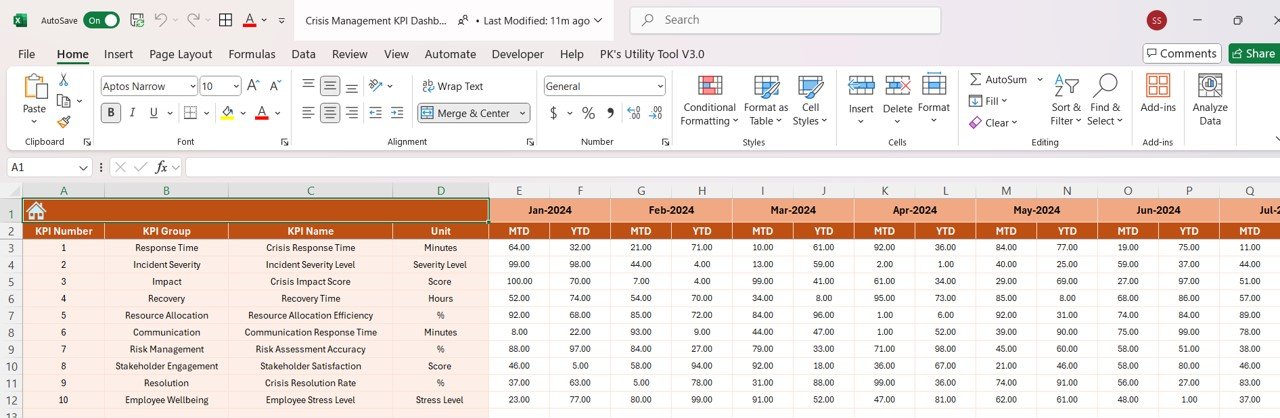
2️⃣ Input Crisis Data: Enter the details of each crisis, including response times, severity, and communication efforts.
3️⃣ Track & Monitor KPIs: Use the dashboard to track key metrics such as response time, resolution rates, and communication effectiveness.
4️⃣ Analyze & Optimize Crisis Management Plans: Use the insights to evaluate your crisis management strategies and refine your approach.
5️⃣ Generate Reports & Track Improvements: Create custom reports to monitor improvements in crisis response over time.
Who Can Benefit from the Crisis Management KPI Dashboard in Excel?
🔹 Crisis Management Teams
🔹 Emergency Response Teams
🔹 PR & Communications Teams
🔹 Operations Managers & Coordinators
🔹 Risk Management Professionals
🔹 Business Owners & CEOs
🔹 Companies Looking to Improve Crisis Response Plans
Ensure your organization is prepared for any crisis with the Crisis Management KPI Dashboard in Excel. Track response times, measure effectiveness, and make data-driven decisions to optimize your crisis management efforts.
Click here to read the Detailed blog post
Visit our YouTube channel to learn step-by-step video tutorials
Youtube.com/@PKAnExcelExpert





















Reviews
There are no reviews yet.