

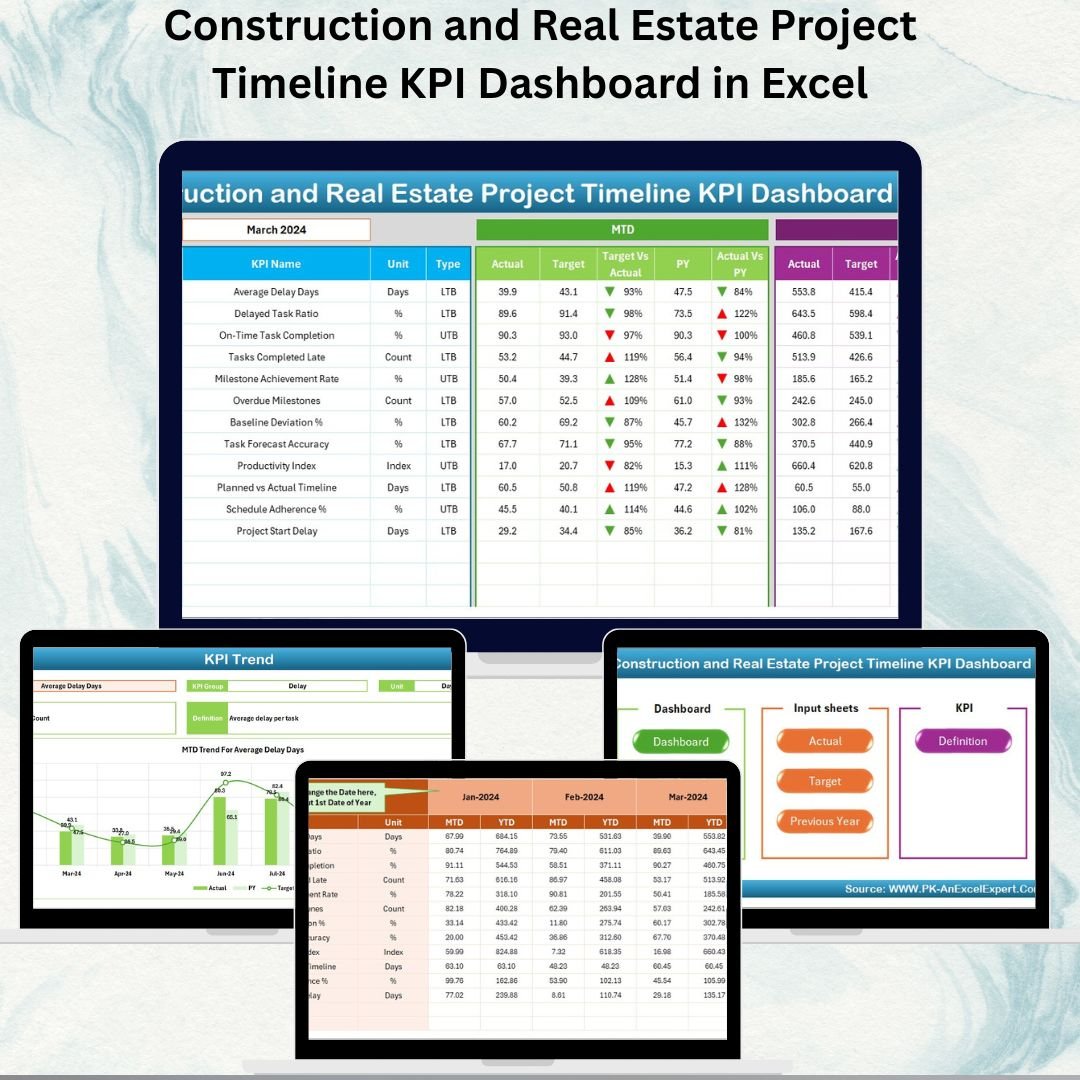

🏗️ Construction and Real Estate Project Timeline KPI Dashboard in Excel
In the construction and real estate industry, every day counts. Delays—not even major ones—can increase budgets, slow down cash flow, and damage relationships with clients and stakeholders. To stay on track and avoid costly surprises, project managers need a clear and accurate view of timelines and performance indicators.
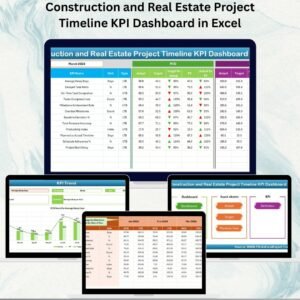
The Construction and Real Estate Project Timeline KPI Dashboard in Excel is a powerful, easy-to-use reporting tool that brings all timeline-related metrics into one centralized dashboard. Instead of switching between multiple spreadsheets, you’ll be able to monitor MTD vs Target, YTD vs Previous Year, spot trends, and take corrective action in real time.
It consolidates milestone tracking, schedule adherence, actual vs target days, and year-over-year comparisons into a dynamic Excel dashboard — so you can manage projects with confidence and clarity.
✨ Key Features of the Project Timeline KPI Dashboard
✅ Home Sheet – Fast Navigation
One-click access to all sheets (Dashboard, Trend, Input, Target, etc.)
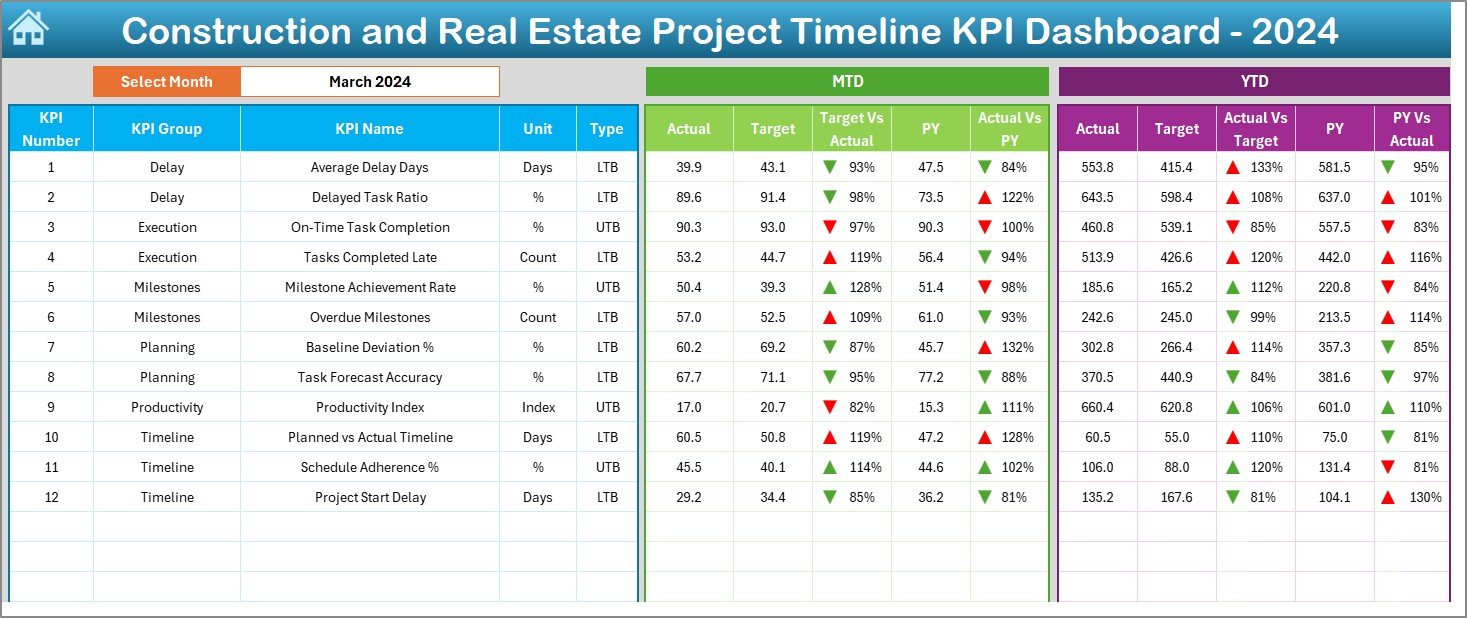
✅ Dashboard Sheet – High-Level Performance View
Select any month from a drop-down list (cell D3)
MTD Actual vs Target & Previous Year
YTD Actual vs Target & Previous Year
Conditional formatting (▲ / ▼ arrows) to highlight performance
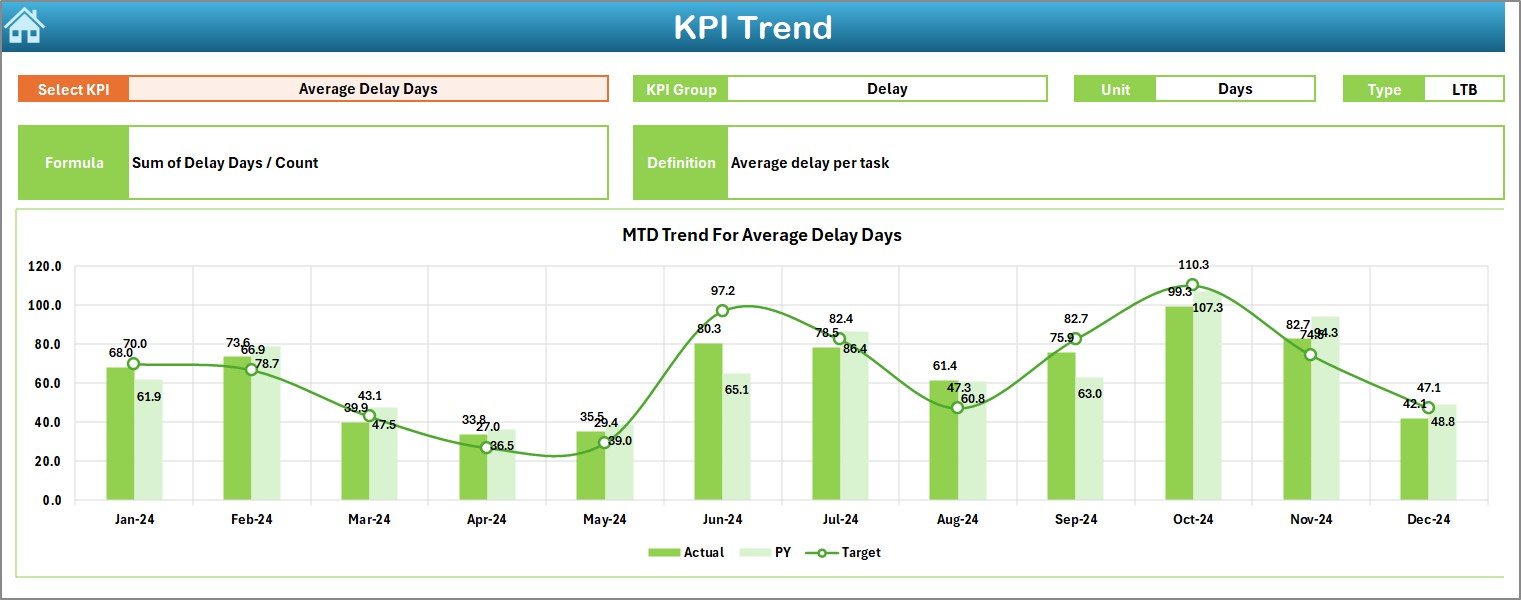
✅ KPI Trend Sheet – Month-by-Month Analysis
Drop-down for KPI selection (cell C3)
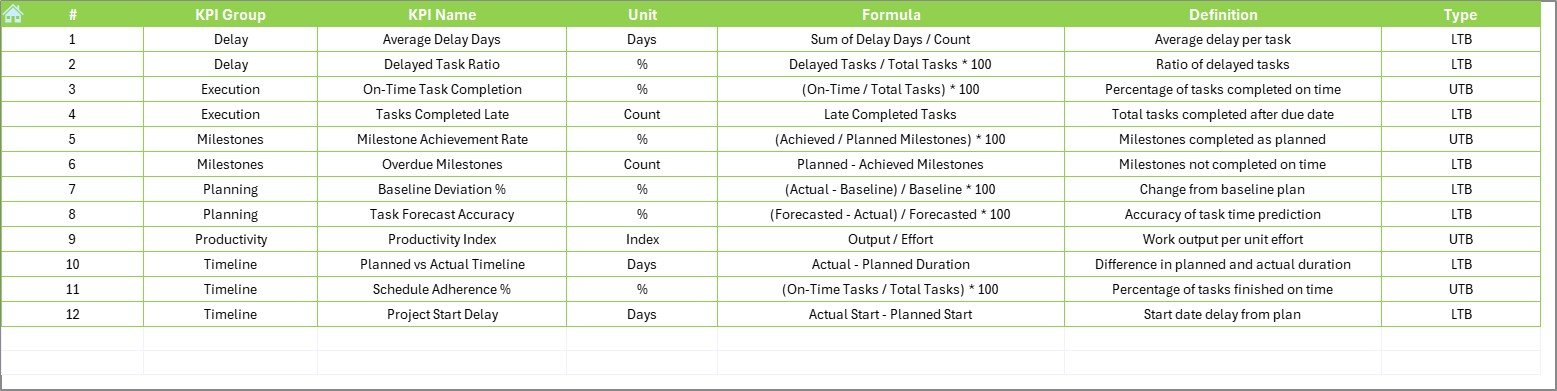
Displays KPI Group, Unit, Formula, Definition, and KPI Type (UTB/LTB)
Trend charts for MTD + YTD (Actual vs Target vs Previous Year)
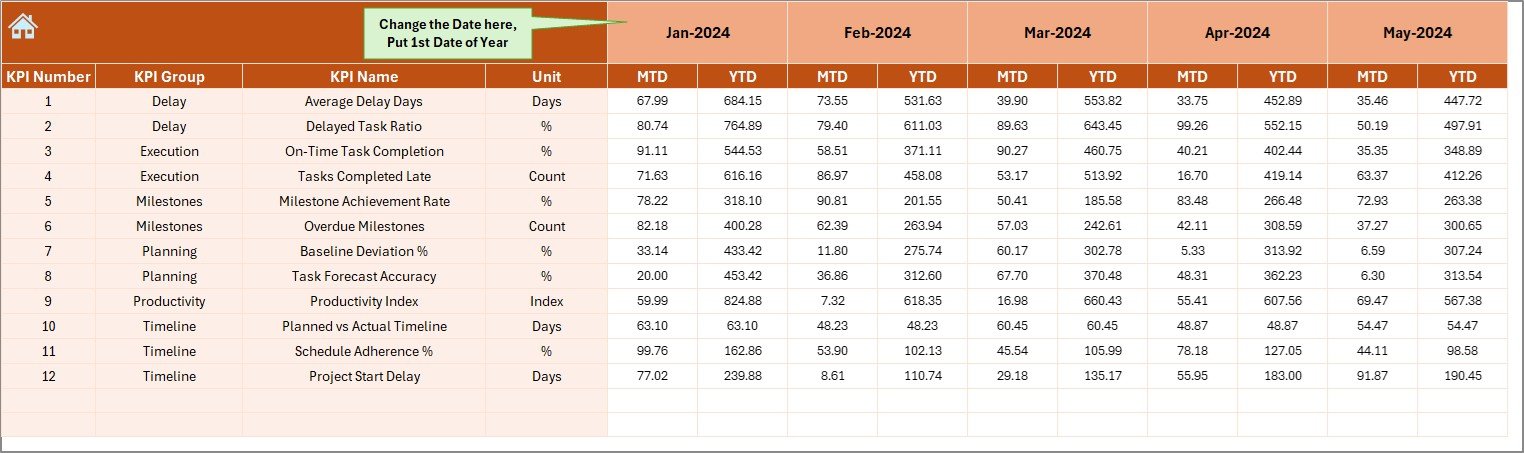
✅ Actual Numbers Input Sheet
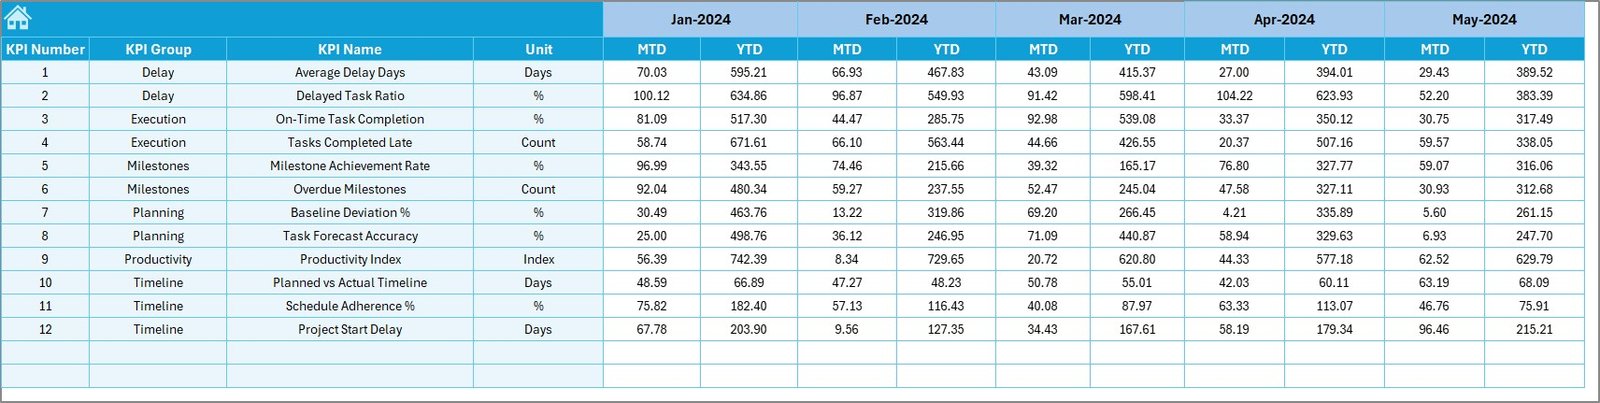
Enter monthly actual values
Set initial month in cell E1 to auto-update labels
✅ Target Sheet
Record MTD and YTD targets for each KPI
✅ Previous Year Numbers Sheet
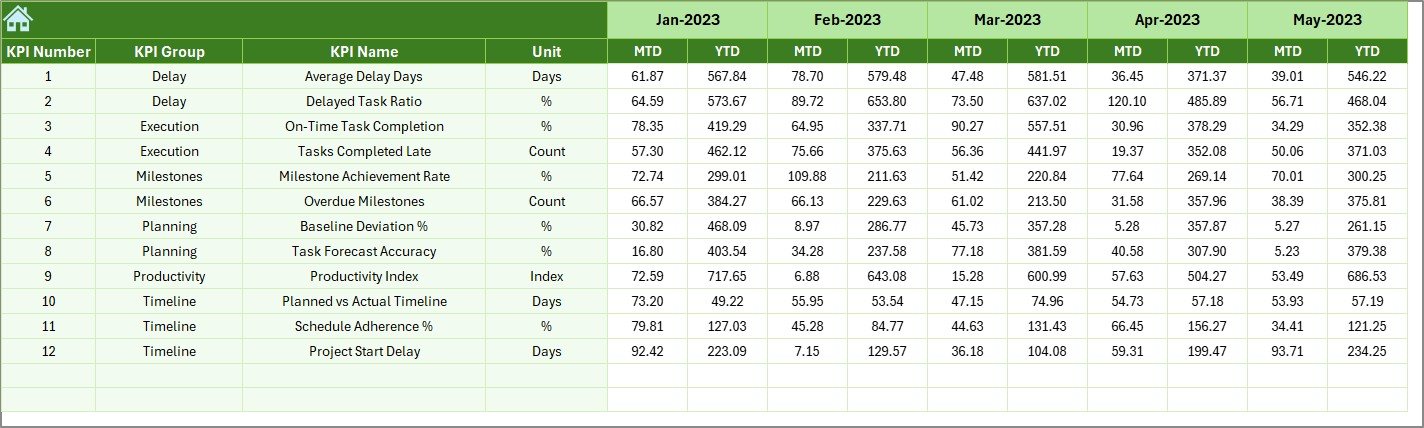
Historical data for year-over-year comparison
✅ KPI Definition Sheet
Define KPI Name, Group, Unit, Formula, and Description
Ensures users clearly understand each KPI
🛠 How to Use the Dashboard (Step-by-Step)
Step 1 – Define KPIs
Enter KPI names, formulas, and descriptions in the KPI Definition sheet.
Step 2 – Add Previous Year Data
Enter baseline values for each KPI on the Previous Year Numbers sheet.
Step 3 – Set Targets
Input monthly MTD & YTD targets in the Target Sheet.
Step 4 – Enter Actual Values
Fill in the Actual Numbers Input sheet every month (update cell E1 for the starting month).
Step 5 – Review the Dashboard
Go to the Dashboard sheet, select the month from the drop-down, and review Actual vs Target vs PY.
Step 6 – Analyze Trends
Use the KPI Trend sheet to spot upward or downward trends and take corrective action quickly.
🎯 Who Can Benefit from This Dashboard
🏢 Construction Companies – Monitor project schedules and prevent delays
🏗 Real Estate Developers – Track milestone completion and timeline performance
👷 Project Managers – Get real-time visibility on schedule risks
📊 Executives & Clients – Receive clear updates in a professional dashboard
🚀 Key Benefits
Improved Visibility – All project timelines and KPIs in one place
Faster Decisions – Quickly identify delays and performance gaps
Increased Accountability – Assign KPI owners and monitor progress
Better Resource Allocation – Use data to deploy teams and equipment
Historical Insight – Compare current vs previous year’s performance
100% Customizable – Add/modify KPIs as your project evolves
No Software Required – Runs entirely in Excel (no add-ins needed)
📖 Click here to read the Detailed blog post
Visit our YouTube channel for step-by-step video tutorials
Watch the step-by-step video tutorial:
Compatibility and Requirements
- Works in Microsoft Excel desktop (Excel 2016 or later, or Microsoft 365).
- You pick the month and the KPI from drop-down lists. Microsoft explains drop-downs in Create a drop-down list.
Frequently Asked Questions
Which sheets are included?
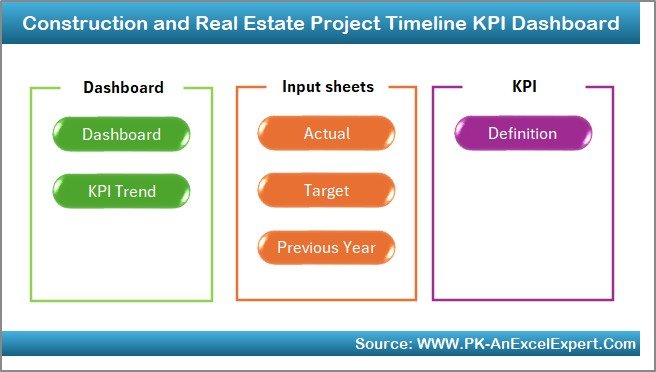
The workbook has a Home sheet, Dashboard, KPI Trend, Actual Numbers Input, Target, Previous Year Numbers and KPI Definition.
How do I choose the month on the dashboard?
Select the month from the drop-down list in cell D3 on the Dashboard sheet. It then shows MTD and YTD actuals against target and previous year.
How do I enter my own data?
Type monthly actual values on the Actual Numbers Input sheet and set the starting month in cell E1. Enter MTD and YTD targets on the Target sheet and last year’s values on the Previous Year Numbers sheet.
Can I add or change KPIs?
Yes. Define each KPI’s name, group, unit, formula and description on the KPI Definition sheet, and the KPI Trend sheet shows those details when you select the KPI.
Is there a Google Sheets version for construction projects?
See the Construction Project Timeline in Google Sheets for a timeline template in Google Sheets.
Related Construction and Real Estate Templates
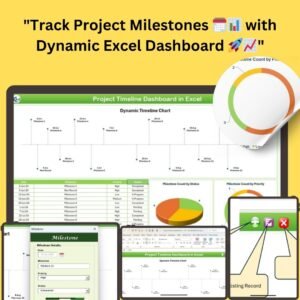
- Project Timeline Dashboard in Excel: a general project timeline view
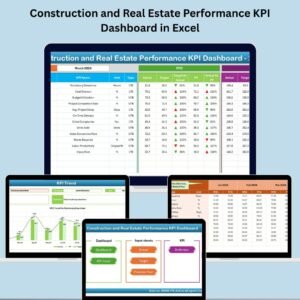
- Construction and Real Estate Performance KPI Dashboard in Excel: overall performance KPIs in the same format
- Construction and Real Estate Cost Efficiency KPI Dashboard in Excel: cost KPIs for the same projects
- Construction Project Timeline in Google Sheets: the timeline topic in Google Sheets
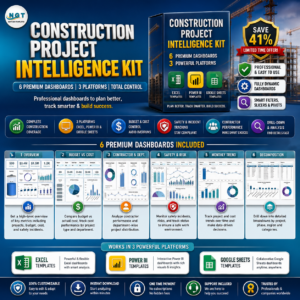
- Construction Project Intelligence Kit: a bundle of 6 templates for construction projects
Browse all Excel KPI dashboards.


























Reviews
There are no reviews yet.