

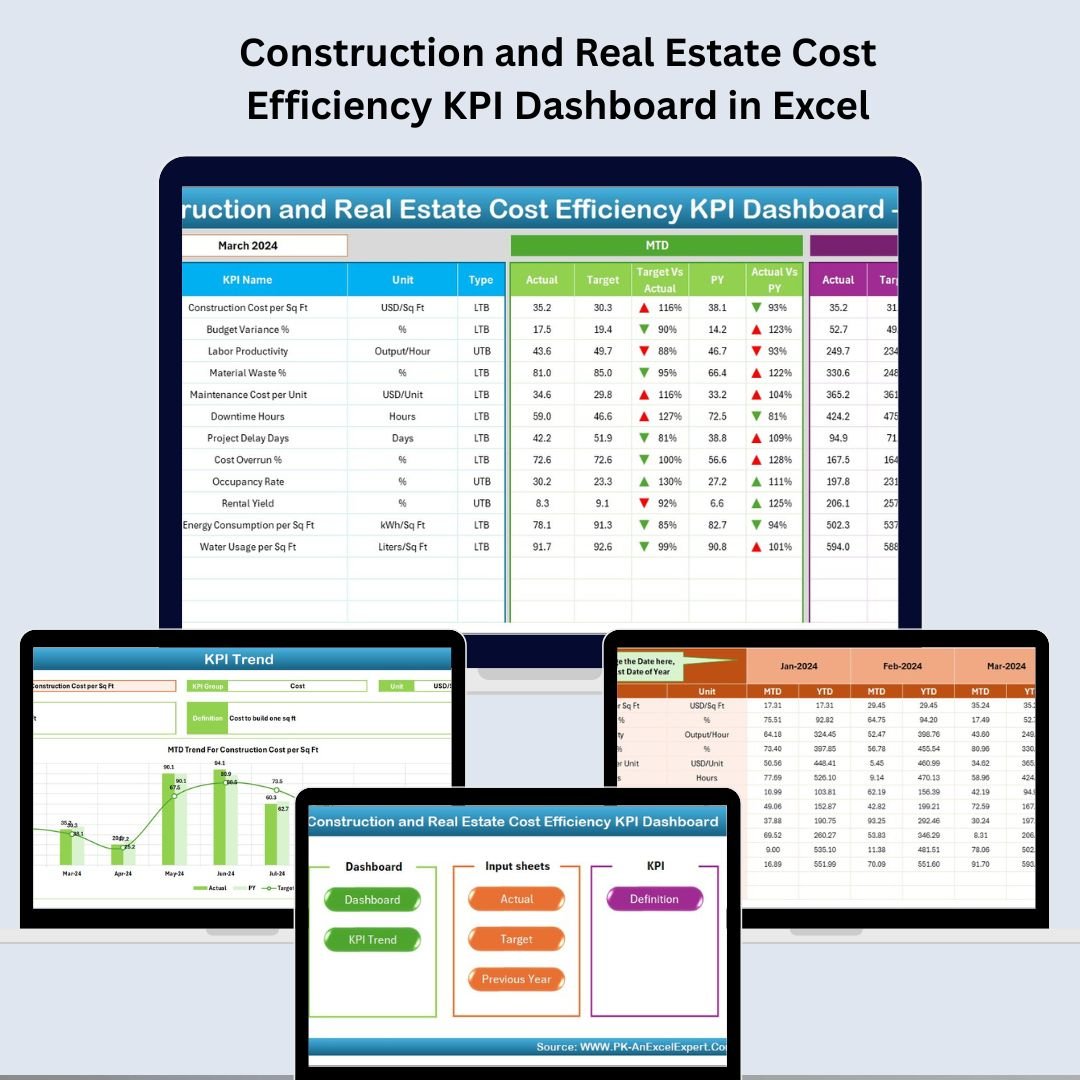
In the construction and real estate sector, controlling costs is mission-critical. With complex budgets, fluctuating material prices, and multiple stakeholders, it’s easy to lose track of expenses and efficiency. That’s where the Construction and Real Estate Cost Efficiency KPI Dashboard in Excel steps in—a smart, structured, and powerful tool designed to help you visualize, analyze, and optimize your cost performance with ease. 🧱💸
This ready-to-use Excel template offers a complete solution to monitor KPIs like Cost per Sq. Ft., Budget Utilization Rate, Project Margin, and more—all through automated dashboards and dynamic charts. Whether you’re a project manager, finance lead, or property developer, this tool gives you the clarity to make data-driven decisions.
🧰 Key Features of the Dashboard
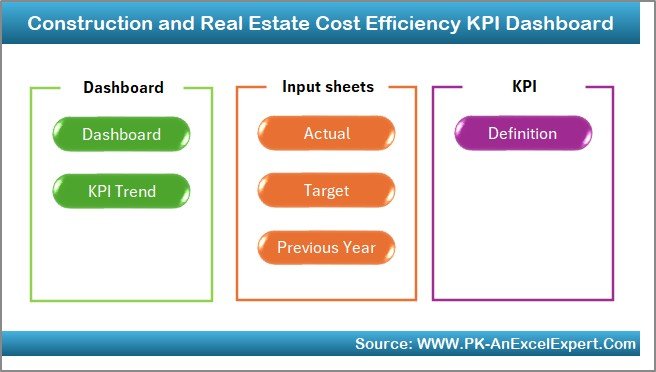
🏠 Home Sheet (Index Panel)
Navigate to any section using 6 interactive buttons
Saves time and enhances usability
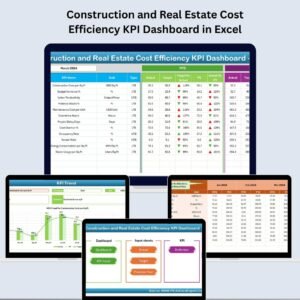
📊 Dashboard Sheet (One-Click Insights)
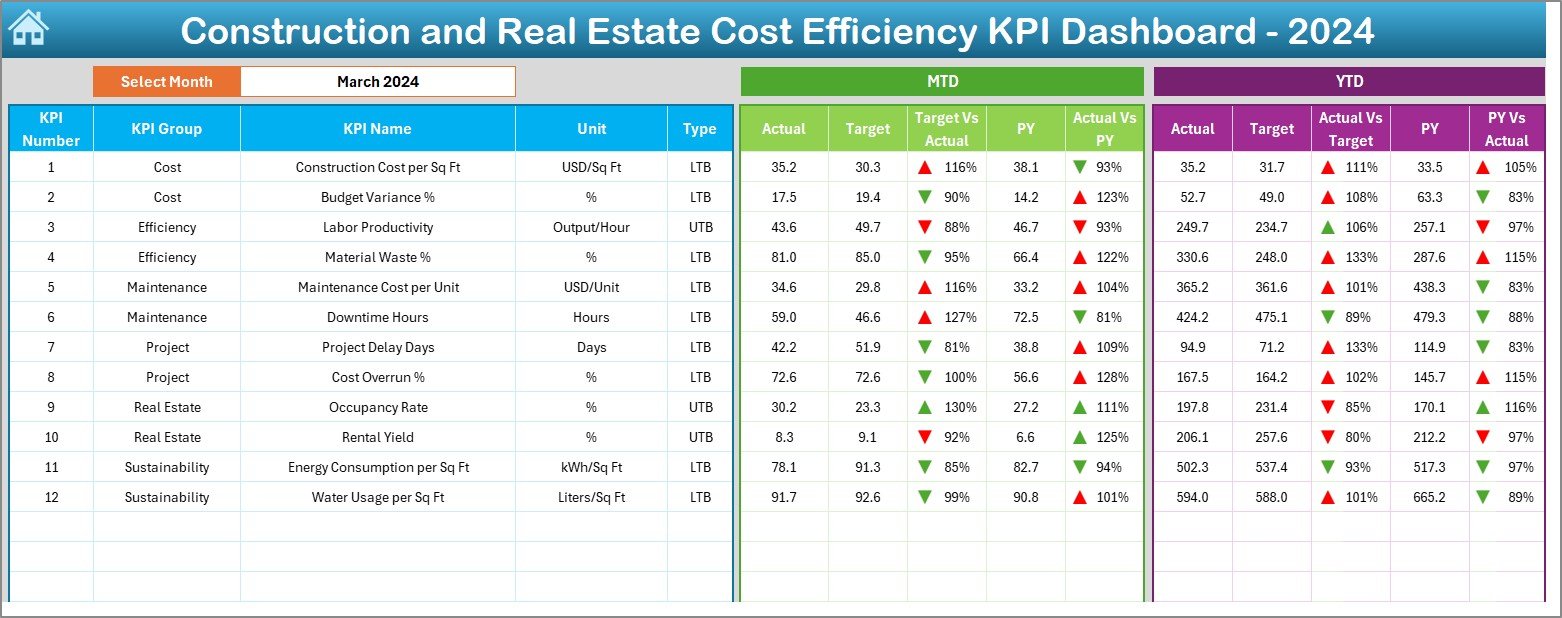
Select month in cell D3 to auto-update metrics
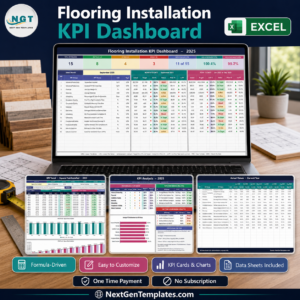
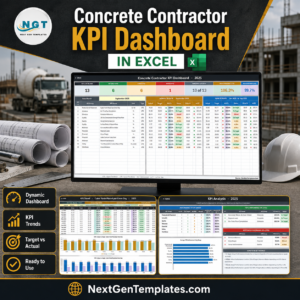
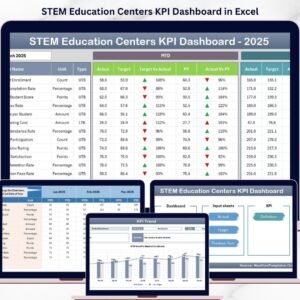
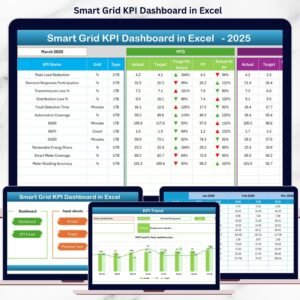
View MTD vs YTD, Actual vs Target, and Actual vs Previous Year
Performance indicators using up/down arrows and conditional formatting
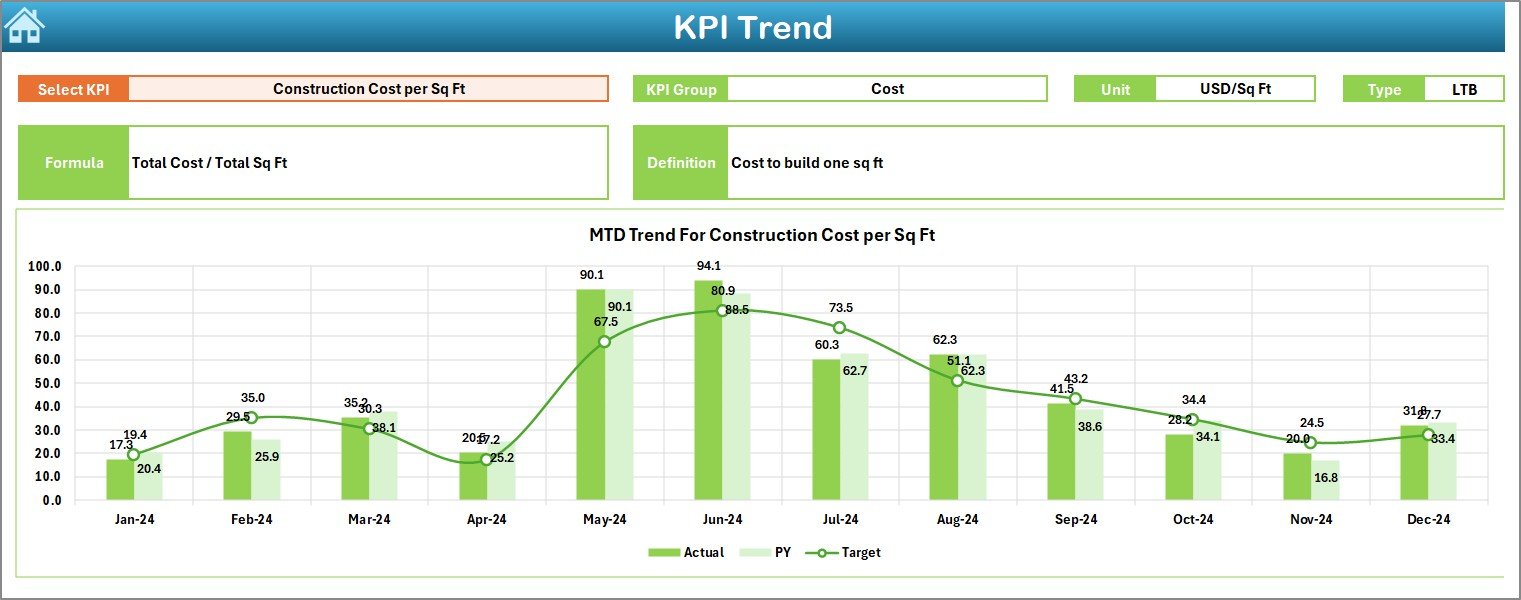
📈 KPI Trend Sheet (Visual Performance)
Pick a KPI from cell C3 dropdown
View trendlines for Actual, Target, and Previous Year
Definitions, formulas, and type (UTB/LTB) shown for context
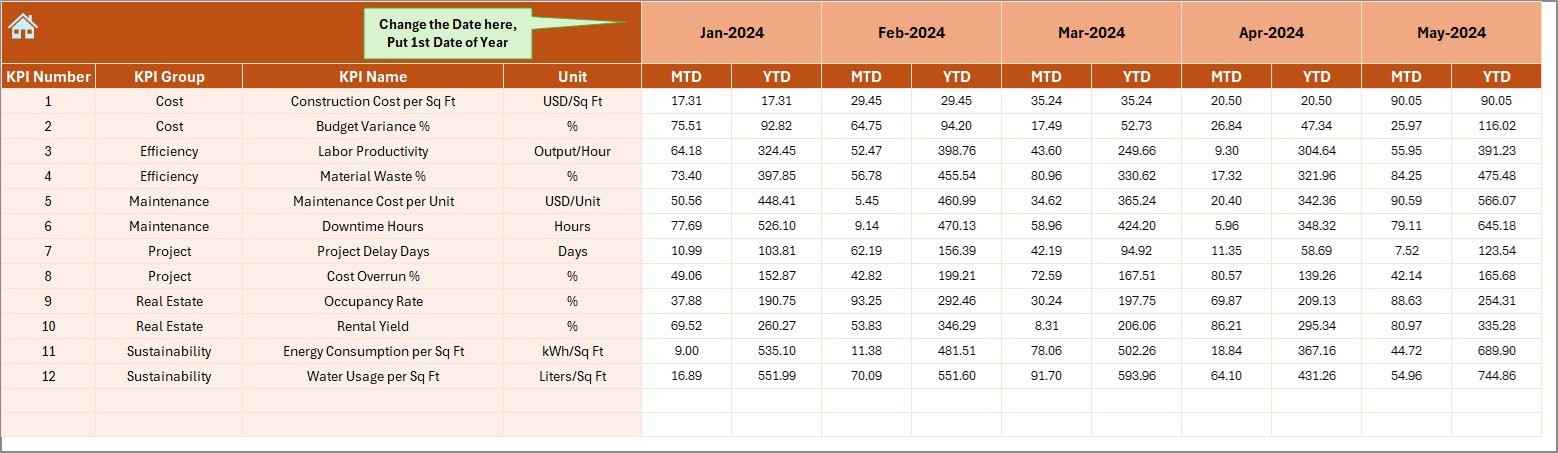
📥 Actual Numbers Input Sheet
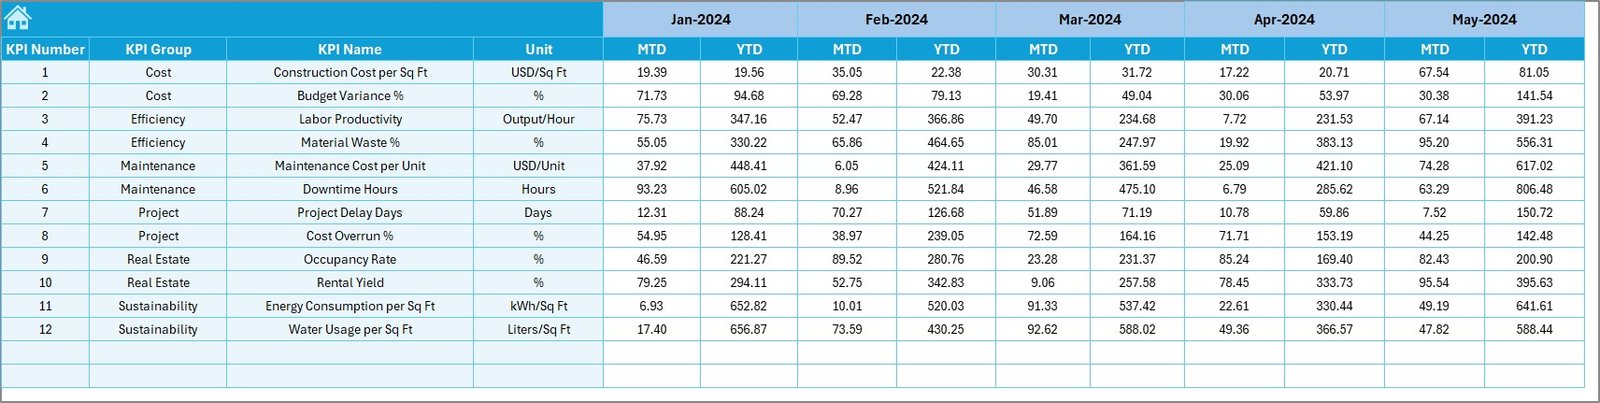
Enter Actual MTD and YTD per month
Control reporting period via cell E1
Clean layout ensures easy monthly data entry
🎯 Target Sheet
Set monthly performance targets for each KPI
Automatically reflected on Dashboard and Trend charts
Ideal for variance analysis
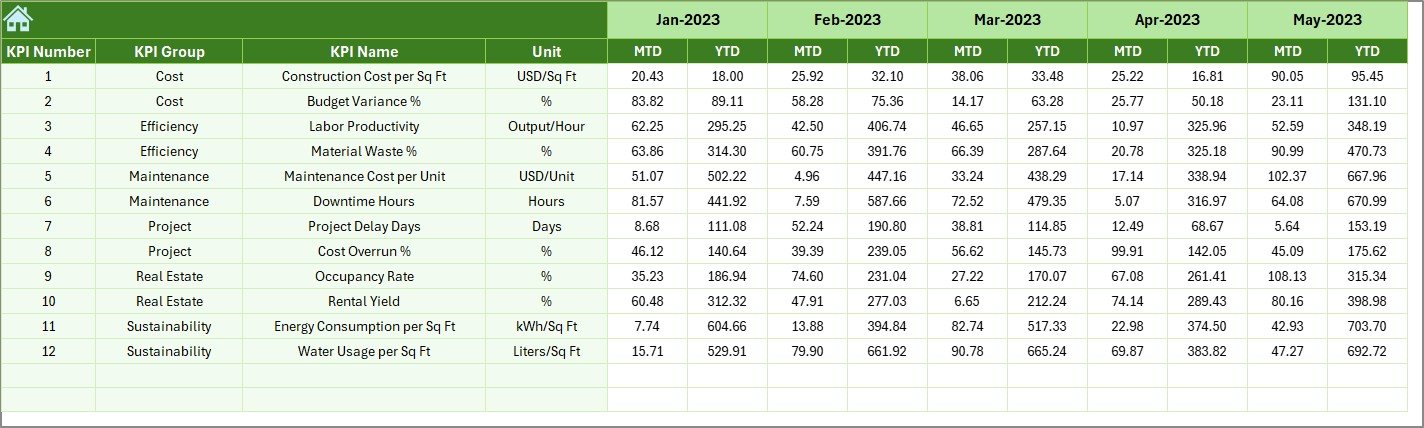
📆 Previous Year Sheet
Input past year’s KPI data for meaningful benchmarking
Enables trend comparison and historical accuracy
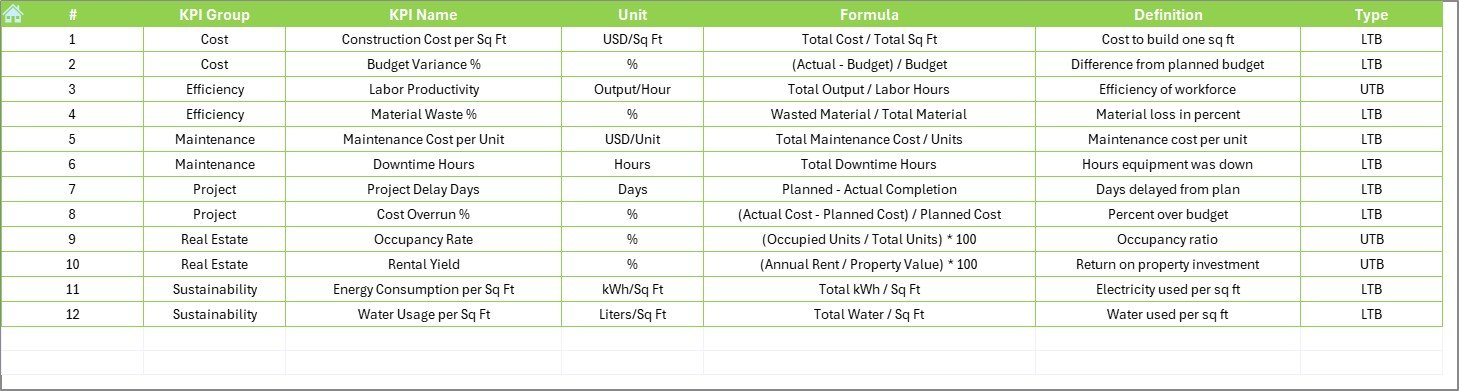
📘 KPI Definition Sheet
Maintain a centralized list of all KPIs
Includes KPI Name, Group, Formula, Unit, Type, and Definition
Supports easy customization and reference
🚧 Key KPIs You Can Track
✅ Cost per Square Foot
✅ Budget Utilization Rate
✅ Material Cost Variance
✅ Labor Cost Efficiency
✅ Overhead Percentage
✅ Project Profit Margin
✅ Equipment Utilization
✅ RFI Resolution Time
✅ Maintenance Cost Ratio
✅ Invoice Processing Time
These KPIs provide deep financial insights for proactive decision-making.
⚙️ How to Use the Dashboard
1️⃣ Set your start month in the Actual Input Sheet (cell E1)
2️⃣ Define KPIs in the KPI Definition Sheet
3️⃣ Enter Actual, Target, and Previous Year data monthly
4️⃣ Use the Dashboard Sheet (D3) to select the reporting month
5️⃣ Analyze trends using the KPI Trend Sheet
💡 No formulas required—everything updates automatically!
✅ Benefits of Using This Excel-Based Dashboard
💰 Real-Time Cost Control – Adjust plans by monitoring actual vs target
🧾 Better Forecasting – Use trend data for smarter budgeting
📉 Reduced Operational Waste – Identify inefficiencies instantly
👥 Cross-Functional Tool – Use across Finance, Procurement, and Projects
💻 No New Software – 100% Excel-based, no installations needed
📊 Fully Customizable – Add or remove KPIs as your business evolves
💼 Professional Reporting – Visual insights ideal for presentations and audits
📦 What’s Included in the Package?
📁 Excel Template with 7 Structured Sheets
🧭 Navigation Panel for Easy Access
📊 Dashboard with Conditional Formatting
📈 KPI Trend Visualization
📥 Actual, Target & Previous Year Input Sheets
📘 KPI Definition Table
🔁 Formula-Driven Dynamic Charts
👷 Who Should Use This Dashboard?
Construction Project Managers
Real Estate Finance Officers
Quantity Surveyors & Cost Engineers
Contractors and Builders
Property Developers and Consultants
🔗 Need Help?
Watch our full tutorial series on YouTube.com/@PKAnExcelExpert for step-by-step guidance.
🔗 Click here to read the Detailed blog post






Reviews
There are no reviews yet.