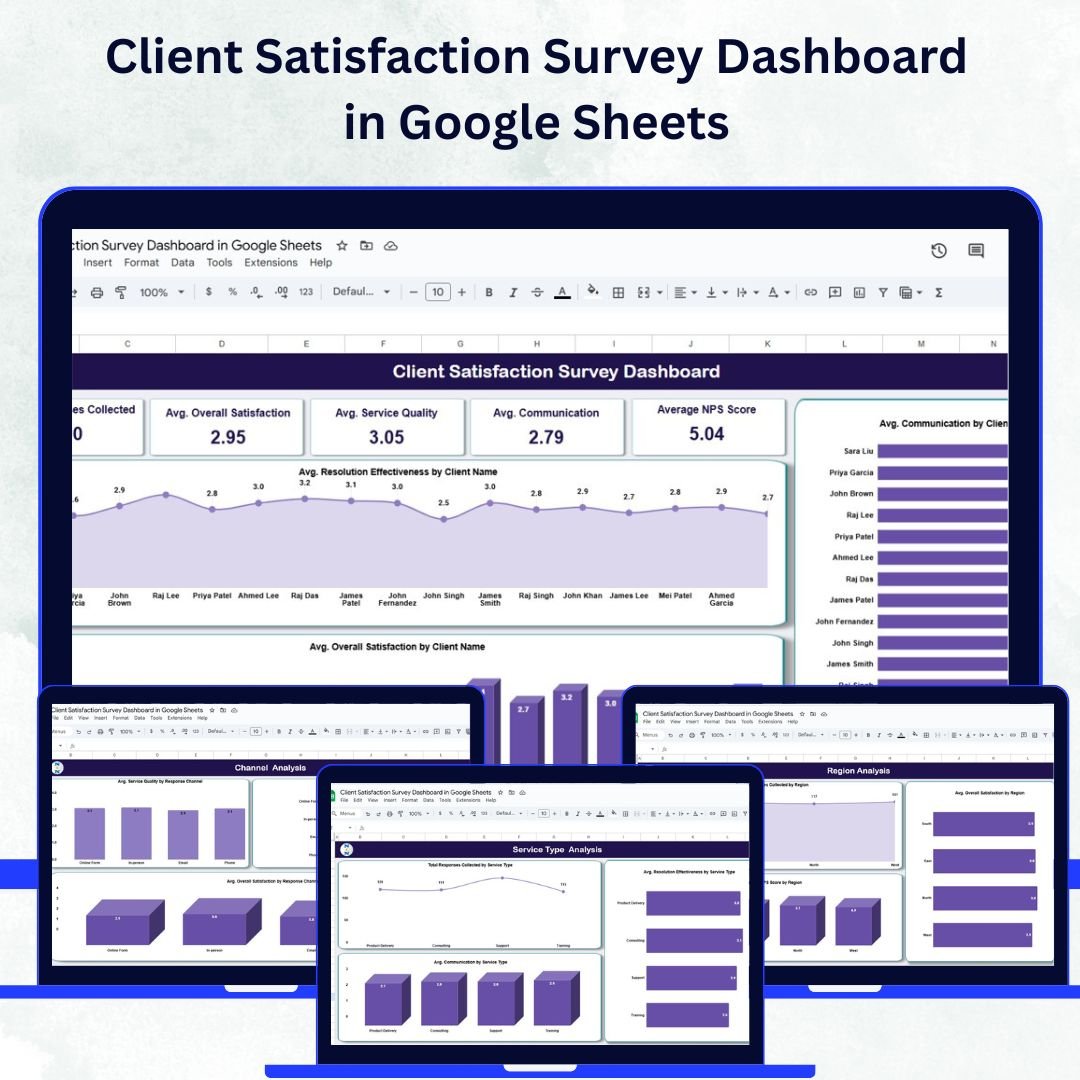
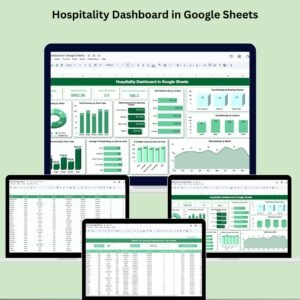
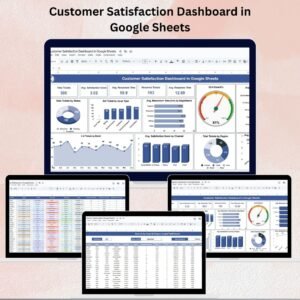
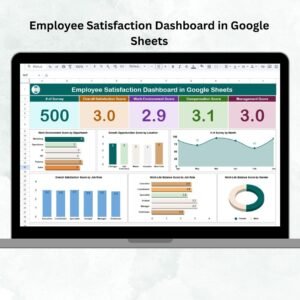
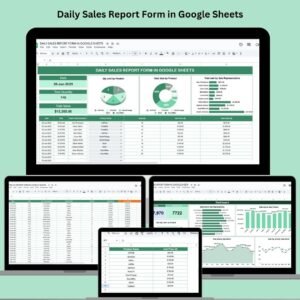
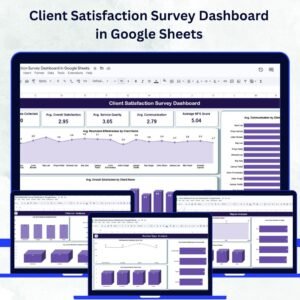
Client satisfaction is the foundation of long-term business success. To retain loyal clients and improve service delivery, organizations need a clear and data-driven understanding of customer feedback. The Client Satisfaction Survey Dashboard in Google Sheets is a ready-to-use, interactive tool that helps businesses track survey results, analyze satisfaction trends, and monitor performance metrics — all in one place.
Built in Google Sheets, this dashboard combines simplicity, collaboration, and automation to deliver real-time insights into how clients perceive your services. Whether you’re managing client feedback for a small agency or a large enterprise, this tool ensures you make smarter, faster, and more informed business decisions. 🚀
🔑 Key Features of the Client Satisfaction Survey Dashboard
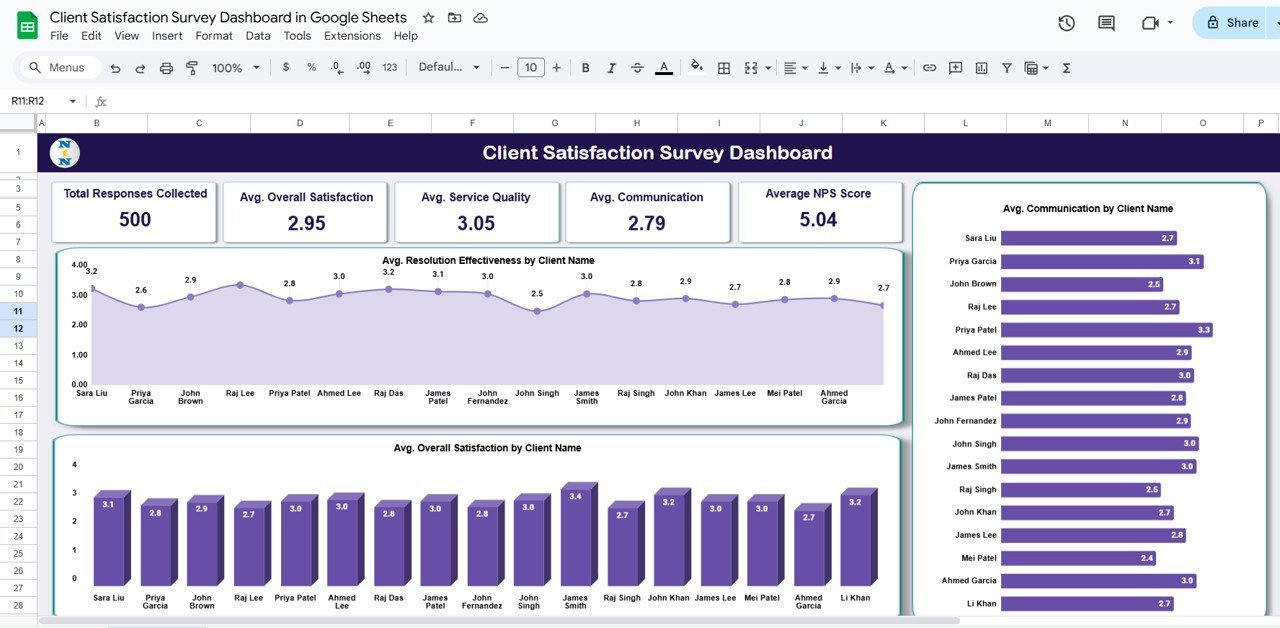
📋 Overview Sheet Tab
Gain a quick snapshot of your overall client satisfaction with metrics and visuals:
-
Total Responses Collected – Track how many clients have provided feedback
-
Avg. Overall Satisfaction – Measure the average rating across all clients
-
Avg. Service Quality & Communication – Evaluate service performance and relationship management
-
Average NPS Score – Understand client loyalty and likelihood to recommend your business
-
Charts visualize metrics such as:
-
Satisfaction by client name
-
Resolution effectiveness
-
Communication scores
-
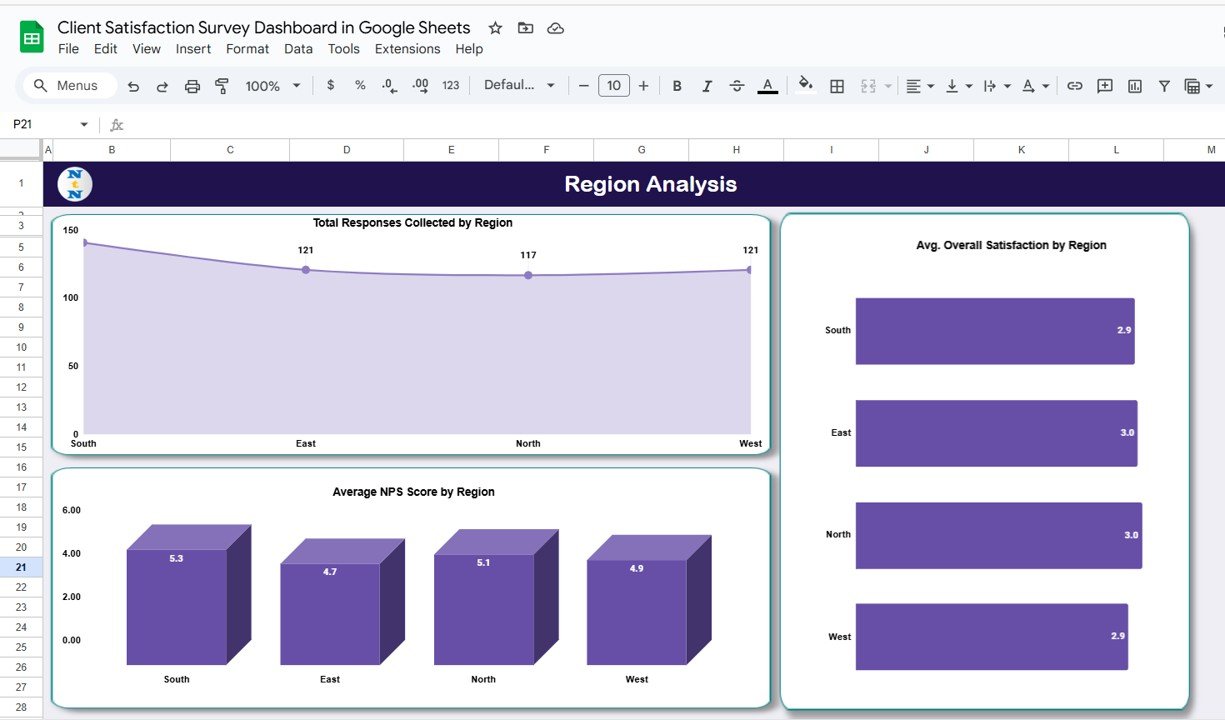
🌍 Region Analysis Sheet Tab
Monitor satisfaction trends across geographical regions:
-
Compare response volumes, average satisfaction, and NPS scores by region
-
Identify areas with higher satisfaction or those needing improvement
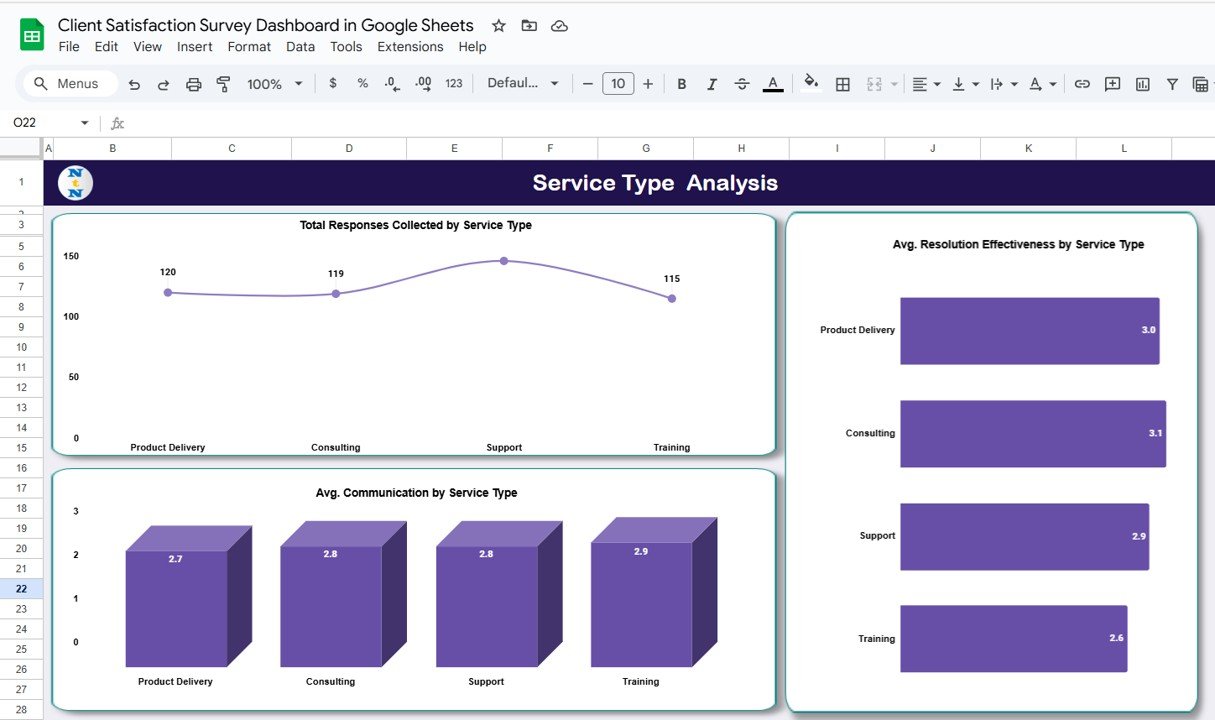
🧩 Service Type Analysis Sheet Tab
Evaluate feedback by service categories:
-
Track Total Responses and Service Quality by service type
-
Analyze Resolution Effectiveness and Communication for each category
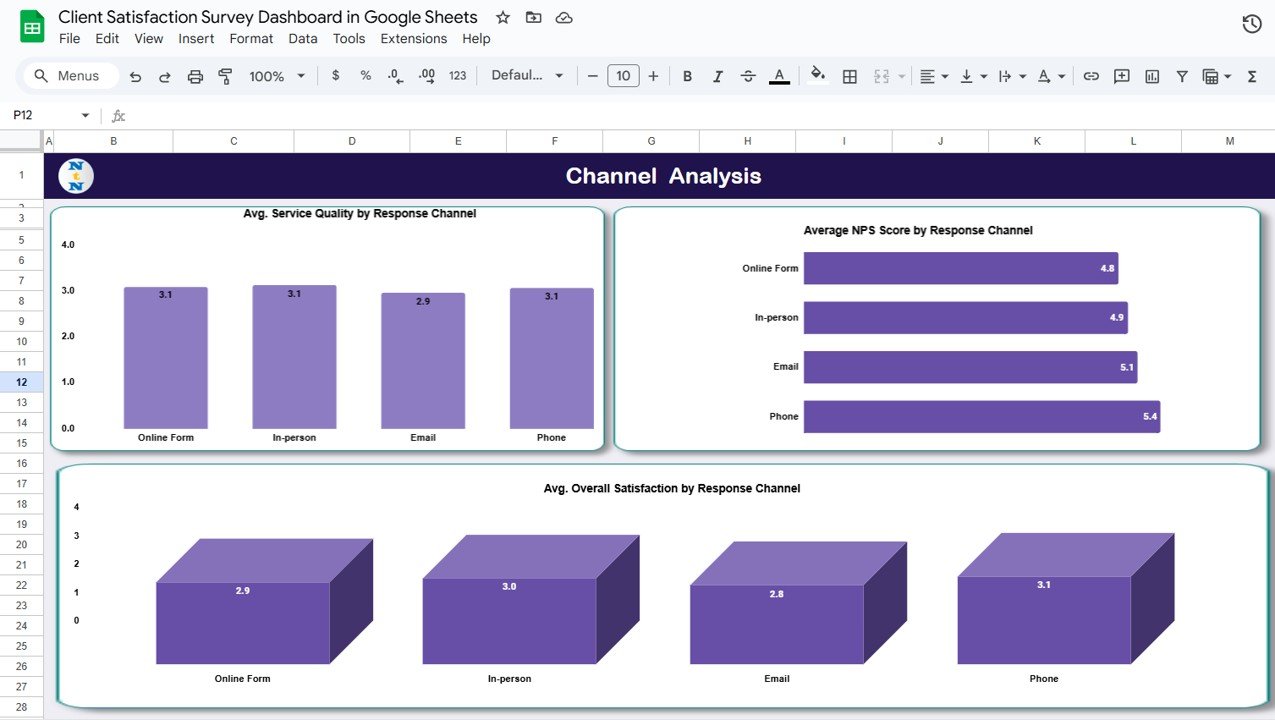
💬 Channel Analysis Sheet Tab
Determine how different communication channels impact satisfaction:
-
Visualize Service Quality, NPS, and Satisfaction by response channel (email, phone, chat, etc.)
-
Identify the most effective communication methods
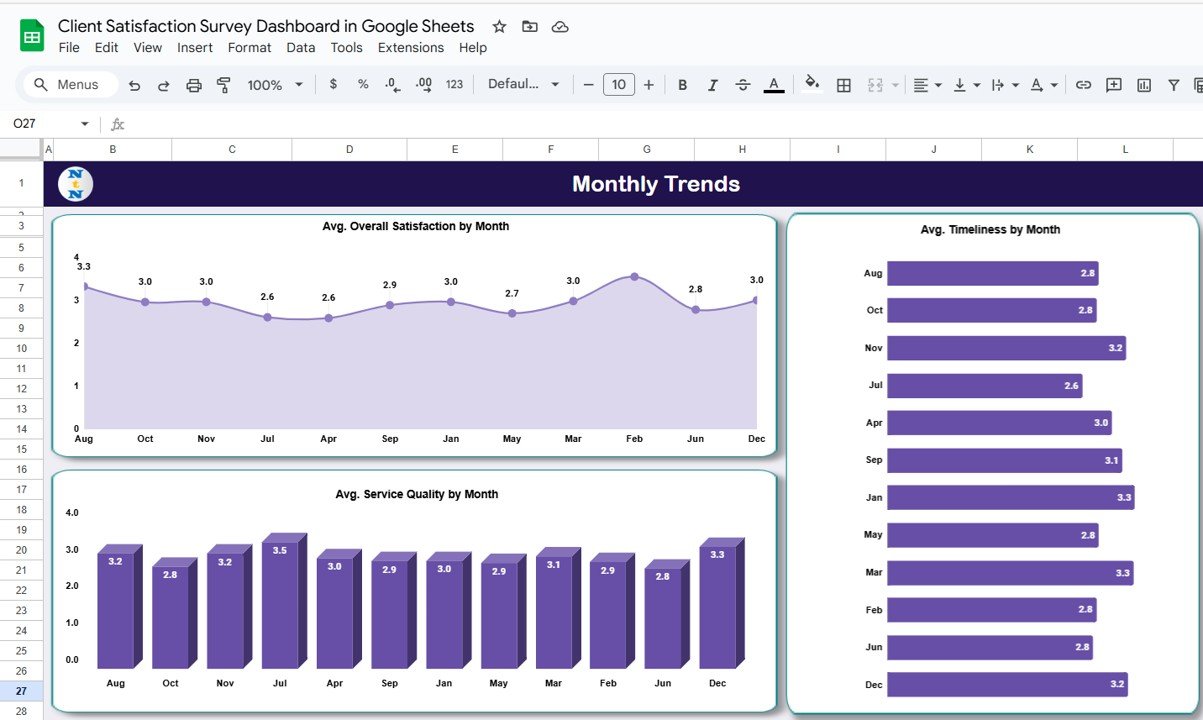
📅 Monthly Trends Sheet Tab
Keep an eye on how satisfaction evolves over time:
-
Monitor Overall Satisfaction, Service Quality, and Timeliness month by month
-
Detect seasonal performance changes or the impact of improvement initiatives
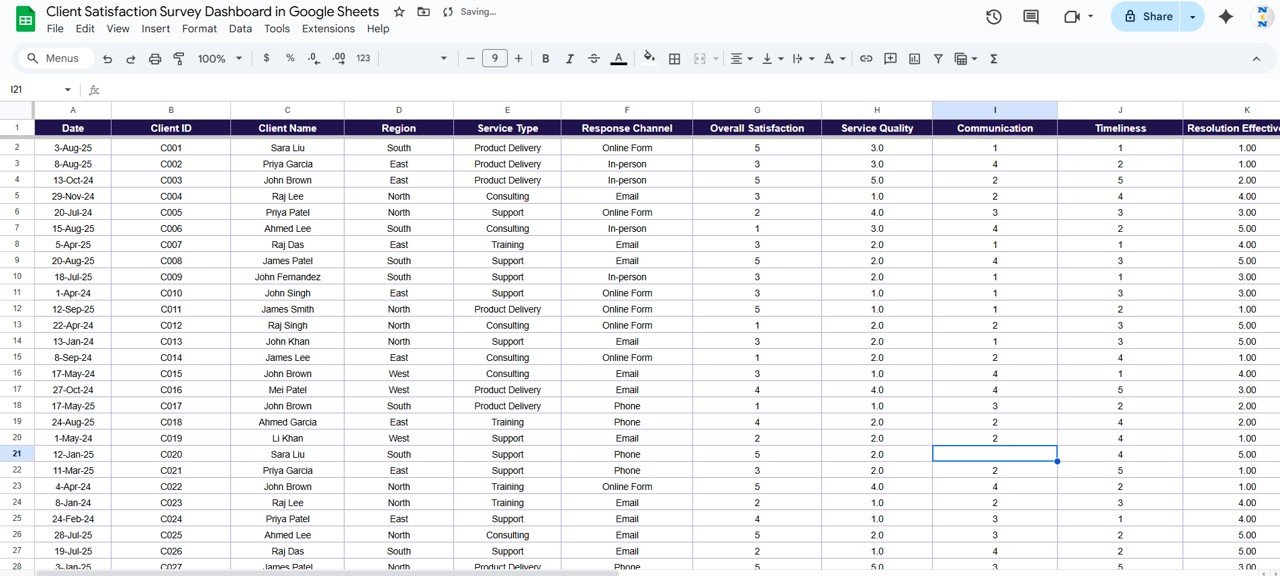
📑 Data & Search Sheet Tabs
-
Data Sheet: Central repository for all responses (client name, region, service type, channel, scores, and comments)
-
Search Sheet: Quick lookup feature to filter responses by keyword or field name
📦 What’s Inside the Dashboard?
✅ Pre-built Dashboard Sheets for each analysis type
✅ Search Functionality for fast record access
✅ Automated Charts linked to live data
✅ Sample Data for easy understanding
✅ Customizable Fields for your unique survey parameters
✅ Collaboration Ready via Google Sheets sharing
🧑💼 Who Can Benefit from This Dashboard?
🎯 Customer Success Teams – Track and respond to client satisfaction metrics
🎯 Account Managers – Monitor feedback by client or region for better engagement
🎯 Executives – Get a clear, visual overview of service performance and loyalty
🎯 Marketing & Operations Teams – Identify improvement areas and communication gaps
🎯 Consultants & Agencies – Present professional, data-driven reports to clients
🧪 How to Use the Client Satisfaction Survey Dashboard
-
Input Data: Add new survey responses in the Data Sheet.
-
Review Dashboard: Analyze satisfaction metrics, trends, and NPS on the Overview tab.
-
Segment Insights: Explore Region, Service Type, and Channel Analysis for targeted action.
-
Search Records: Quickly locate individual client feedback via the Search Sheet.
-
Monitor Monthly Trends: Track changes in satisfaction scores and service improvements.
This tool is plug-and-play, requiring no coding — simply input your survey results and watch the dashboard update automatically. ⚡
🌟 Why Choose This Dashboard?
-
📊 Centralized Insights: All satisfaction metrics in one place
-
🔄 Real-Time Updates: Dashboards refresh automatically as new data is added
-
🌍 Multi-Dimensional Analysis: By region, service, and channel
-
💬 Action-Oriented Insights: Focus on NPS, communication, and service quality
-
🧠 Data-Driven Decisions: Empower leadership with clear visual analytics
-
🧩 Customizable Design: Adapt to your survey format and business needs
-
🚀 Google Sheets Advantage: Cloud-based collaboration and accessibility
With the Client Satisfaction Survey Dashboard in Google Sheets, you can transform feedback into strategy, retain more clients, and elevate service excellence. 🌟
🔗 Click here to read the Detailed blog post
Watch the step-by-step video Demo:


Reviews
There are no reviews yet.