


 Key Features:
 Real-time Dashboard – Track MTD/YTD performance instantly
Are you serious about reducing waste, optimizing resources, and promoting sustainability in your business? The Circular Economy KPI Dashboard in Google Sheets is your all-in-one solution for tracking environmental impact with real-time clarity. This ready-to-use dashboard empowers you to monitor key sustainability metrics and make data-driven decisions to accelerate your circular economy goals. Whether you’re a green startup or a large enterprise with ESG targets, this tool will help you transform your strategy into measurable impact!
 Key Features of the Circular Economy KPI Dashboard
 Interactive Dashboard Sheet
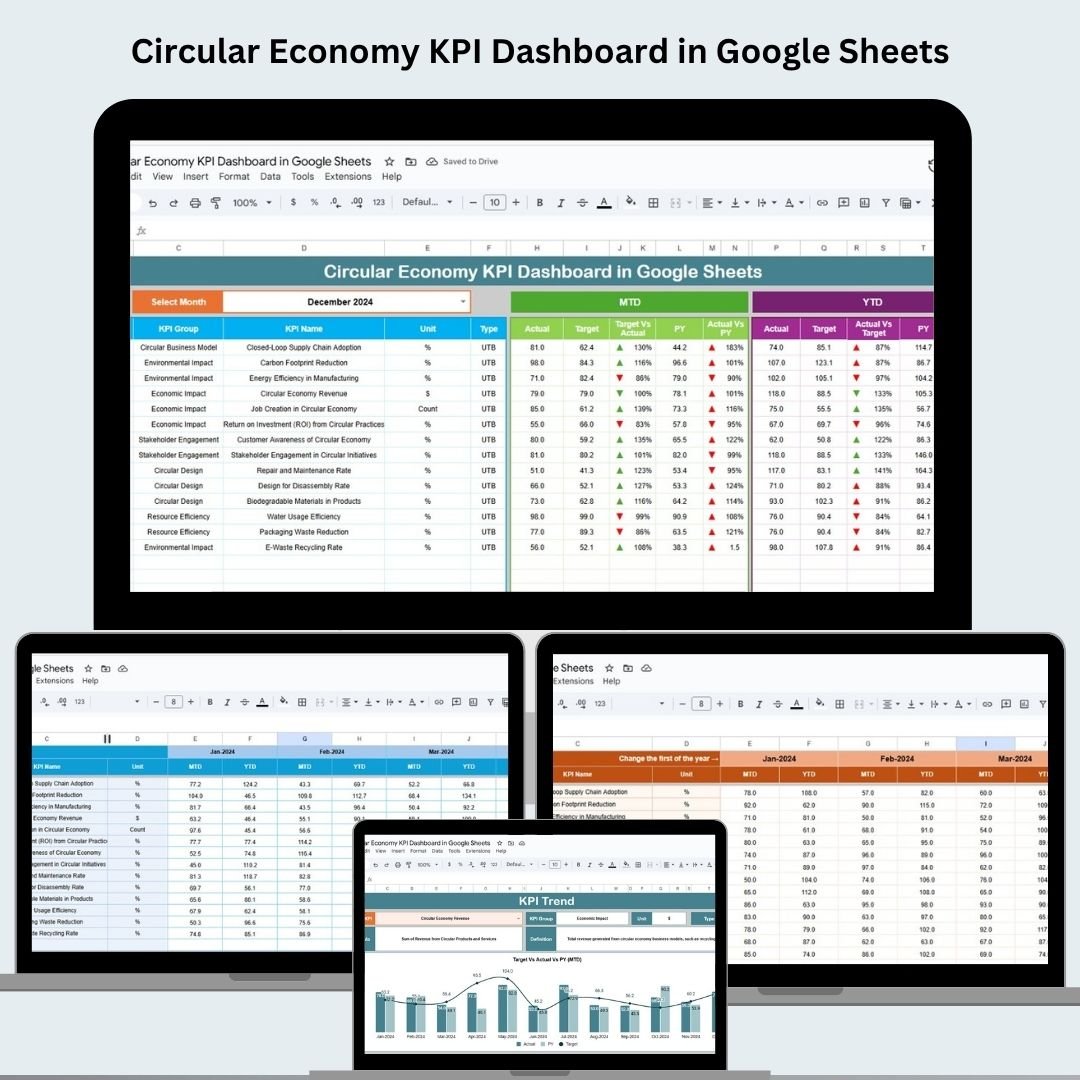
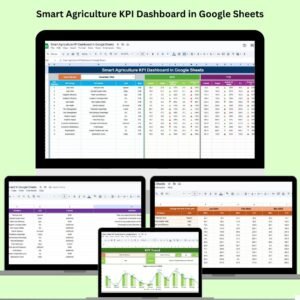
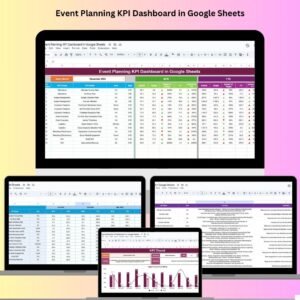
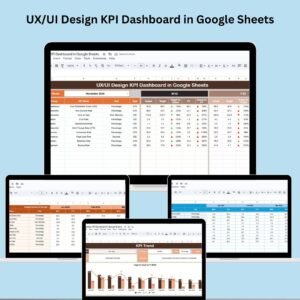
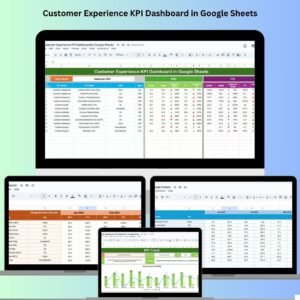
See the big picture at a glance! The Dashboard sheet showcases:
-
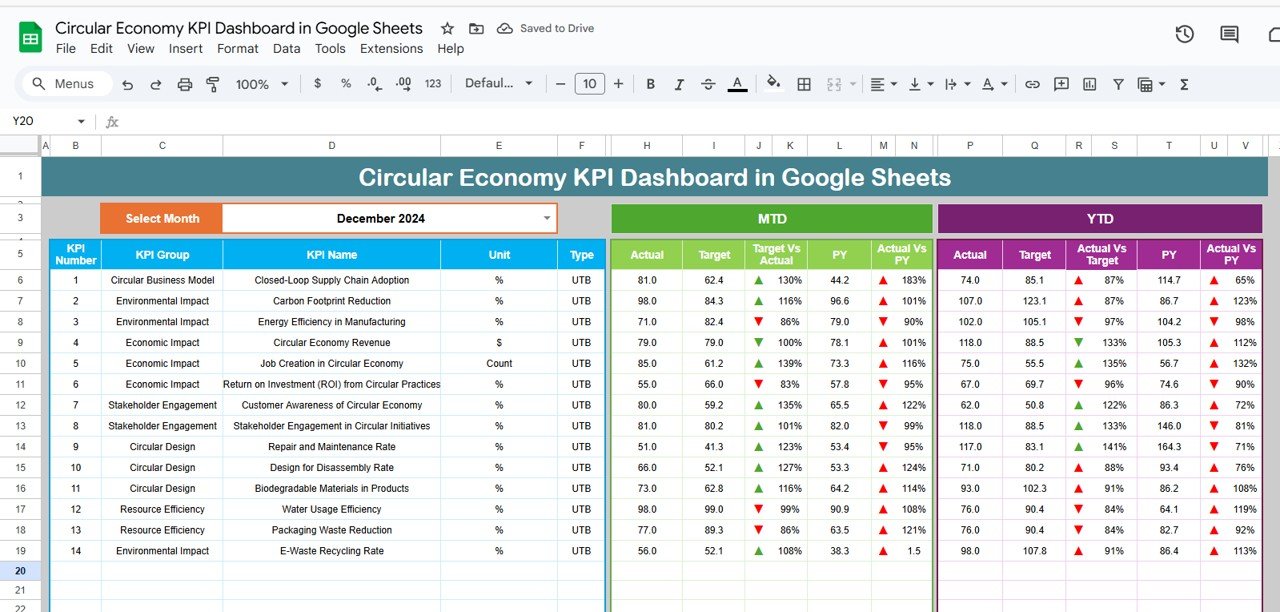
 Month-to-Date (MTD) & Year-to-Date (YTD) performance
 -
 Target vs Actual metrics to track your sustainability goals
 -
 Previous Year vs Current Data for long-term insights
 -
 Dynamic Month Selector to filter performance data with ease
 Conditional formatting (with
  & arrows) gives instant visual cues on how you’re doing.
 What’s Inside the Circular Economy KPI Dashboard
The dashboard is packed with six specialized sheets to keep your green initiatives on track:
-
Dashboard Tab – The master overview with all key stats and KPIs
-
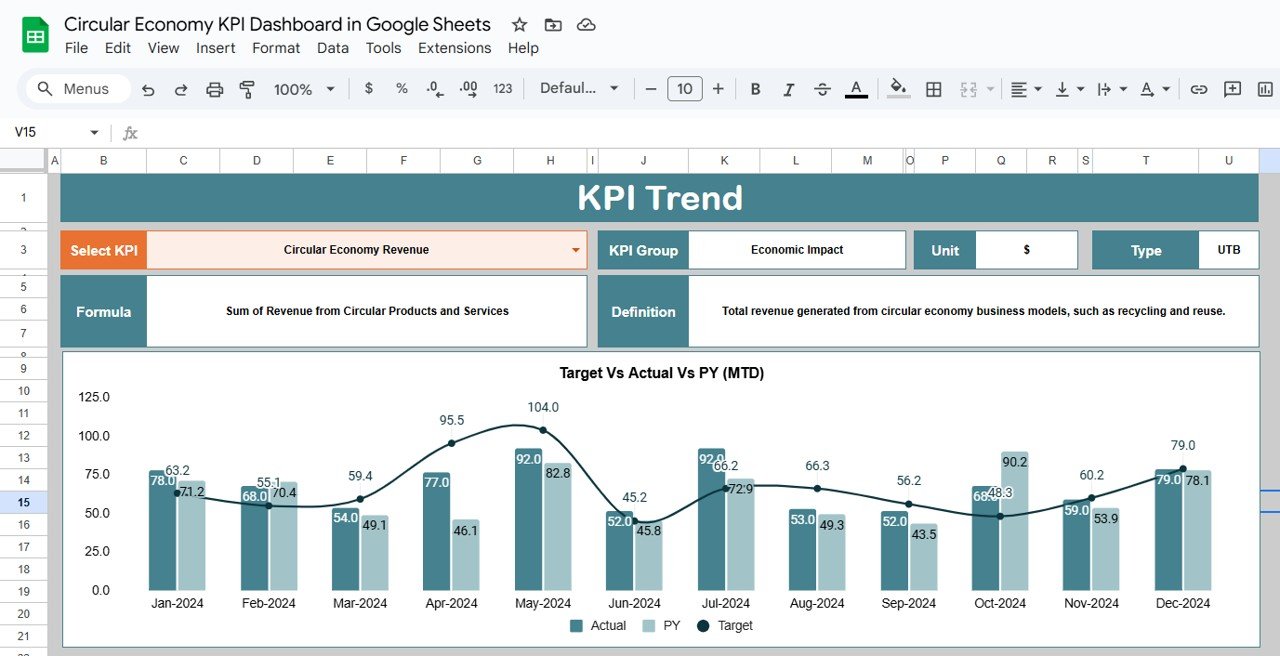
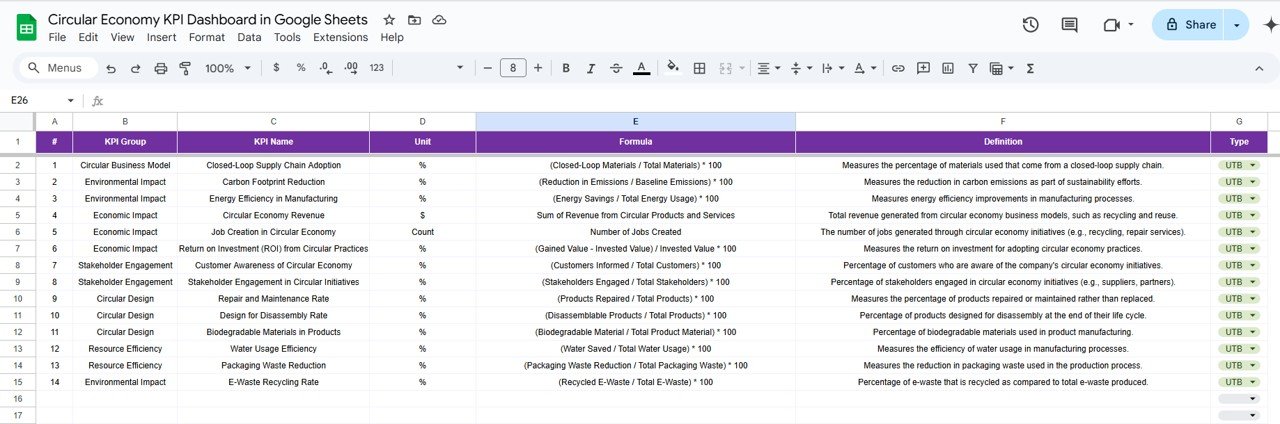
KPI Trend Sheet – Deep dive into each metric: category, unit, formula, and KPI type (UTB or LTB)
-
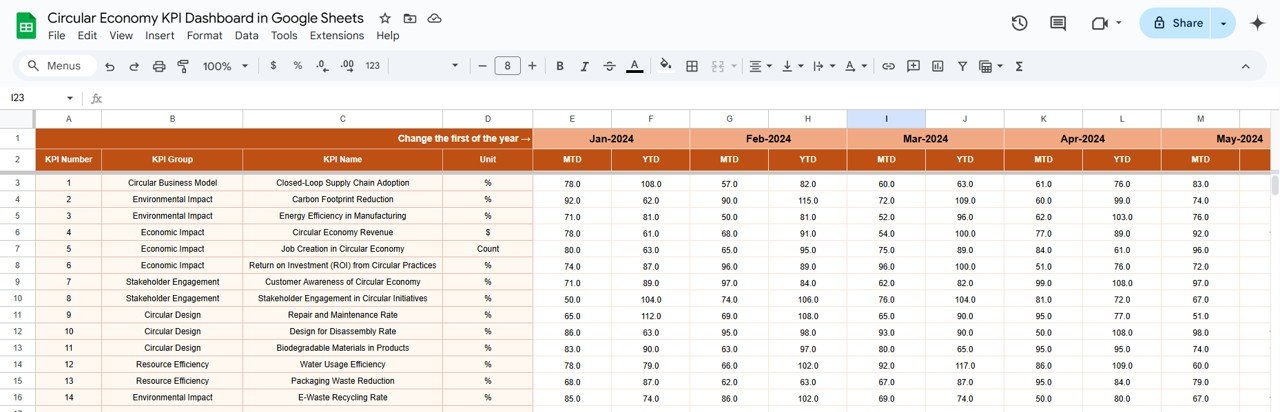
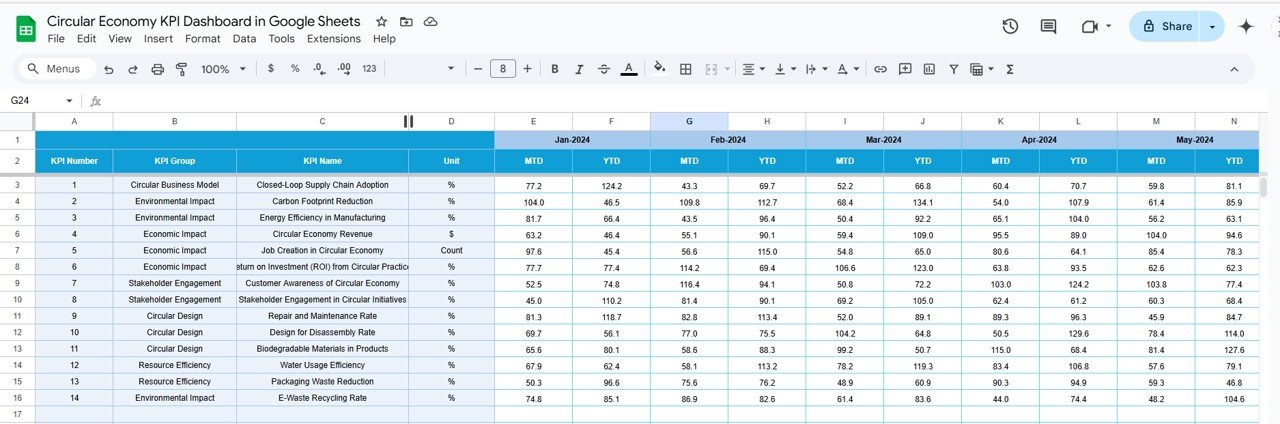
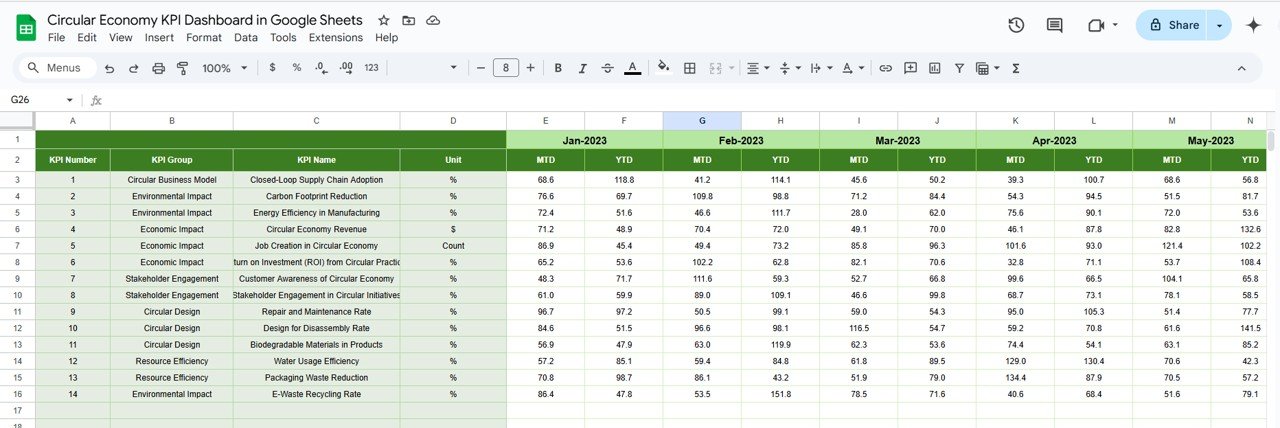
Actual Numbers Sheet – Input real performance values (MTD/YTD) by month
-
Target Sheet – Set benchmark goals for all sustainability KPIs
-
Previous Year Numbers Sheet – Input past year’s performance for trend comparison
-
KPI Definition Sheet – Full breakdown of each KPI’s meaning, calculation, and importance
It’s not just data—it’s actionable insight
 How to Use the Circular Economy KPI Dashboard
-
 Input your actual data monthly in the “Actual Numbers Sheet”
 -
Enter your sustainability targets in the “Target Sheet”
-
 Watch the “Dashboard” auto-update with real-time performance
 -
 Use the “KPI Trend” sheet to evaluate what’s working—and what’s not
 -
Compare with the “Previous Year” to identify growth or gaps
-
 Customize KPI formulas or names based on your industry or ESG goals
No tech skills needed—if you can use Google Sheets, you can use this dashboard! 
 Who Can Benefit from This Dashboard?
This Google Sheets template is ideal for:
 Sustainability Managers – Track impact and report with confidence
 Operations Heads – Optimize waste and energy across supply chains ESG Teams – Measure key performance against compliance metrics
 Business Executives – Make board-level decisions based on real KPIs
 Educational Institutions & NGOs – Showcase green project outcomes
 Retail & E-commerce Brands – Improve circular packaging, recycling rates, etc.
If you’re focused on sustainability—this dashboard is built for you.
 Why Businesses Love This Tool
 Real-Time Sustainability Insights
 All KPIs in One Place Compare Past vs Present Performance
 Fully Customizable
 Mobile-Friendly & Google Drive Ready
 Easy to Share with Teams or Clients
 Makes ESG reporting easier, smarter, faster
 Click here to read the Detailed blog post
Watch the step-by-step video Demo:
 Visit our


Reviews
There are no reviews yet.