Are you serious about reducing waste, optimizing resources, and promoting sustainability in your business? The Circular Economy KPI Dashboard in Google Sheets is your all-in-one solution for tracking environmental impact with real-time clarity. This ready-to-use dashboard empowers you to monitor key sustainability metrics and make data-driven decisions to accelerate your circular economy goals. Whether you’re a green startup or a large enterprise with ESG targets, this tool will help you transform your strategy into measurable impact!
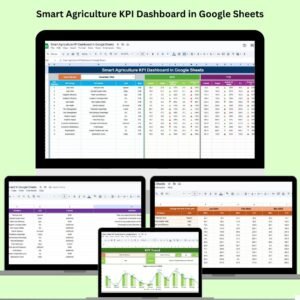
♻️ Key Features of the Circular Economy KPI Dashboard
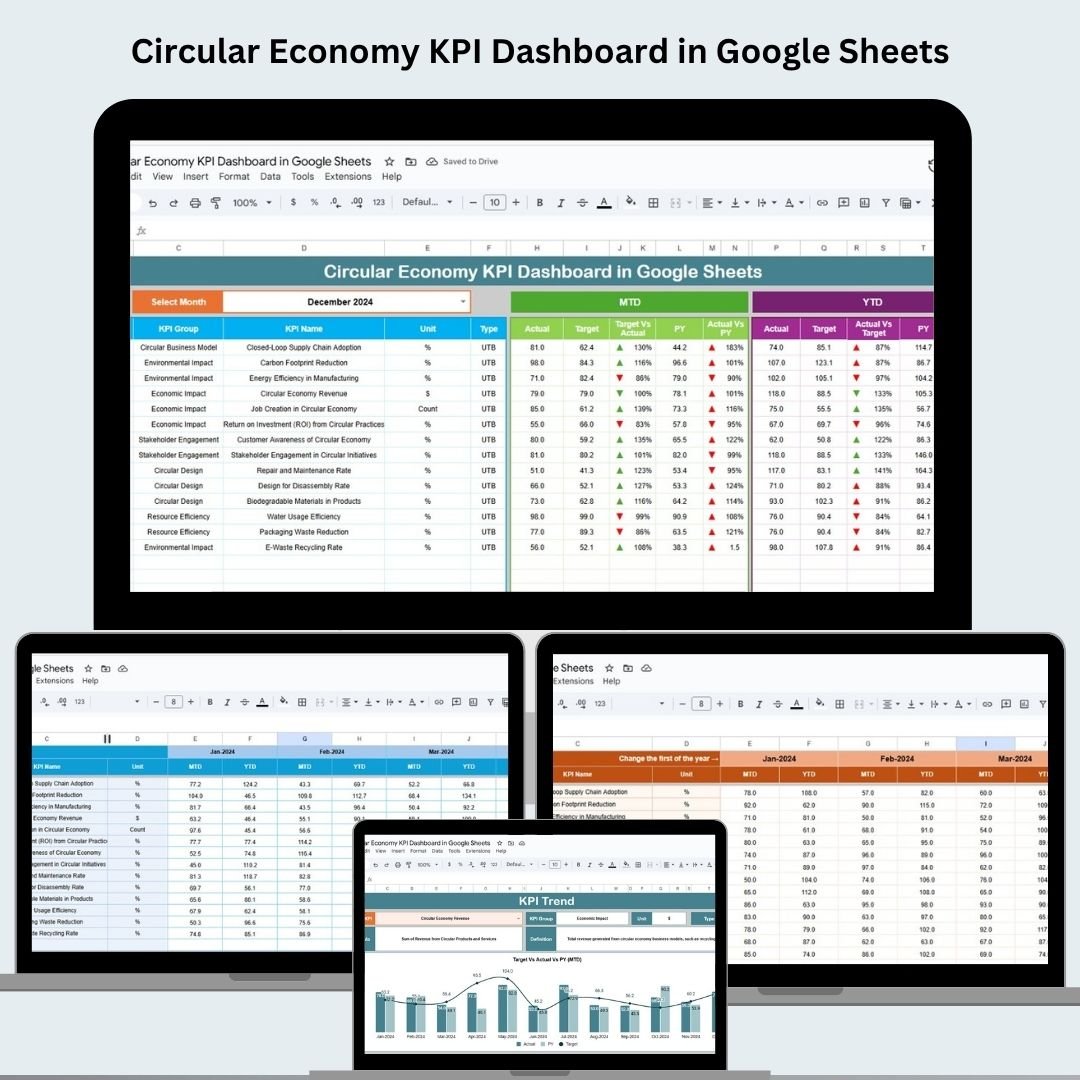
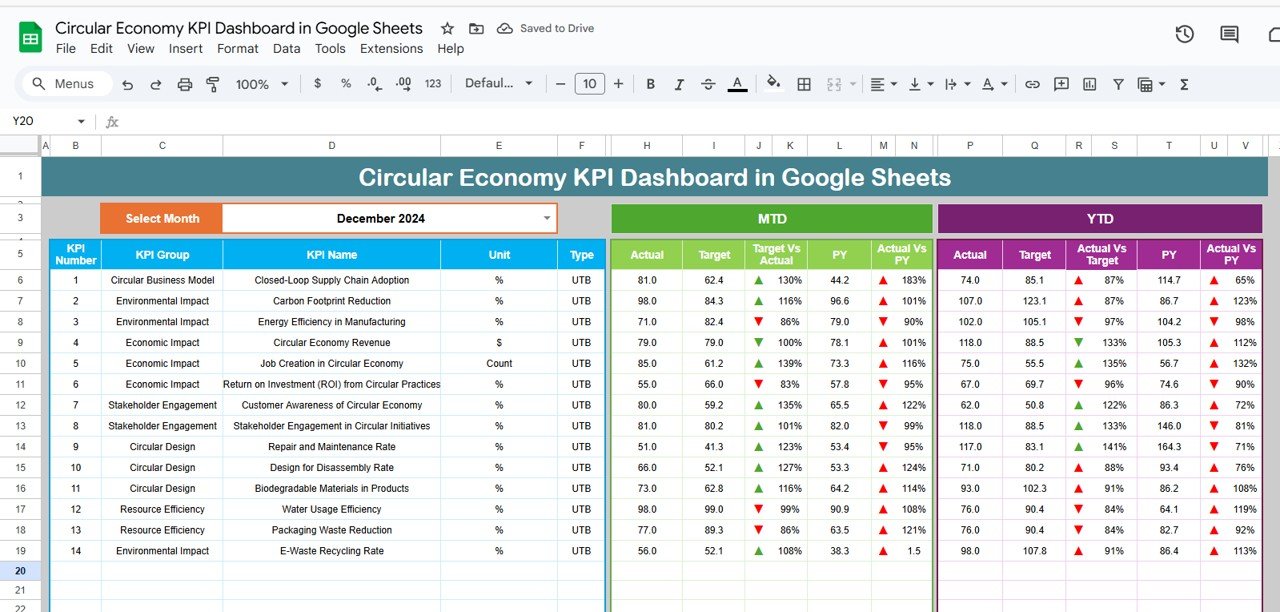
✅ Interactive Dashboard Sheet
See the big picture at a glance! The Dashboard sheet showcases:
-
📅 Month-to-Date (MTD) & Year-to-Date (YTD) performance
-
🎯 Target vs Actual metrics to track your sustainability goals
-
📈 Previous Year vs Current Data for long-term insights
-
🔽 Dynamic Month Selector to filter performance data with ease
💡 Conditional formatting (with 📉 & 📈 arrows) gives instant visual cues on how you’re doing.
📦 What’s Inside the Circular Economy KPI Dashboard
The dashboard is packed with six specialized sheets to keep your green initiatives on track:
-
Dashboard Tab – The master overview with all key stats and KPIs
-
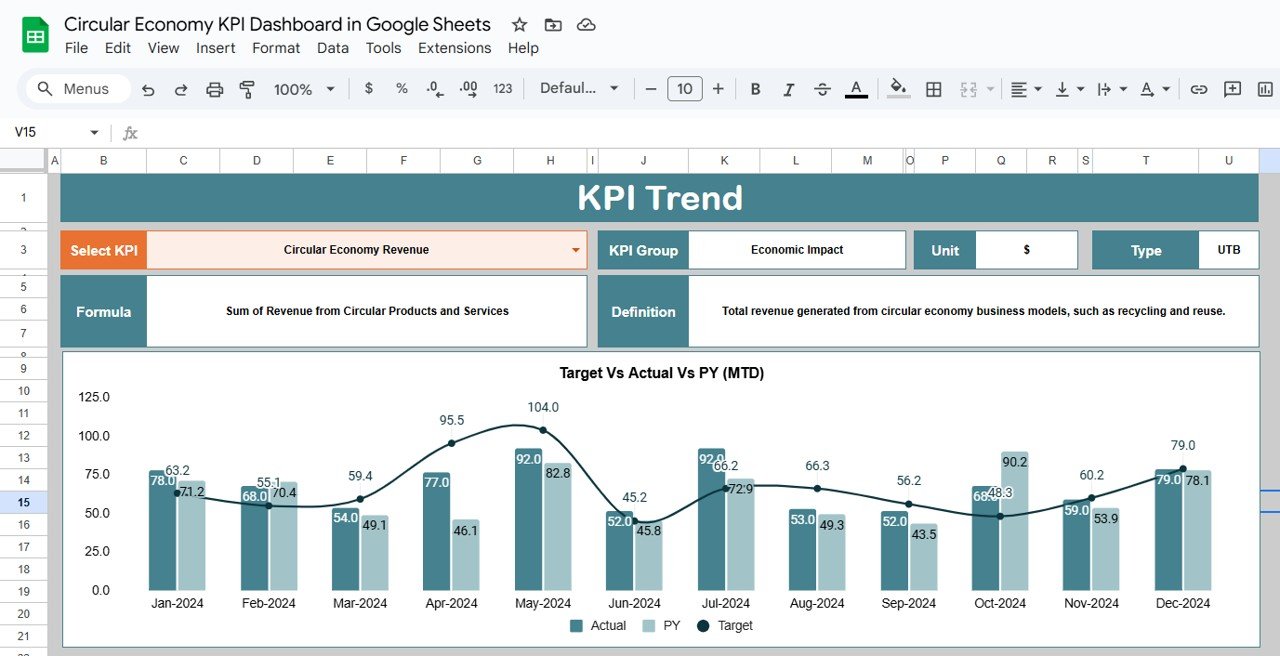
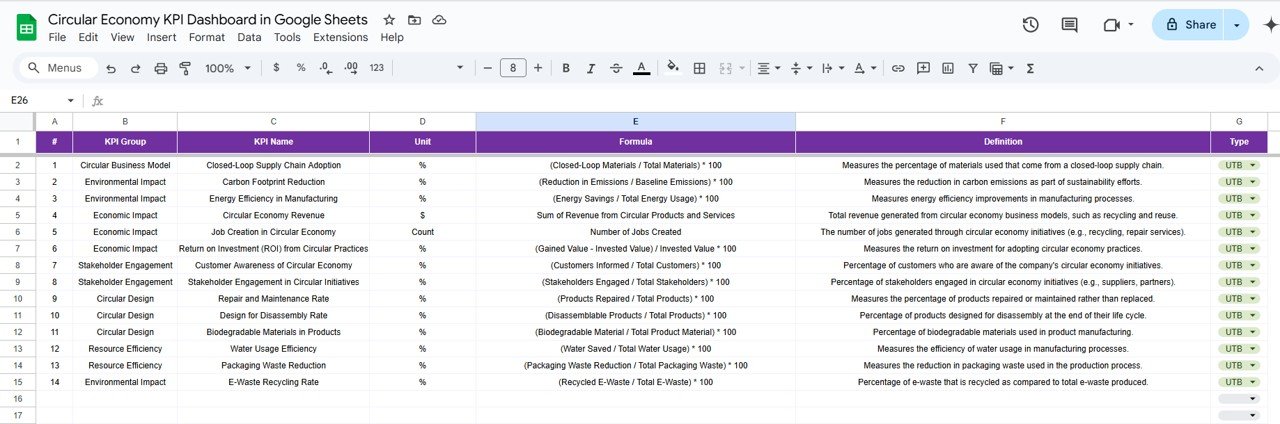
KPI Trend Sheet – Deep dive into each metric: category, unit, formula, and KPI type (UTB or LTB)
-
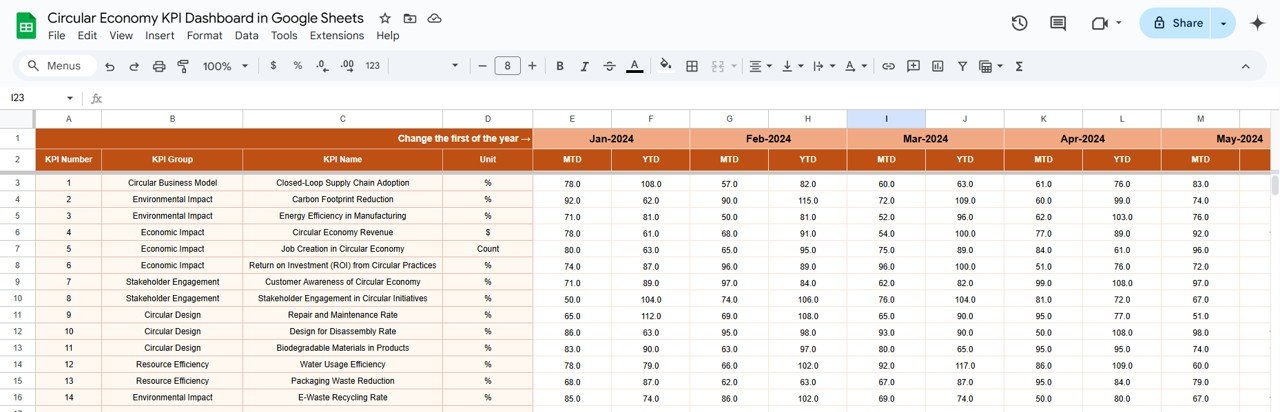
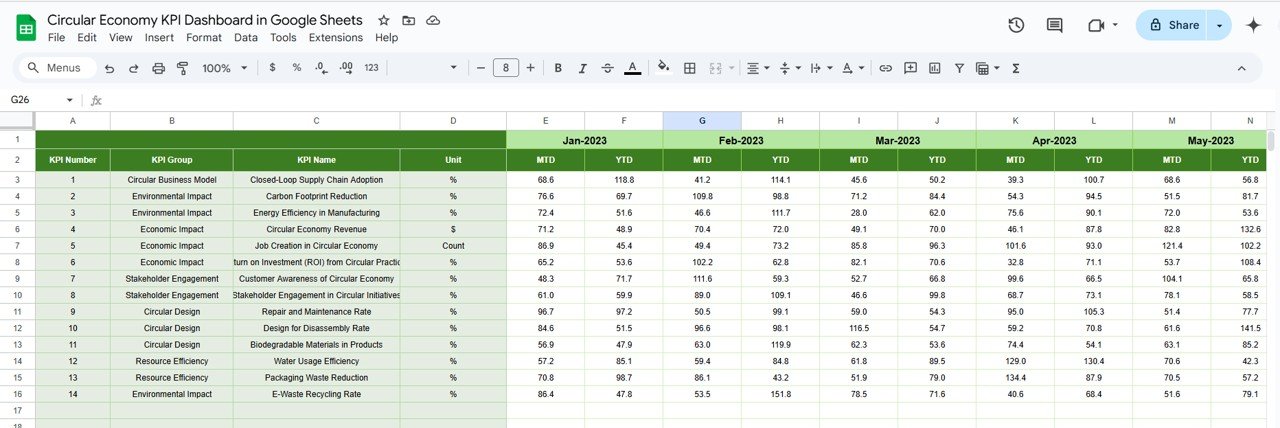
Actual Numbers Sheet – Input real performance values (MTD/YTD) by month
-
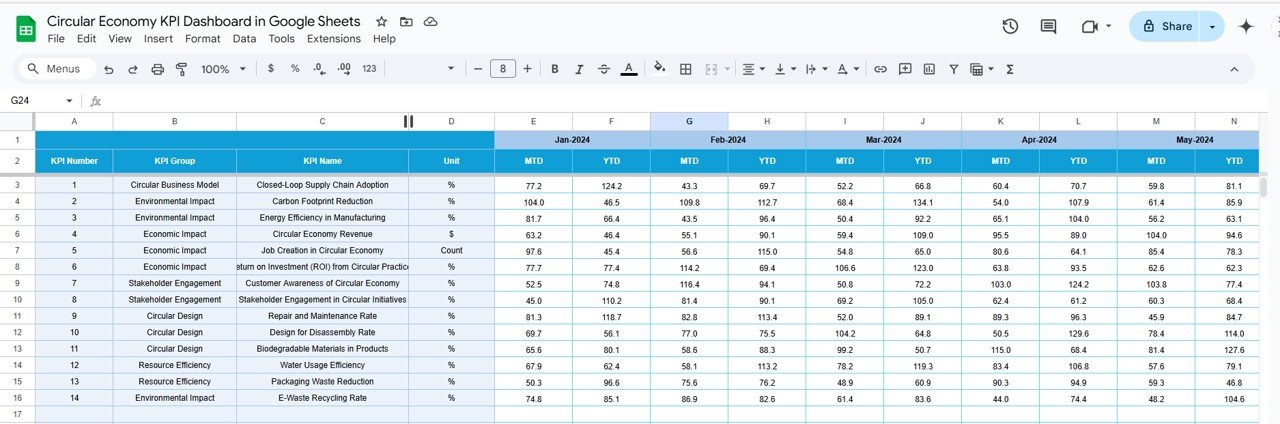
Target Sheet – Set benchmark goals for all sustainability KPIs
-
Previous Year Numbers Sheet – Input past year’s performance for trend comparison
-
KPI Definition Sheet – Full breakdown of each KPI’s meaning, calculation, and importance
It’s not just data—it’s actionable insight 💡
🛠️ How to Use the Circular Economy KPI Dashboard
-
📥 Input your actual data monthly in the “Actual Numbers Sheet”
-
🎯 Enter your sustainability targets in the “Target Sheet”
-
📊 Watch the “Dashboard” auto-update with real-time performance
-
🔄 Use the “KPI Trend” sheet to evaluate what’s working—and what’s not
-
📉 Compare with the “Previous Year” to identify growth or gaps
-
✏️ Customize KPI formulas or names based on your industry or ESG goals
No tech skills needed—if you can use Google Sheets, you can use this dashboard! 🙌
👥 Who Can Benefit from This Dashboard?
This Google Sheets template is ideal for:
🌿 Sustainability Managers – Track impact and report with confidence
🏭 Operations Heads – Optimize waste and energy across supply chains
📊 ESG Teams – Measure key performance against compliance metrics
🏢 Business Executives – Make board-level decisions based on real KPIs
🏫 Educational Institutions & NGOs – Showcase green project outcomes
🛒 Retail & E-commerce Brands – Improve circular packaging, recycling rates, etc.
If you’re focused on sustainability—this dashboard is built for you.
🔥 Why Businesses Love This Tool
🚀 Real-Time Sustainability Insights
📍 All KPIs in One Place
📈 Compare Past vs Present Performance
🔧 Fully Customizable
📱 Mobile-Friendly & Google Drive Ready
📤 Easy to Share with Teams or Clients
🧠 Makes ESG reporting easier, smarter, faster
📘 Click here to read the Detailed blog post
Watch the step-by-step video Demo:


Reviews
There are no reviews yet.