

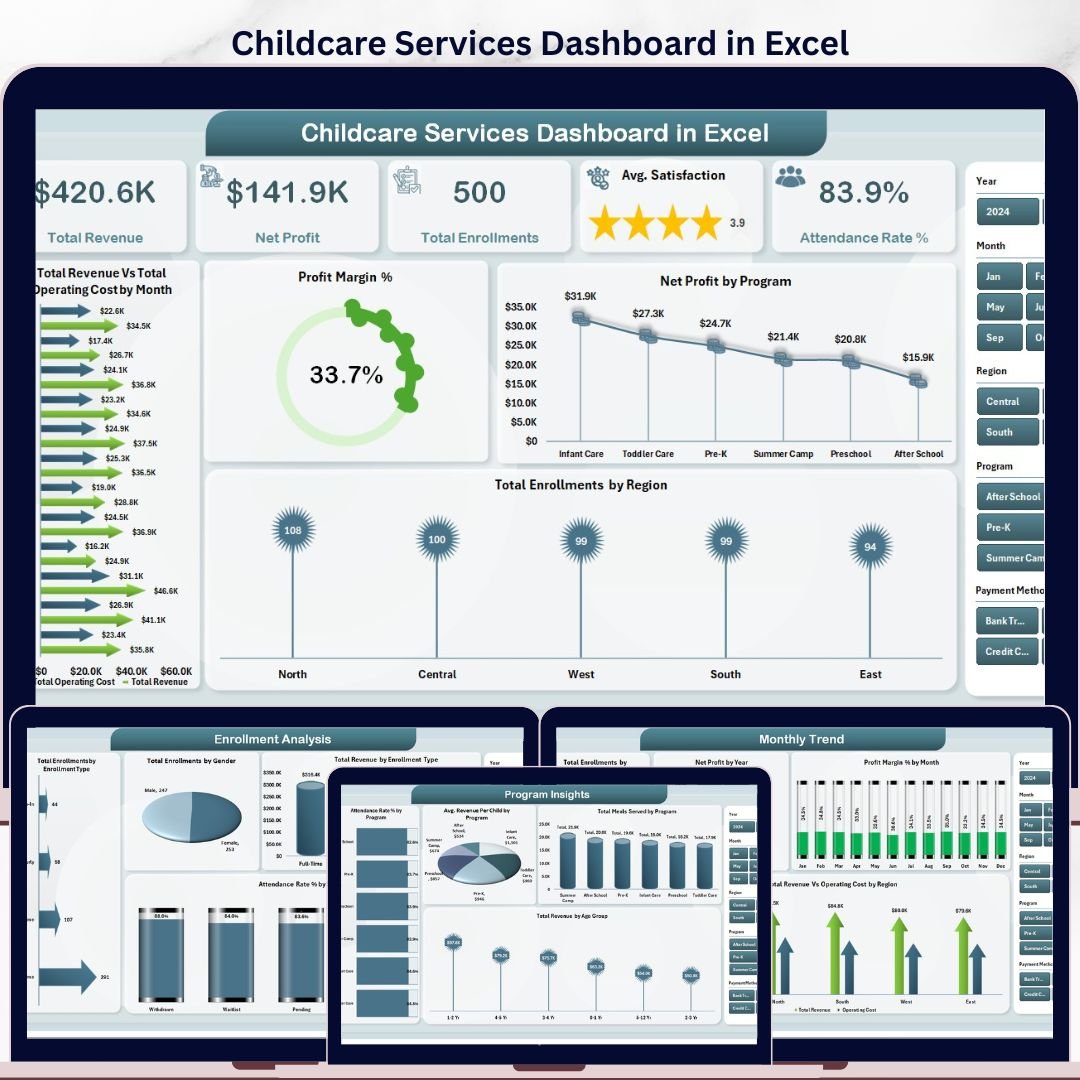



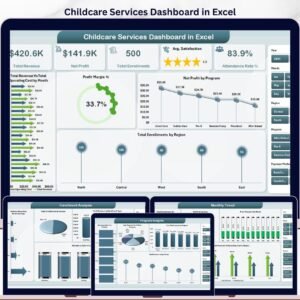
The Childcare Services Dashboard in Excel tracks 5 KPI cards and 16+ pivot-driven charts across 5 interactive pages, covering enrollments, revenue, net profit, attendance, and program performance for every center you run. Setup takes under 10 minutes — paste your enrollments into the Data sheet, click Refresh All, and every chart updates automatically.
🌍 Join 10,000+ customers in 180+ countries using NextGenTemplates to replace paid childcare management SaaS with one-time-purchase Excel, Google Sheets, Power BI, and HTML templates.
✅ Instant download · One-time payment · No subscription · No per-center fees · Lifetime access
🔑 Key Features of the Childcare Services Dashboard in Excel
- 5 Interactive Pages – The dashboard ships with 5 fully linked tabs (Overview, Enrollment Analysis, Center Performance, Program Insights, Monthly Trend) plus a Data sheet and a hidden Support sheet for pivot tables — 7 sheets total inside a single .xlsx file.
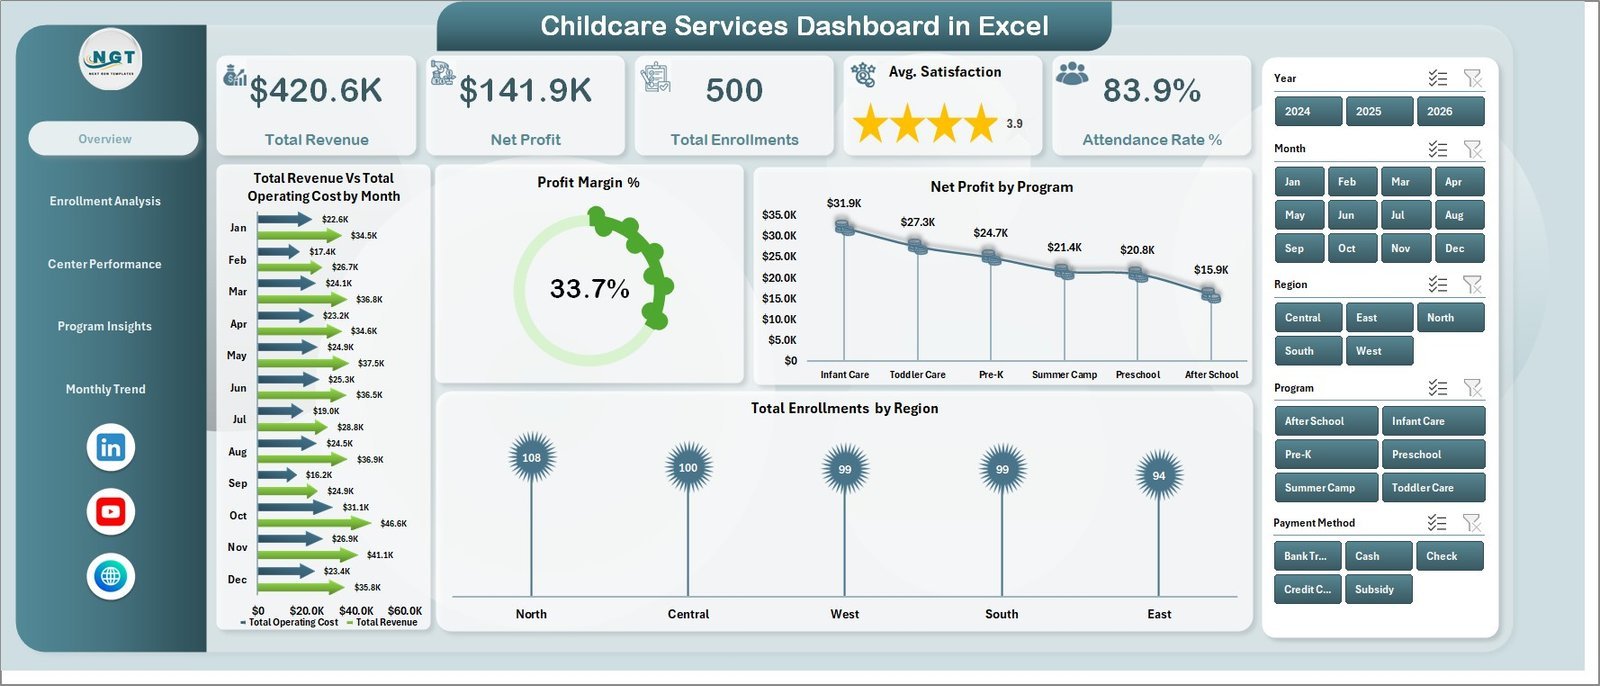
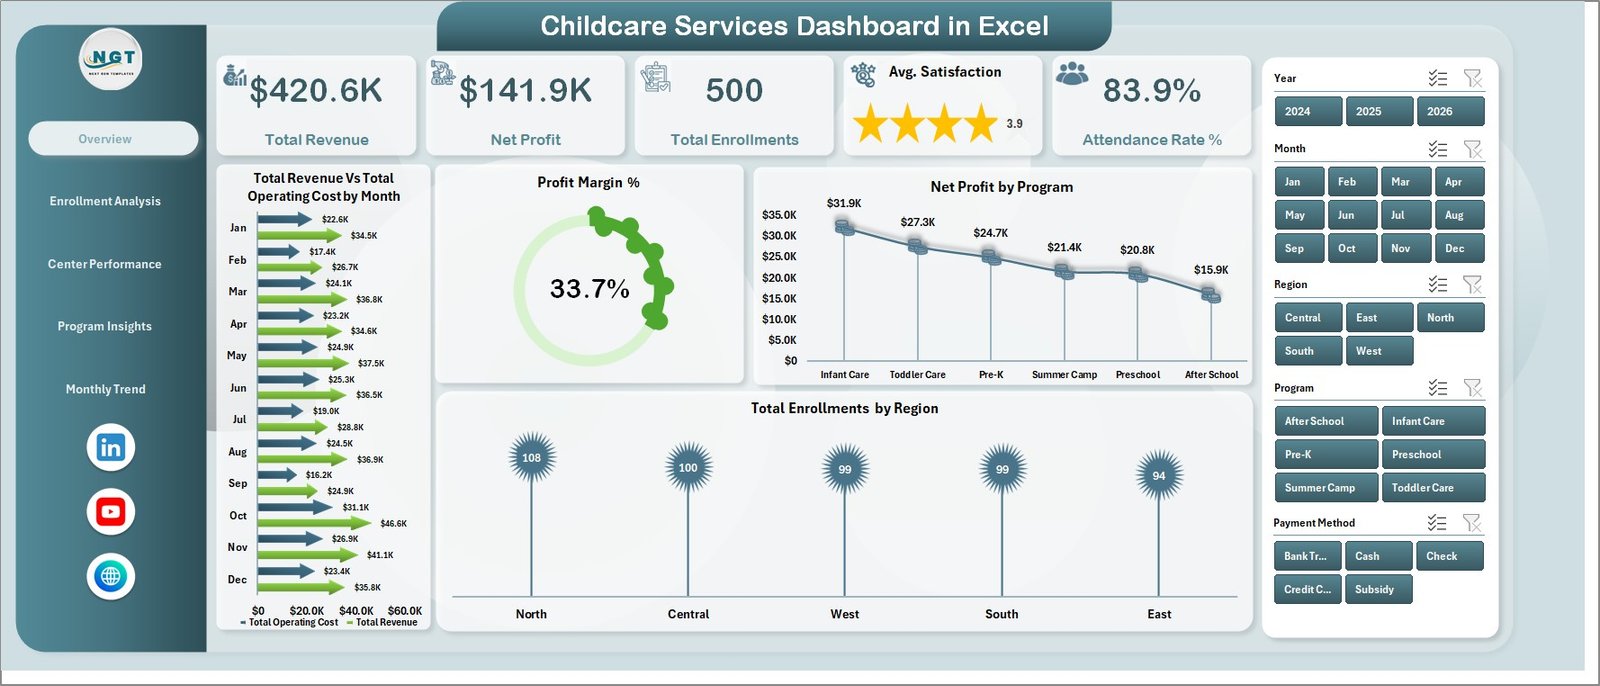
- 5 Headline KPI Cards – Total Revenue, Net Profit, Total Enrollments, Avg. Satisfaction, and Attendance Rate % sit at the top of the Overview page and recalculate the instant you refresh the data.
- Pivot-Powered Charts (16+) – Every chart in this Childcare Services Dashboard in Excel is wired to a pivot on the Support sheet. Replace 100 rows or 100,000 rows of data — click Refresh All on the Data ribbon and the entire dashboard updates in seconds.
- Multi-Center & Multi-Region Slicers – Filter by Center Name, Region, Program, Age Group, Status, Enrollment Type, and Year. Slicers are connected across charts so one click reshapes the whole view.
- Profitability View Per Program – Compare Total Revenue vs Total Operating Cost by Center Name and by Region, see Net Profit by Program, and identify which programs subsidize others.
- Built for Microsoft Excel 2016 and Later – Works on Microsoft 365, Excel 2019, 2021, and 2024 on both Windows and macOS. No add-ins, no Power Query, no VBA macros required.
📦 What’s Inside the Childcare Services Dashboard in Excel
Page 1: Overview
The Overview page leads with 5 KPI cards — Total Revenue, Net Profit, Total Enrollments, Avg. Satisfaction, and Attendance Rate % — and presents Total Revenue vs Total Operating Cost by Month, Profit Margin %, Net Profit by Program, and Total Enrollments by Region. Slicers at the top filter the entire page in one click so directors can quickly see how a specific center, region, or program is trending.
Page 2: Enrollment Analysis
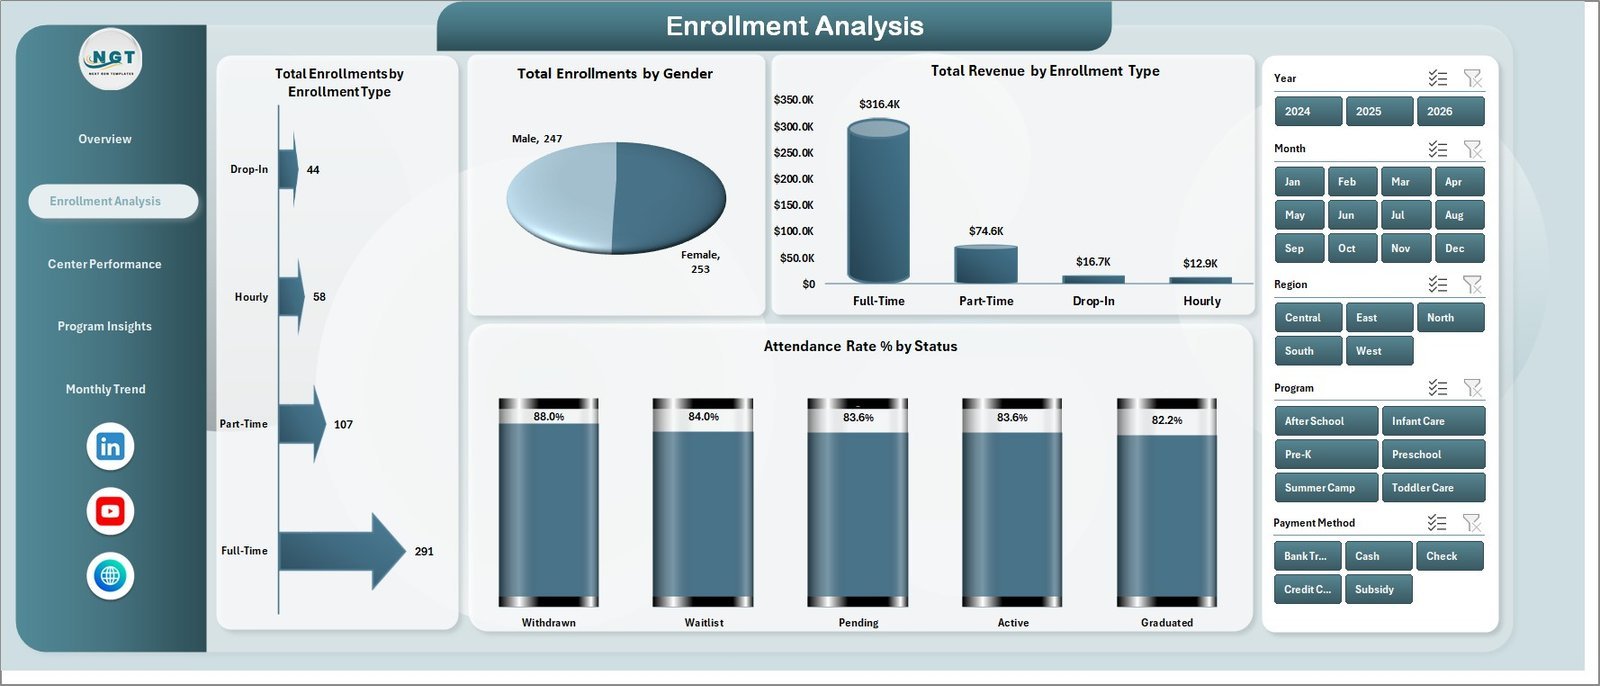
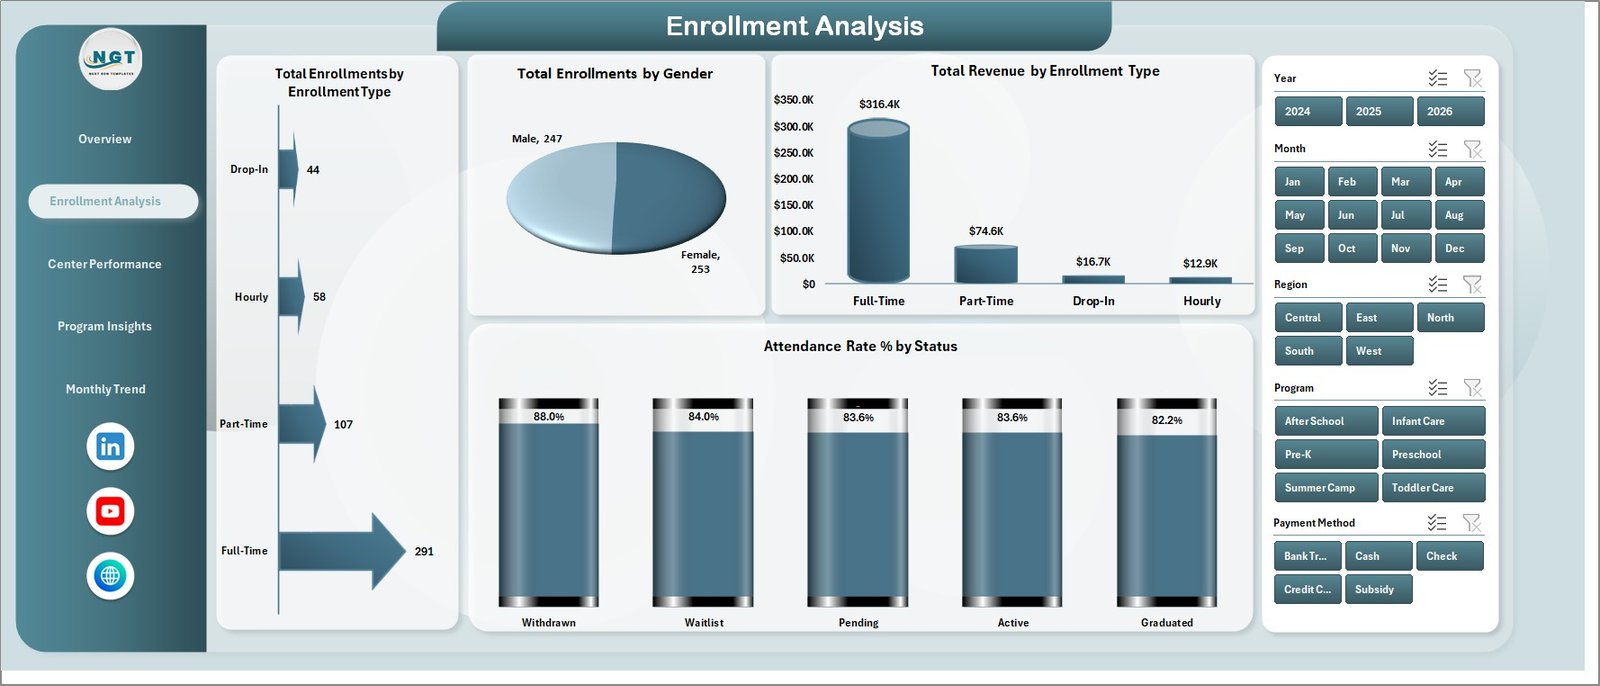
This page breaks down enrollments by Enrollment Type and Gender, then ties revenue and attendance back to those splits. Charts include Total Enrollments by Enrollment Type, Total Enrollments by Gender, Total Revenue by Enrollment Type, and Attendance Rate % by Status — ideal for spotting which programs convert and retain.
Page 3: Center Performance
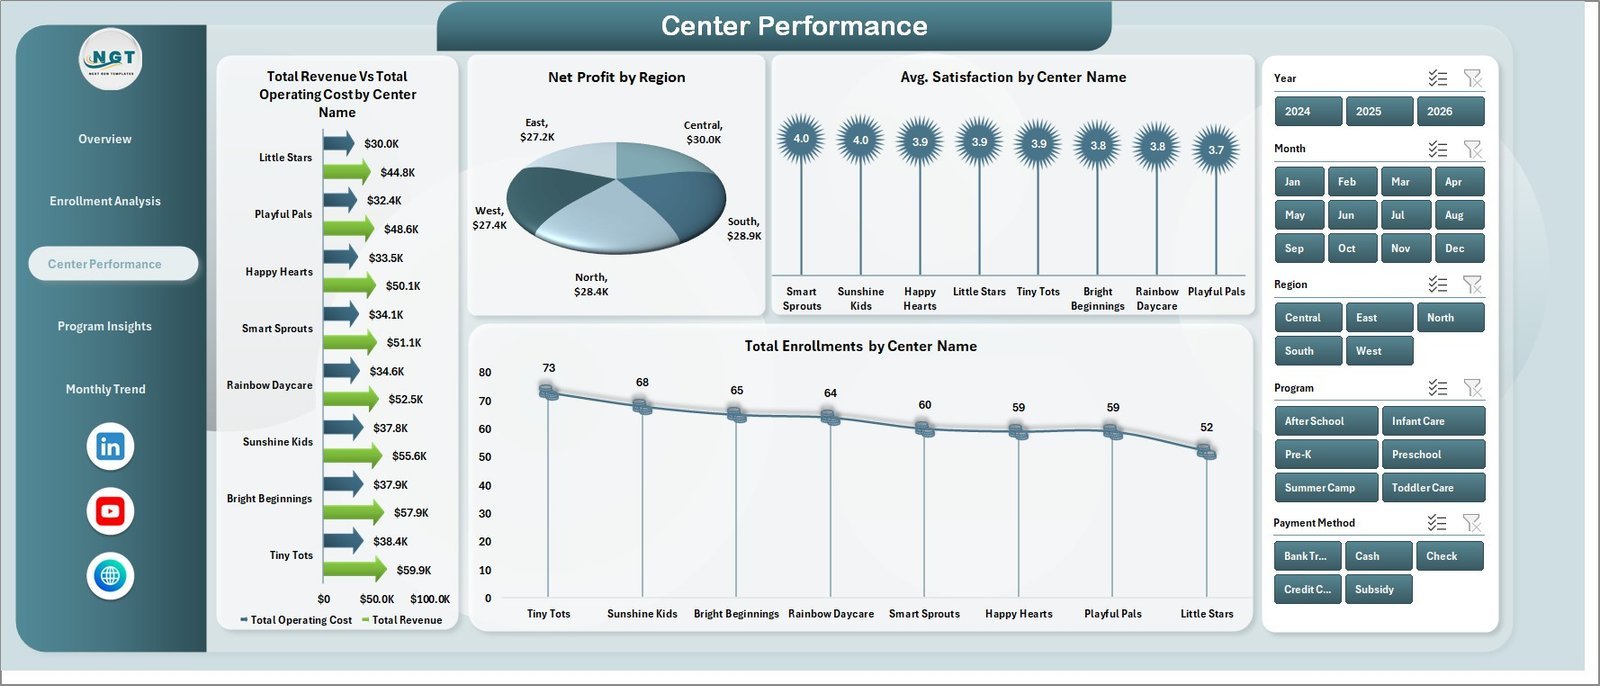
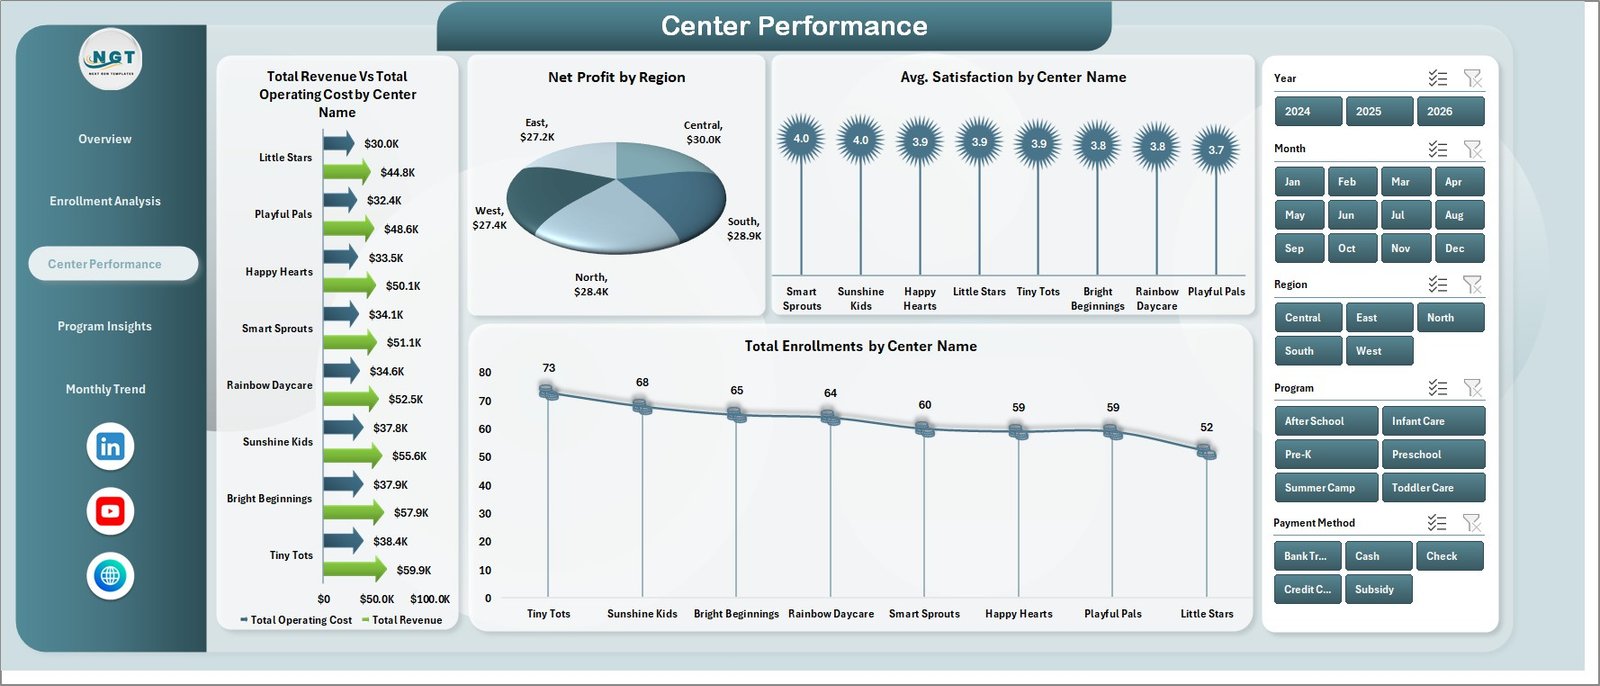
The Center Performance page benchmarks every childcare center against the rest of the network. Charts include Total Revenue vs Total Operating Cost by Center Name, Net Profit by Region, Avg. Satisfaction by Center Name, and Total Enrollments by Center Name — a one-page P&L view for multi-center owners.
Page 4: Program Insights
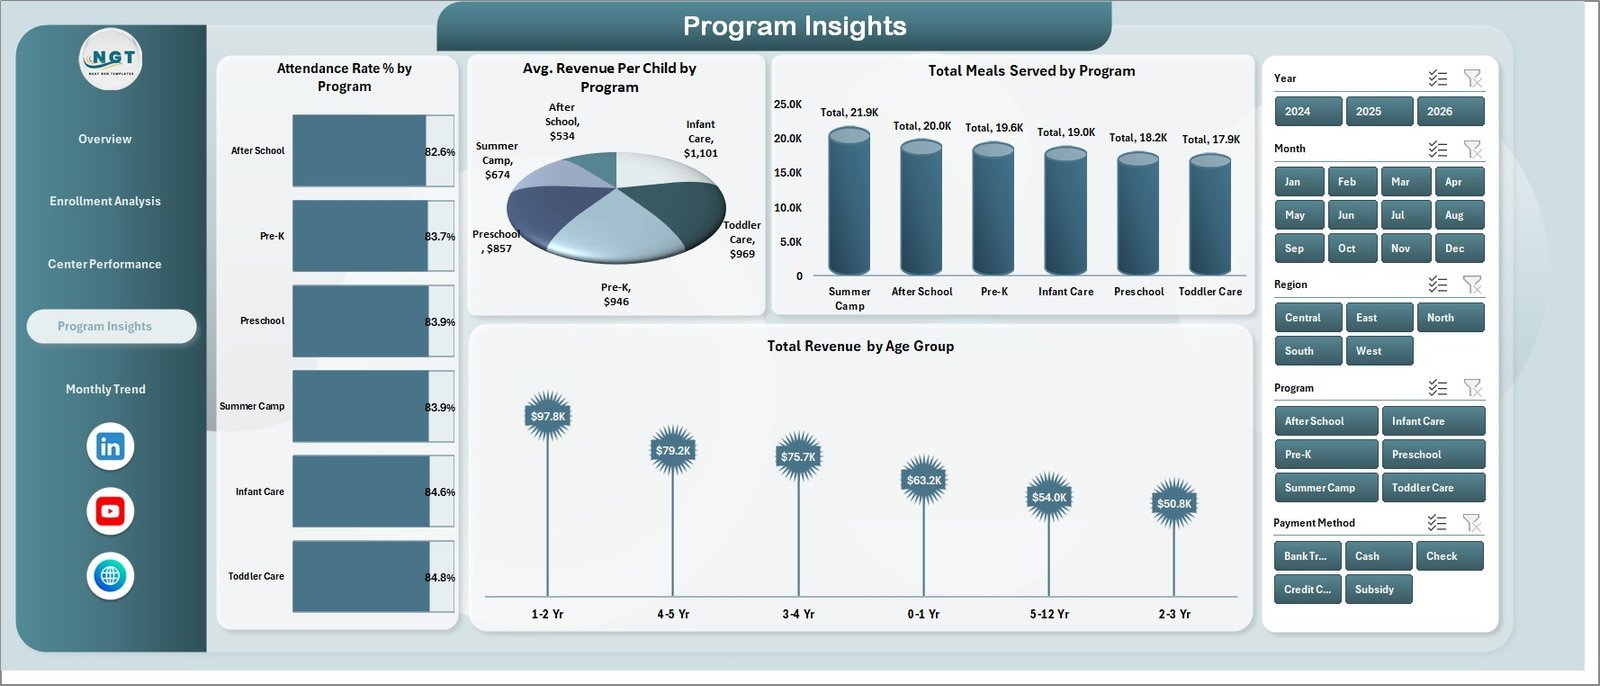
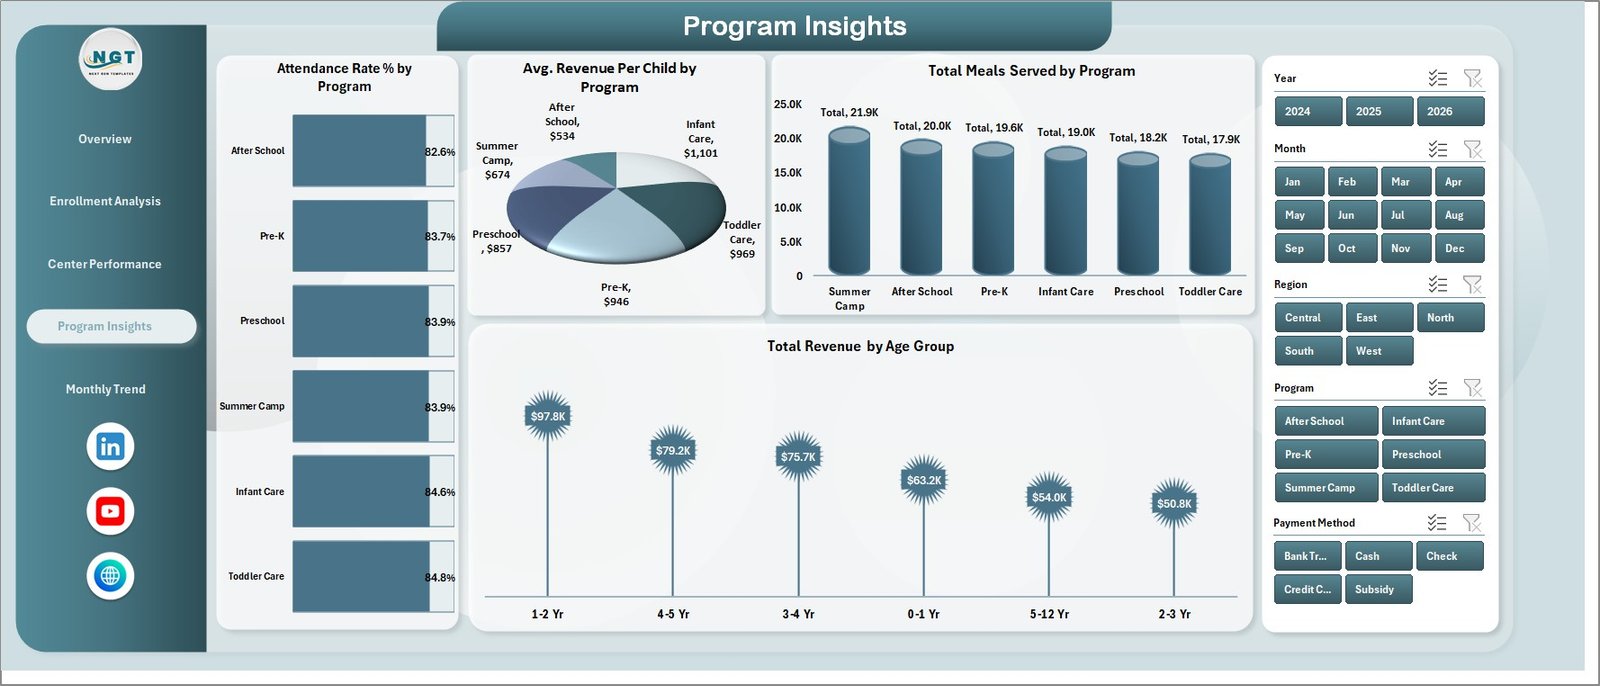
Program Insights pulls every metric down to the program level: Attendance Rate % by Program, Avg. Revenue Per Child by Program, Total Meals Served by Program, and Total Revenue by Age Group. This is where program coordinators decide which offerings to scale and which to retire.
Page 5: Monthly Trend
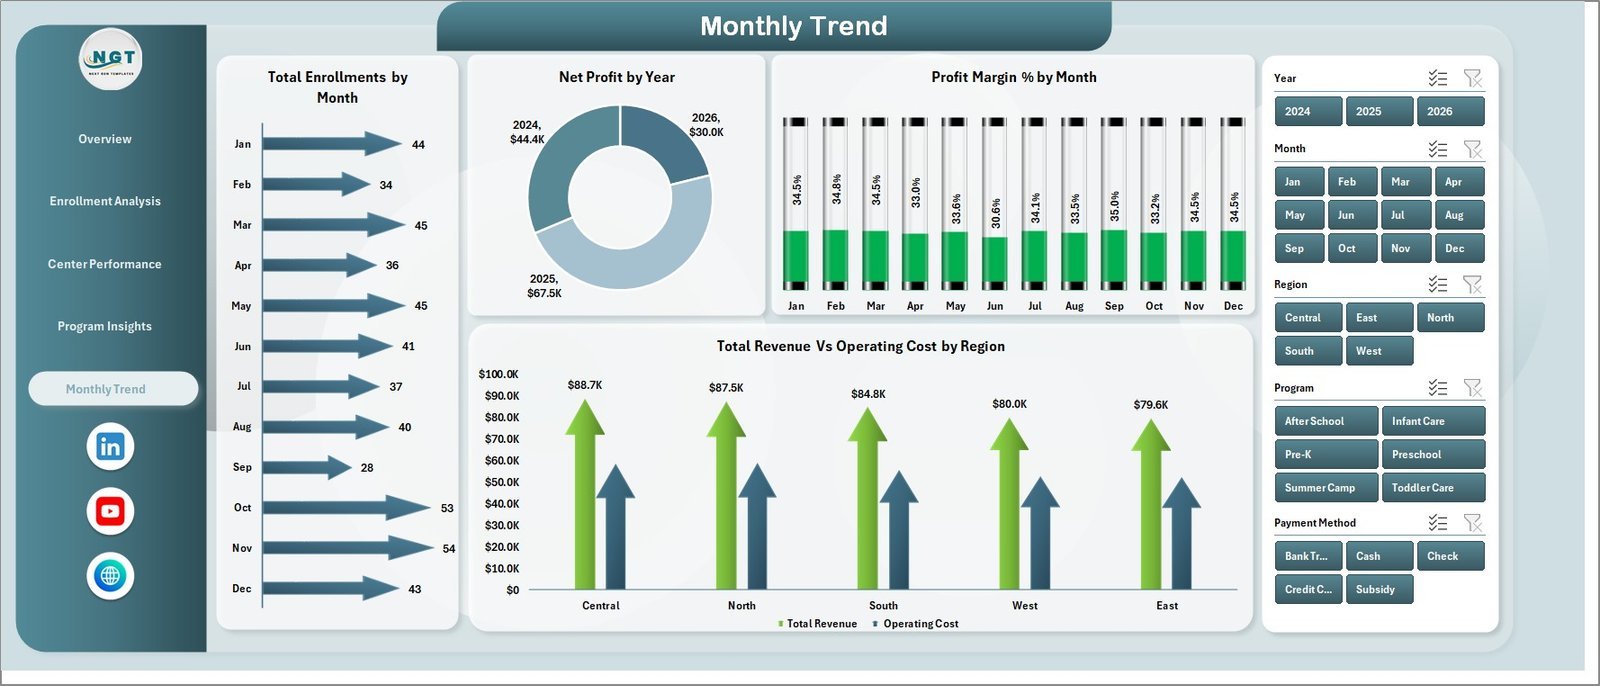
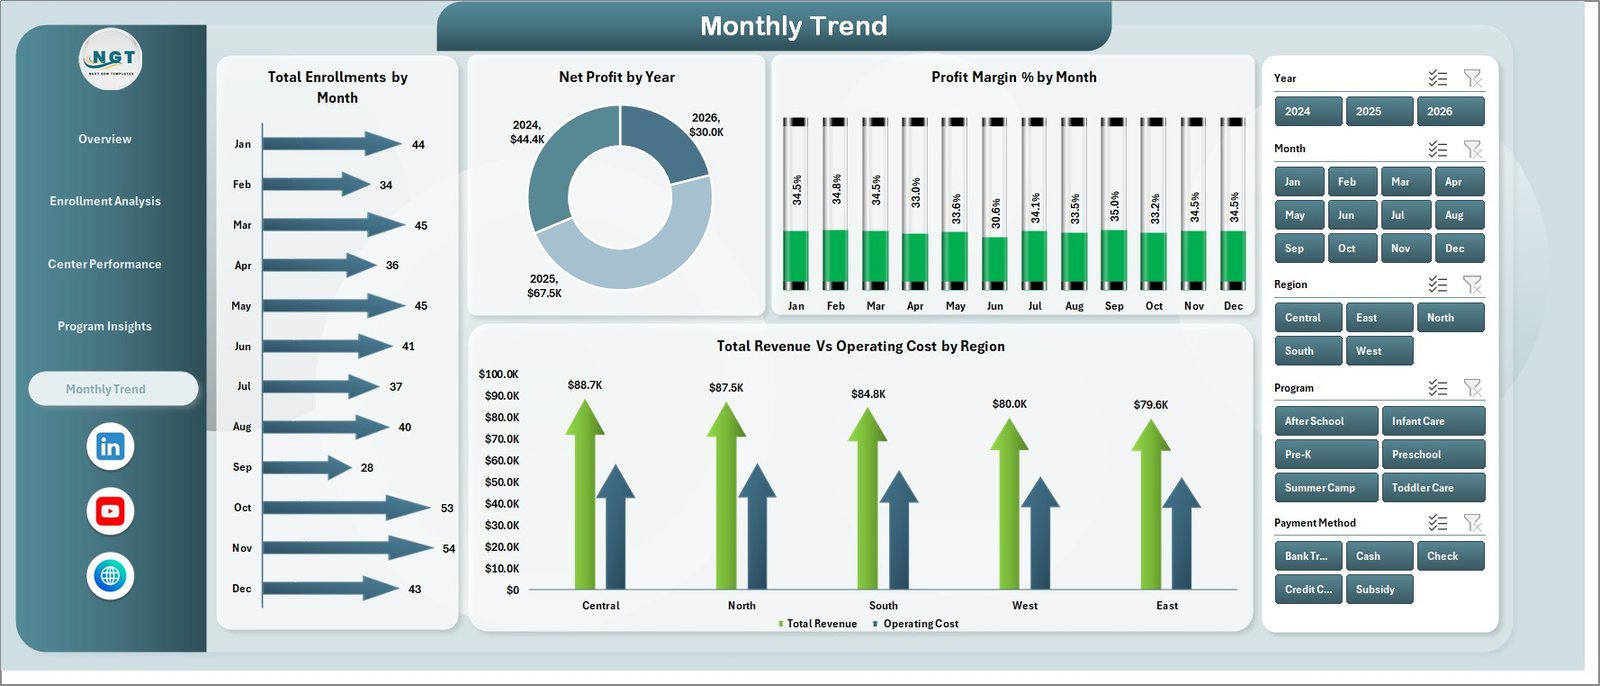
The Monthly Trend page tracks momentum over time: Total Enrollments by Month, Net Profit by Year, Profit Margin % by Month, and Total Revenue vs Operating Cost by Region. Use this page in monthly board reviews to flag seasonality and quarter-over-quarter swings.
Data Sheet
The Data sheet is the single source of truth — paste or type your enrollments here in the same column structure (Date, Center, Region, Program, Enrollment Type, Gender, Age Group, Status, Revenue, Operating Cost, Satisfaction, Attendance, Meals Served). The dashboard accepts thousands of rows without slowing down.

Support Sheet
The Support sheet holds every pivot table that drives the dashboard charts. After updating the Data sheet, go to the Data tab in the Excel ribbon and click Refresh All — every pivot and every chart will refresh together. You can keep this sheet hidden in day-to-day use.

📊 Childcare Services Dashboard in Excel vs. Google Sheets Equivalent vs. Paid Childcare SaaS — Where This Fits
| Feature | Childcare Services Dashboard in Excel | Google Sheets Equivalent | Brightwheel / Procare SaaS |
|---|---|---|---|
| Cost | $17.99 one-time | $9.99 one-time | $99–$300 / center / month |
| Platform | Microsoft Excel 2016+ | Google Sheets (browser) | Web app + iOS / Android |
| Setup time | Under 10 minutes ✅ | Under 10 minutes ✅ | 2–6 weeks onboarding |
| Pivot-driven refresh | ✅ One-click Refresh All | Manual range updates | Real-time but locked |
| Multi-center P&L view | ✅ Built-in | ✅ Built-in | ✅ (Enterprise tier only) |
| Customizable fields | ✅ Unlimited | ✅ Unlimited | Limited to vendor schema |
| Works offline | ✅ | ❌ | ❌ |
| Year-1 cost (3 centers) | $17.99 | $9.99 | $3,600–$10,800 |
For childcare operators that want full P&L visibility across centers without paying a SaaS bill per location, the Childcare Services Dashboard in Excel sits in the sweet spot.
👥 Who This Template Is For — and Who It’s Not For
✅ This template is built for:
- Childcare and daycare center owners running 1–20 locations who need a P&L, enrollment, and attendance view without a SaaS subscription.
- Preschool and after-school program directors reporting monthly performance to a board or parent committee.
- Operations managers replacing scattered spreadsheets with one consolidated Excel dashboard.
- Childcare consultants benchmarking client centers and presenting findings in monthly review meetings.
❌ This template is NOT for:
- Large national childcare chains needing real-time mobile parent communication, billing integration, and licensing compliance modules.
- Single home-based providers with fewer than 5 children — a simple tracker is enough.
- Teams without Excel 2016 or later, or that rely exclusively on Google Sheets (use the Daycare Center Dashboard in Google Sheets instead).
⚙️ How to Use the Childcare Services Dashboard in Excel
- Download the .zip file and extract the Childcare Services Dashboard in Excel workbook to your computer.
- Open the file in Microsoft Excel 2016 or later (Windows or macOS).
- Go to the Data sheet and replace the sample rows with your own enrollment records, keeping the same column order.
- Click the Data tab in the Excel ribbon, then click Refresh All — every pivot and every chart updates instantly.
- Use the slicers at the top of each page to filter by Center, Region, Program, Age Group, Status, or Year.
- Customize colors, fonts, or logos under the Page Layout tab and save the file to share with your team.
💼 Real-World Use Cases
Priya runs three childcare centers in Mumbai. She uses the Childcare Services Dashboard in Excel to compare revenue and operating cost across all three locations every Monday, then forwards the Overview page screenshot to her co-founder before their weekly call — replacing the $720/month Brightwheel Enterprise plan she was on.
David is a program director at a US-based preschool chain. He uses the Program Insights and Center Performance pages every month to identify which programs have falling Avg. Revenue Per Child, then sits with the regional managers to adjust pricing before the next enrollment cycle.
Aarti is an independent childcare consultant. She drops each client’s data into a fresh copy of the dashboard and uses the slicers to walk owners through their own numbers, billing $150/hour without needing access to expensive analytics platforms.
❓ Frequently Asked Questions
What KPIs does the Childcare Services Dashboard in Excel track?
The Childcare Services Dashboard in Excel tracks 5 headline KPIs — Total Revenue, Net Profit, Total Enrollments, Avg. Satisfaction, and Attendance Rate % — plus secondary metrics including Profit Margin %, Avg. Revenue Per Child, Total Operating Cost, and Total Meals Served. Every KPI recalculates the moment you refresh the dashboard.
How long does setup take?
Setup typically takes under 10 minutes. Open the workbook, paste your enrollment data into the Data sheet using the same column structure, then click Refresh All on the Excel Data ribbon. Every pivot and chart in the Childcare Services Dashboard in Excel will update together — no formulas to edit.
How does this compare to Brightwheel or Procare?
Brightwheel and Procare are full childcare management platforms with billing, attendance check-in, and parent communication — they run $99 to $300 per center per month. The Childcare Services Dashboard in Excel is a $17.99 one-time analytics layer focused on multi-center P&L, enrollment, and attendance reporting. Many operators run both.
Does it work on Mac and Windows?
Yes. The Childcare Services Dashboard in Excel works on Microsoft Excel 2016 and later on both Windows and macOS, including Microsoft 365. No VBA macros, no add-ins, and no Power Query connections are required.
Can I add my own programs, centers, and regions?
Absolutely. Add any new Program, Center, or Region values directly in the Data sheet — the pivot tables on the Support sheet will pick them up the next time you click Refresh All. Slicers will also auto-extend to include the new categories.
Can I share the dashboard with my team?
Yes. Save the workbook to OneDrive, SharePoint, or any shared drive and your team can open it in desktop Excel or Excel for the web. For browser-only collaboration, see the Google Sheets version.
Is there a tutorial video?
Yes — step-by-step walkthroughs for the Childcare Services Dashboard in Excel and dozens of related Excel dashboards are on the PK: An Excel Expert YouTube channel, with 300K+ subscribers across our three channels.
👤 About the Author
Built by PK — Microsoft Certified Professional with 15+ years of Excel, Google Sheets, and Power BI experience. Founder of NextGenTemplates, reaching 300K+ subscribers across YouTube channels (@PK-AnExcelExpert, @NextGenTemplates, @NeoTechNavigators). Every template is hand-built and tested before release.
🔗 Explore Related Templates
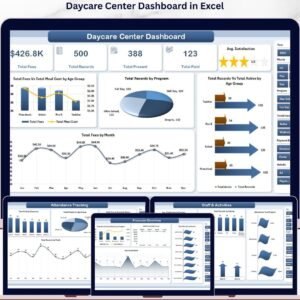
- Also available as: Daycare Center Dashboard in Excel, Daycare Center Dashboard in Google Sheets, and Daycare Center Dashboard in Power BI.
- Childcare Services KPI Dashboard in Excel — a scorecard-style alternative focused on KPI vs target.
- Preschool KPI Dashboard in Google Sheets — lighter pre-K view in browser.
- Student Enrollment KPI Scorecard in Excel — standalone enrollment scorecard for schools.
- Browse the full Excel Dashboards collection and Education templates.
📖 Click here to read the Detailed Blog Post
🎥 Visit our YouTube channel for step-by-step video tutorials
👉 YouTube.com/@NextGenTemplates
📅 Last updated: May 2026
Watch the step-by-step video tutorial:
YouTube
Compatibility and Requirements
- Works in Microsoft Excel 2016 or later on Windows and Mac, including Microsoft 365. No VBA macros, add-ins or Power Query connections are needed.
- Paste your data into the Data sheet and click Refresh All to update the pivot charts and slicers.
- New to slicers? Microsoft explains them in Use slicers to filter data.








Reviews
There are no reviews yet.