



Managing celebrities, influencers, and brand collaborations is no longer just about contracts and invoices. Celebrity Management Dashboard in Excel Today, talent managers, agencies, and brands must track fees, expenses, commissions, reach, engagement, and performance—often across multiple agencies, regions, and platforms. When this information lives in emails, PDFs, and scattered spreadsheets, visibility disappears and decision-making slows down.
Celebrity Management Dashboard in Excel That is exactly why the Celebrity Management Dashboard in Excel is designed—to give you complete control, clarity, and confidence from a single Excel file.
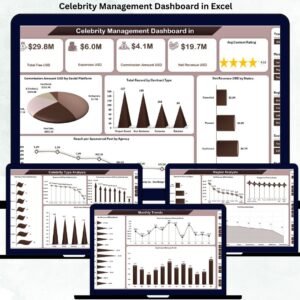
Celebrity Management Dashboard in Excel This ready-to-use dashboard converts raw celebrity management data into clear visuals and actionable insights. Instead of manually calculating revenue, commissions, and performance metrics, you get instant visibility into Total Fees, Expenses, Net Revenue, Reach, Engagement, and Content Ratings. Best of all, everything runs inside Excel, making it affordable, flexible, and easy to customize without technical complexity.
Whether you manage celebrity endorsements, influencer campaigns, or agency relationships, this dashboard helps you move from chaos to structured, data-driven management.
🚀 Key Features of Celebrity Management Dashboard in Excel
🎯 All-in-One Celebrity Performance View – Track contracts, revenue, expenses, commissions, and performance in one place
📊 Executive Overview Page – Instantly understand business health with KPI cards and charts
💰 Revenue & Cost Tracking – Monitor Total Fees, Expenses, Commission, and Net Revenue
📈 Multi-Dimensional Analysis – Analyze performance by celebrity type, agency, region, and month
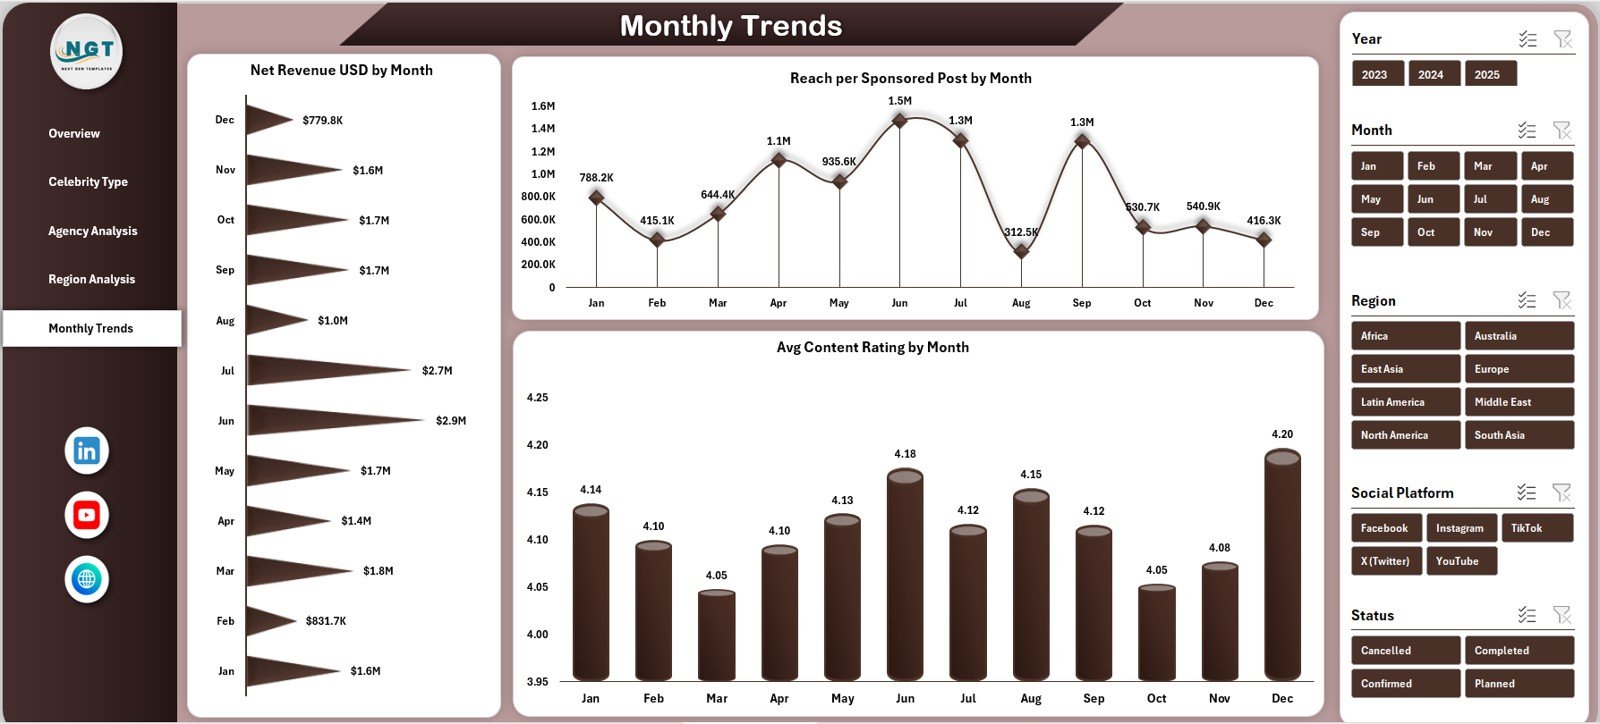
📅 Monthly Trend Analysis – Identify growth patterns, seasonality, and performance dips
🧭 Page Navigator – Move seamlessly across analysis pages without searching sheet tabs
🎛️ Interactive Filters & Slicers – Drill down by agency, platform, region, or category
⚙️ 100% Excel-Based Solution – No BI tools, no subscriptions, no technical setup
📦 What’s Inside the Celebrity Management Dashboard in Excel
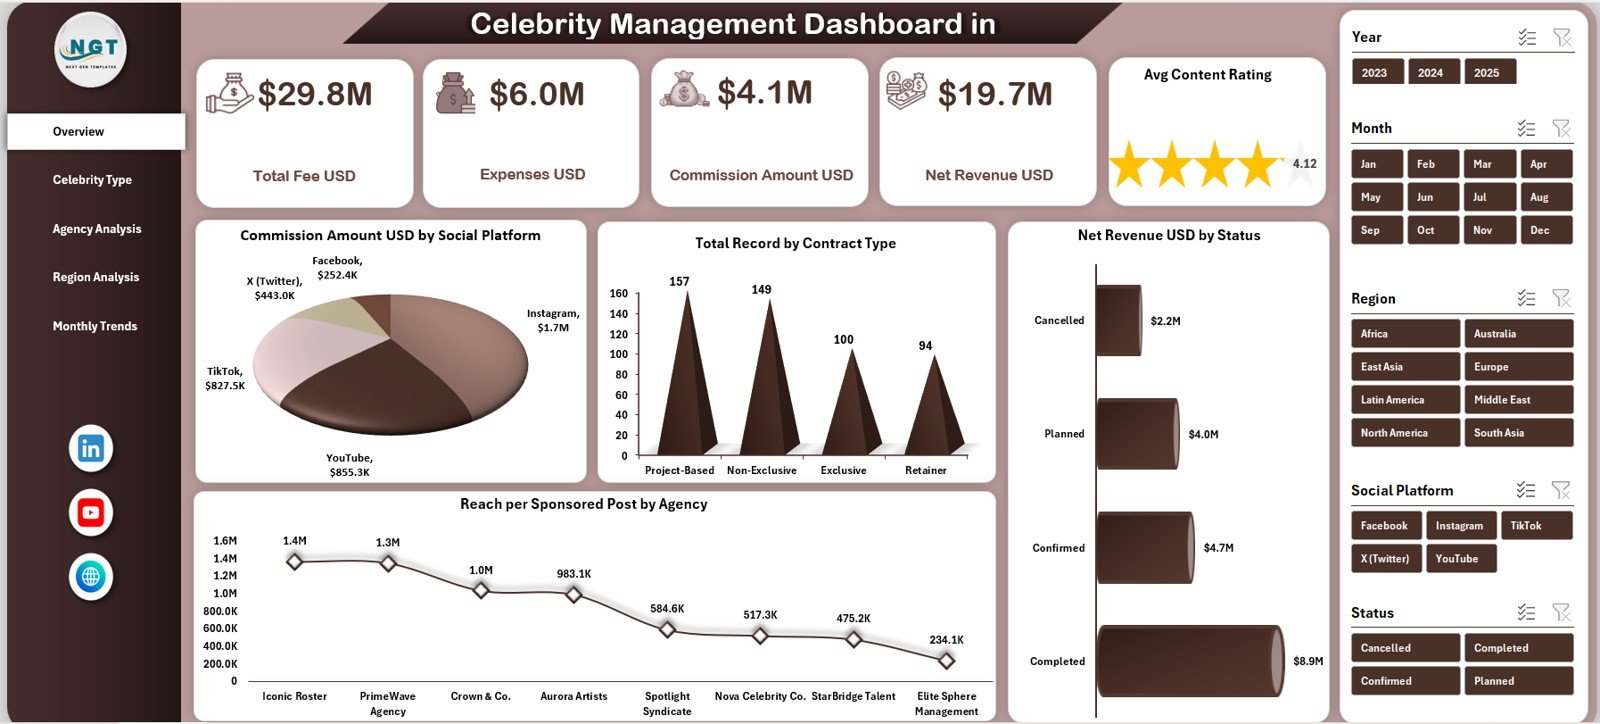
📁 Professionally Designed Excel Dashboard File
🏠 Overview Page with KPI cards and summary charts
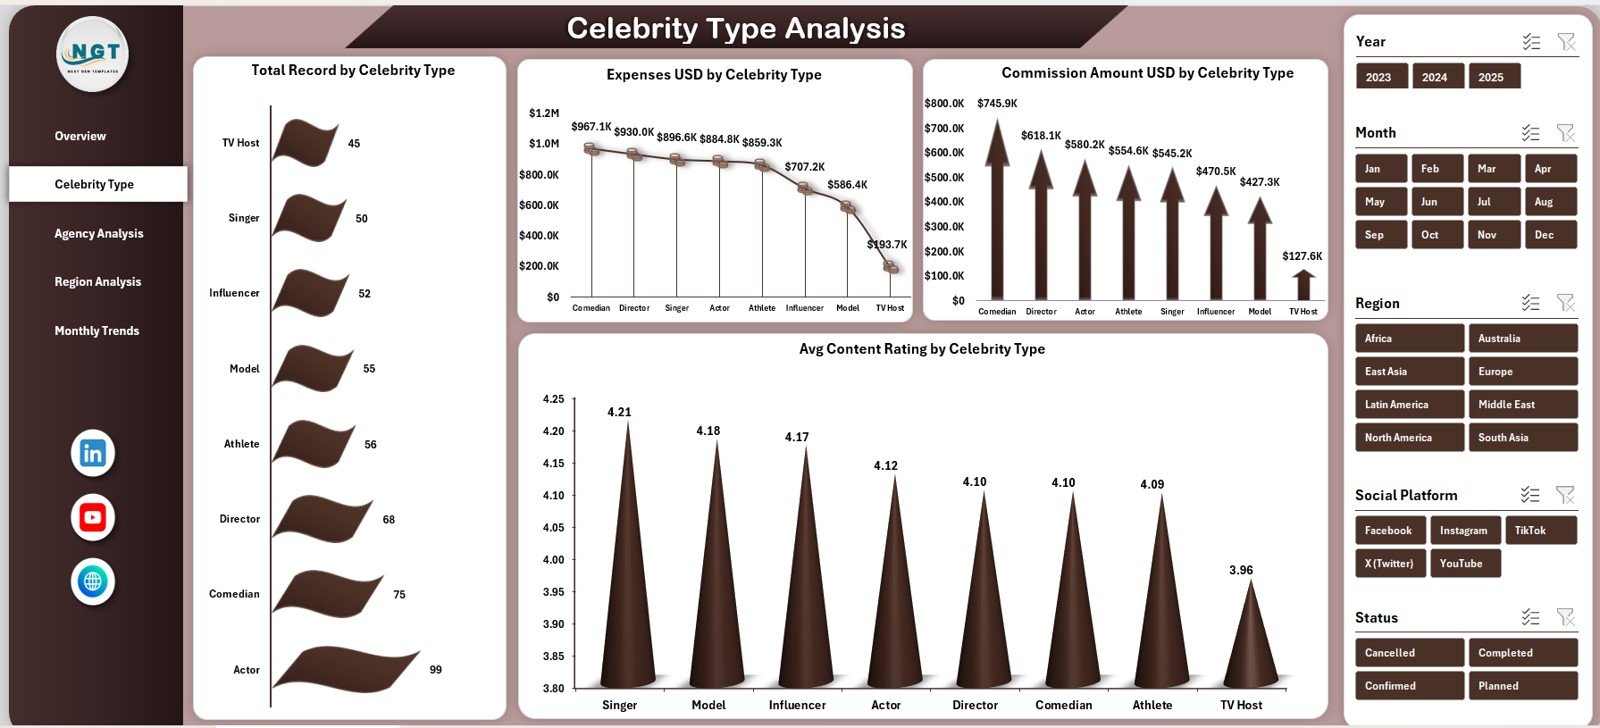
👤 Celebrity Type Analysis Page to compare performance by category
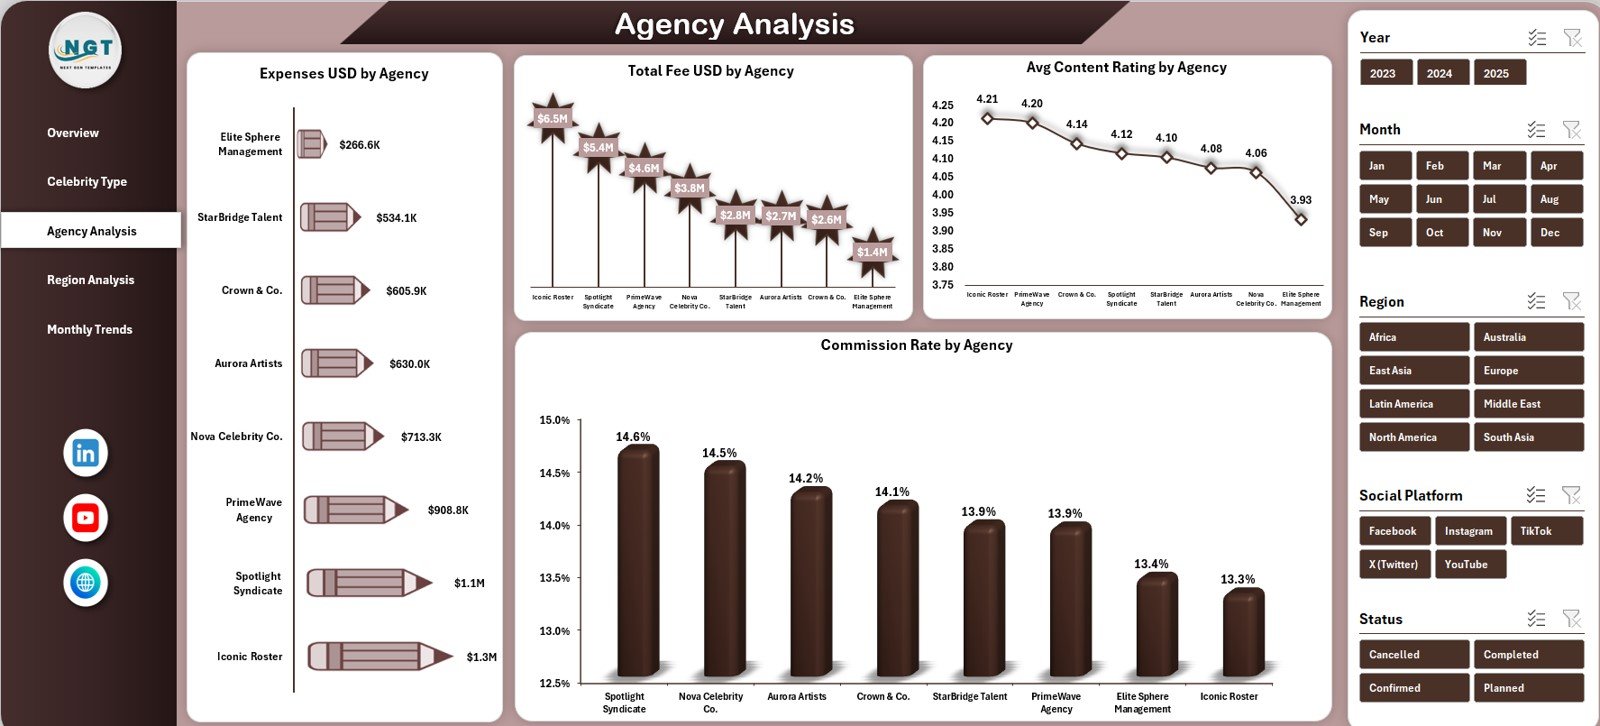
🏢 Agency Analysis Page to evaluate agency efficiency and commissions
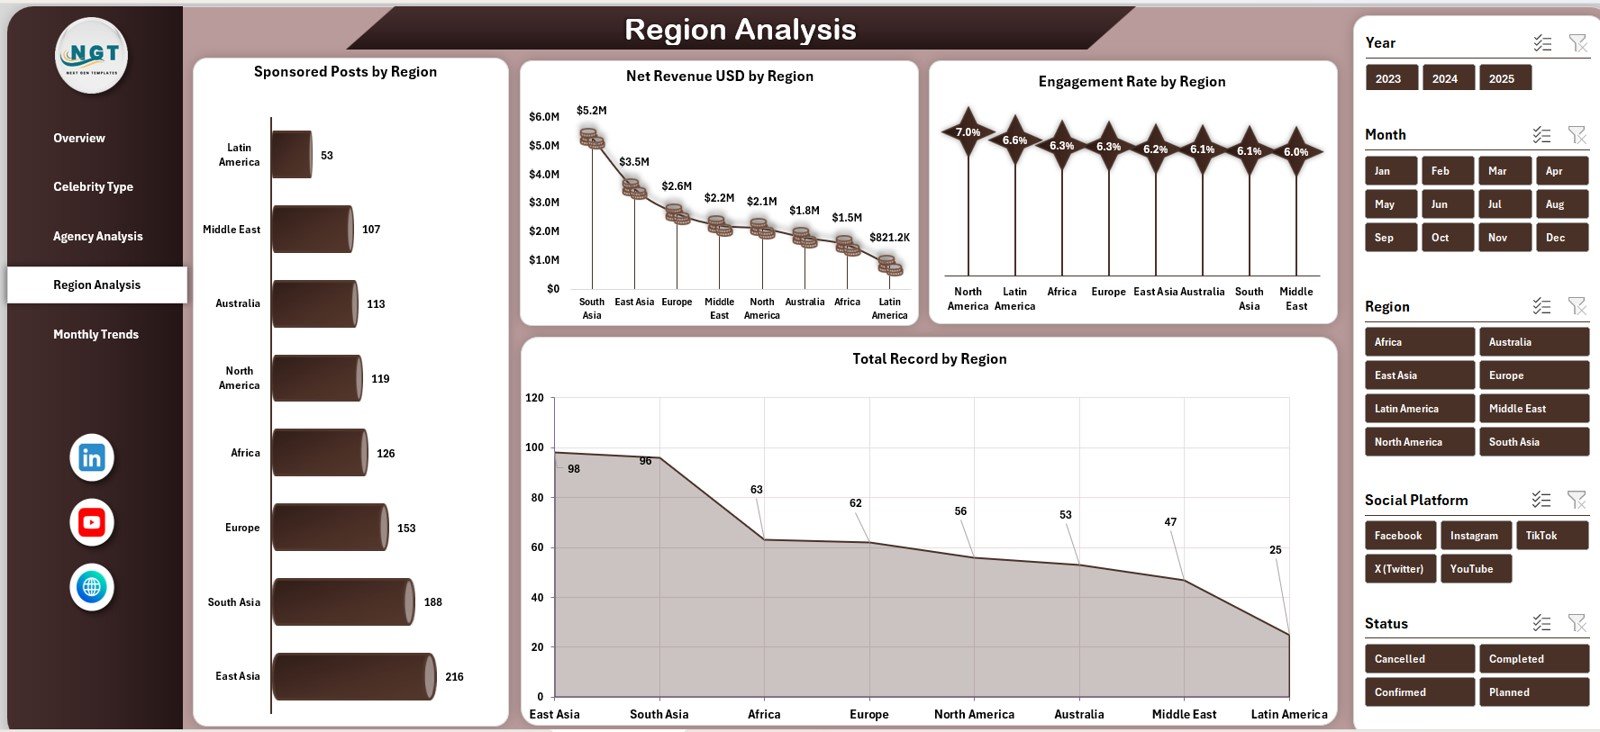
🌍 Region Analysis Page to track geographic performance
📆 Monthly Trends Page for time-based insights
🧾 Data Sheet to store all raw celebrity, contract, and performance data
📊 Auto-Updating Charts & KPIs driven by formulas and pivot tables
Everything is pre-built—just enter your data and start analyzing.
🛠️ How to Use the Celebrity Management Dashboard in Excel
1️⃣ Enter or update data in the Data Sheet
2️⃣ Include celebrity details, agencies, fees, expenses, commissions, reach, and ratings
3️⃣ Excel formulas and pivot tables process the data automatically
4️⃣ Use slicers to filter by celebrity type, agency, region, or time
5️⃣ Review KPIs, charts, and trends across all analysis pages
6️⃣ Use insights to optimize contracts, control costs, and improve performance
No advanced Excel knowledge is required—basic Excel skills are enough.
👥 Who Can Benefit from This Celebrity Management Dashboard in Excel
🌟 Celebrity & Talent Managers – Track deals, performance, and profitability
🏢 Talent & Influencer Agencies – Monitor commissions and agency effectiveness
📢 Brand Partnership Teams – Analyze sponsored post-performance and ROI
💼 Finance & Accounting Teams – Control costs, commissions, and net revenue
📊 Marketing Analysts & Consultants – Generate insights without manual reports
🎬 Media & Entertainment Companies – Manage multi-celebrity portfolios efficiently
🔗 Click here to read the Detailed Blog Post
🎥 Visit our YouTube Channel to learn step-by-step video tutorials
Watch the step-by-step video tutorial:
Compatibility and Requirements
- Works in Microsoft Excel desktop (Excel 2016 or later, or Microsoft 365).
- The dashboard uses slicers and pivot tables to filter by celebrity type, agency, region and time. Microsoft explains slicers in Use slicers to filter data.
Frequently Asked Questions
Which pages are included?
The file has an Overview page, a Celebrity Type Analysis page, an Agency Analysis page, a Region Analysis page, a Monthly Trends page and a Data Sheet.
What do I enter in the Data Sheet?
Enter celebrity details, agencies, fees, expenses, commissions, reach and ratings. The KPIs and charts update from that data through formulas and pivot tables.
Which KPIs does the Overview page show?
It shows Total Fees, Expenses, Net Revenue, Reach, Engagement and Content Ratings as KPI cards with summary charts.
Can I filter the dashboard by agency or region?
Yes. Slicers let you filter by celebrity type, agency, region or time period.
Do I need advanced Excel skills?
No. Basic Excel skills are enough, because the pages are already built and you only enter your data.
Is there a Power BI version?
Yes. See the Celebrity Management Dashboard in Power BI.
Related Dashboard Templates
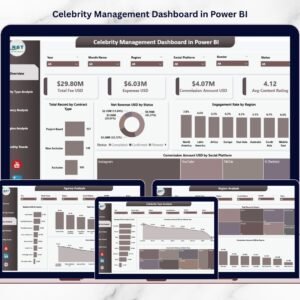
- Celebrity Management Dashboard in Power BI: the same topic as a Power BI edition
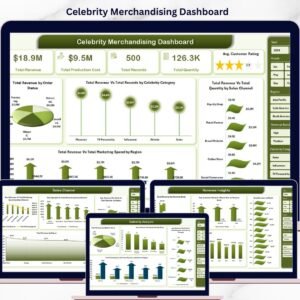
- Celebrity Merchandising Dashboard in Excel: a dashboard for celebrity merchandise
- Finance Summary Dashboard in Excel: a finance view in Excel
- Employee Performance Rating Card and Dashboard in Excel: a performance rating view for staff
- KPI Dashboard Library (Excel): 15 Excel KPI dashboards in one download
Browse all Excel dashboards.





























Reviews
There are no reviews yet.