

Car Customization Firms Dashboard in Power BI
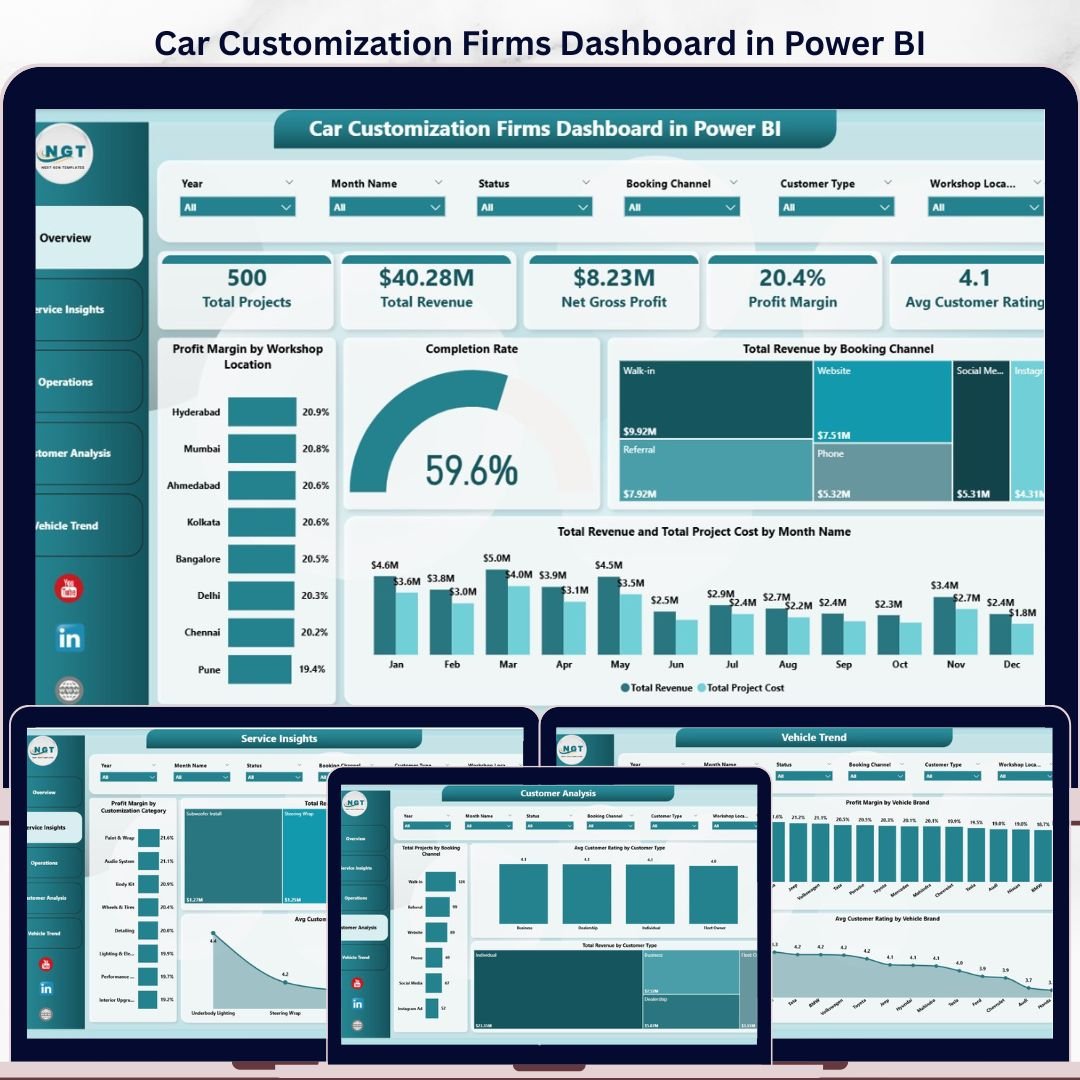
Car Customization Firms Dashboard in Power BI Managing a car customization workshop without clear data visibility means flying blind on profitability, technician performance, and customer satisfaction. This Car Customization Firms Dashboard in Power BI gives workshop owners, operations managers, and business analysts a complete 5-page interactive reporting solution — covering revenue trends, service profitability, technician ratings, booking channels, and vehicle brand analysis — all in one professionally designed .pixy file.
Car Customization Firms Dashboard in Power BI Built for automotive customization businesses that manage multiple service categories (wrapping, detailing, performance upgrades, audio installs, etc.), this dashboard uses DAX-powered KPIs, drill-through slicers, and month-wise trend charts to turn raw booking data into actionable decisions.
What’s Inside This Power BI Dashboard?
This dashboard covers 5 reporting pages, each targeting a specific operational area of your car customization business:
Page 1 – Overview
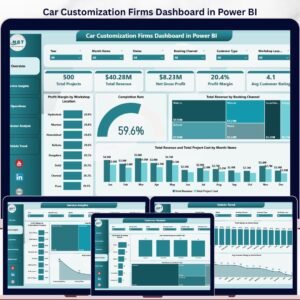
The Overview page gives a high-level snapshot of your entire business performance. Five KPI cards display Total Projects, Total Revenue, Net Gross Profit, Profit Margin, and Avg Customer Rating at a glance. Key charts include Profit Margin by Workshop Location (compare performance across branches), Completion Rate (gauge chart), Total Revenue by Booking Channel (online vs walk-in vs referral), and a dual-axis Revenue and Project Cost by Month trend. Multiple slicers allow instant filtering by date, location, service type, and booking channel.
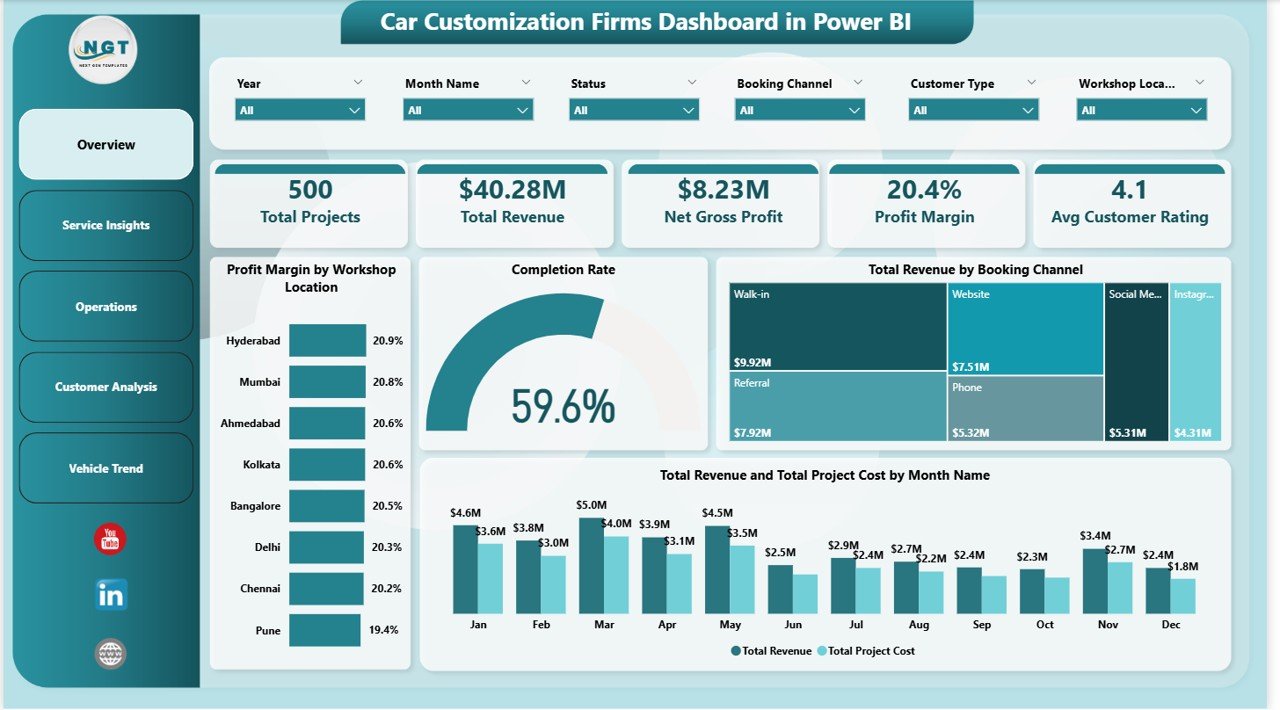 Car Customization Firms Dashboard in Power BI – Overview Page
Page 2 – Service Insights
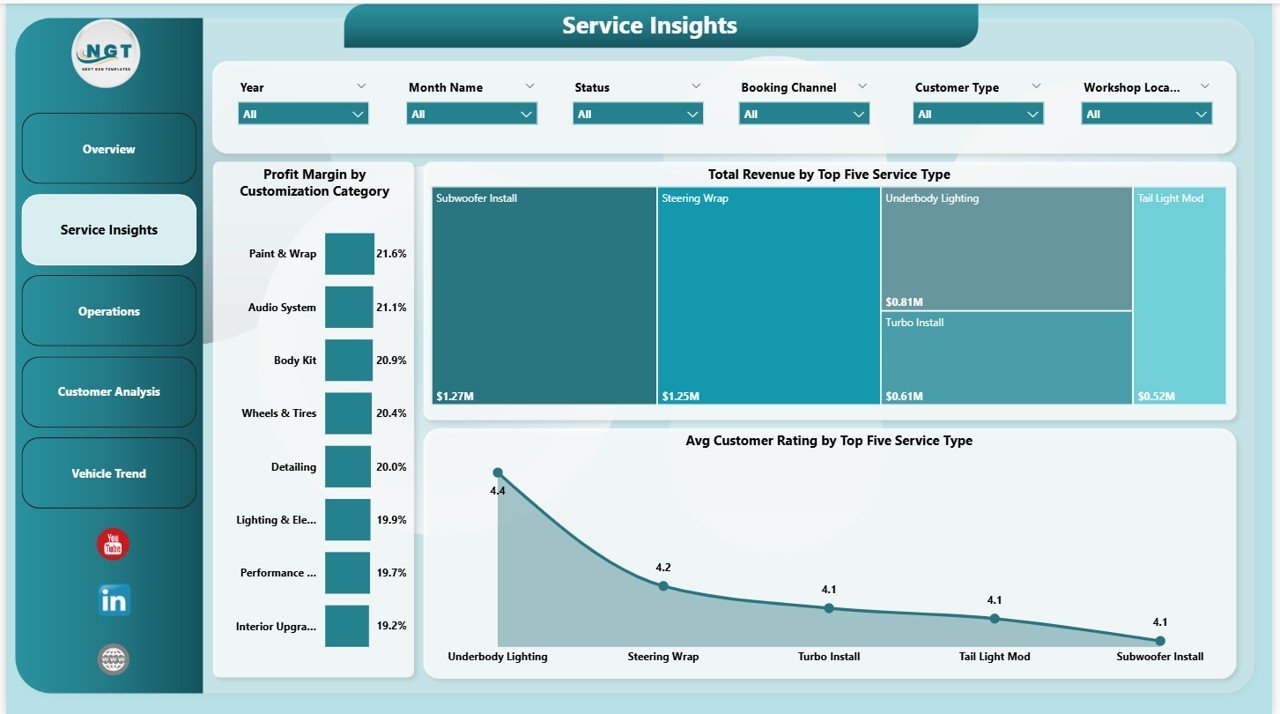
The Service Insights page digs into which customization categories and service types are driving profit and customer satisfaction. Charts include Profit Margin by Customization Category (wrapping, audio, detailing, etc.), Total Revenue by Top Five Service Types (ranked bar chart), and Avg Customer Rating by Top Five Service Types — helping you spot which services deliver the best client experience and which need attention.
 Car Customization Firms Dashboard in Power BI – Service Insights Page
Page 3 – Operations
The Operations page tracks workshop efficiency, project status distribution, and technician-level performance. Visuals include Net Gross Profit by Workshop Location (bar chart for branch comparison), Total Projects by Status (completed, in-progress, pending), and Avg Customer Rating by Technician — a powerful view for identifying your top performers and coaching those who need support.
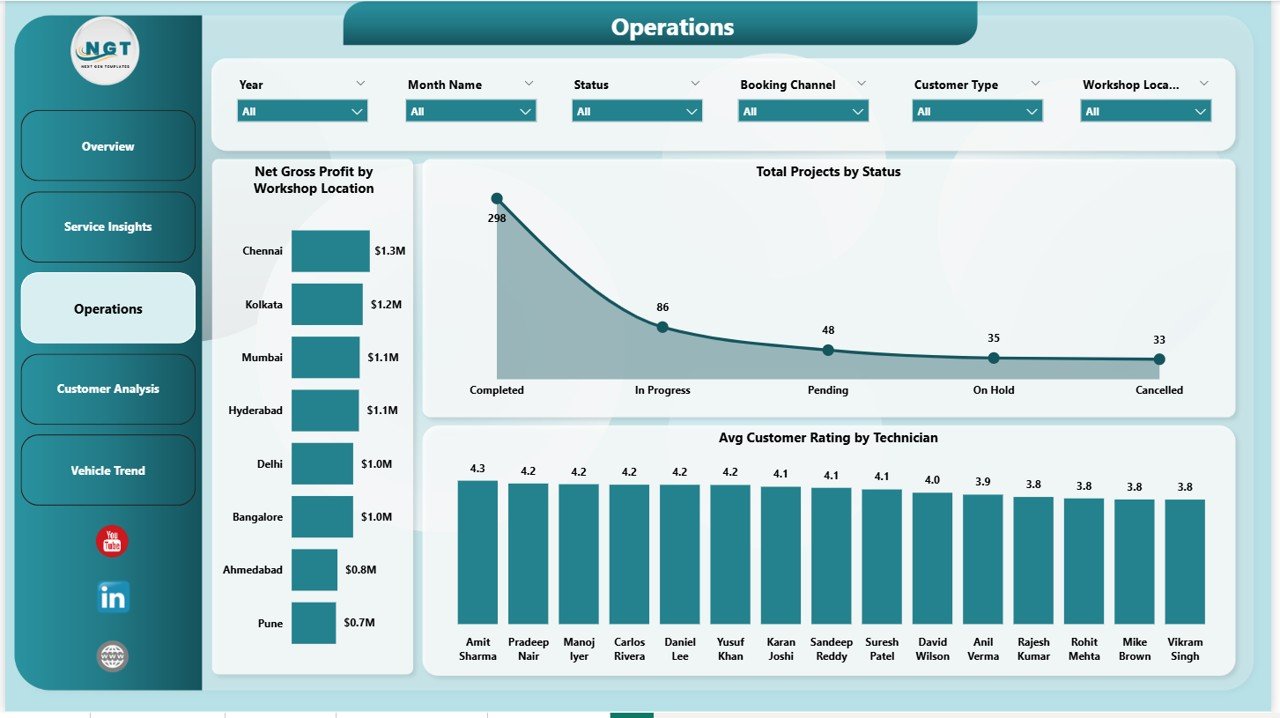 Car Customization Firms Dashboard in Power BI – Operations Page
Page 4 – Customer Analysis
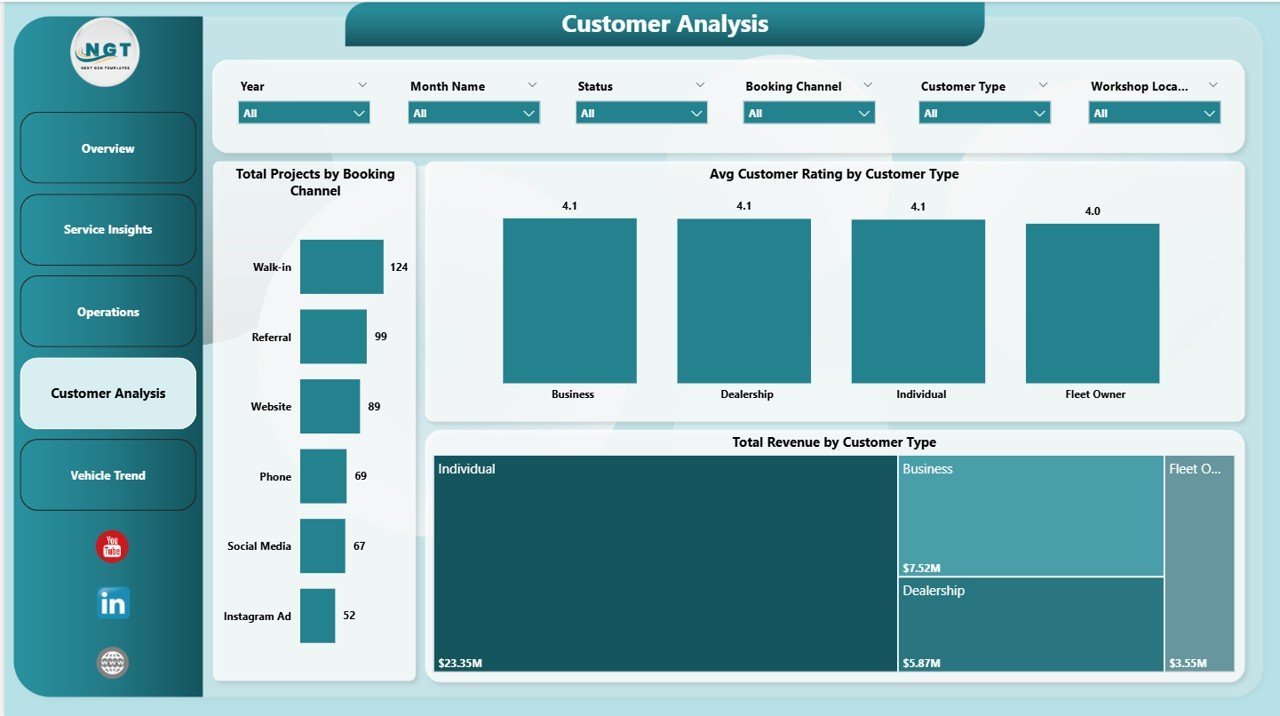
The Customer Analysis page breaks down booking behavior and revenue contribution by customer segment. Charts include Total Projects by Booking Channel (how customers reach you), Avg Customer Rating by Customer Type (new vs returning vs corporate), and Total Revenue by Customer Type — revealing your most profitable customer segments so you can focus acquisition and retention efforts accordingly.
 Car Customization Firms Dashboard in Power BI – Customer Analysis Page
Page 5 – Vehicle Trend
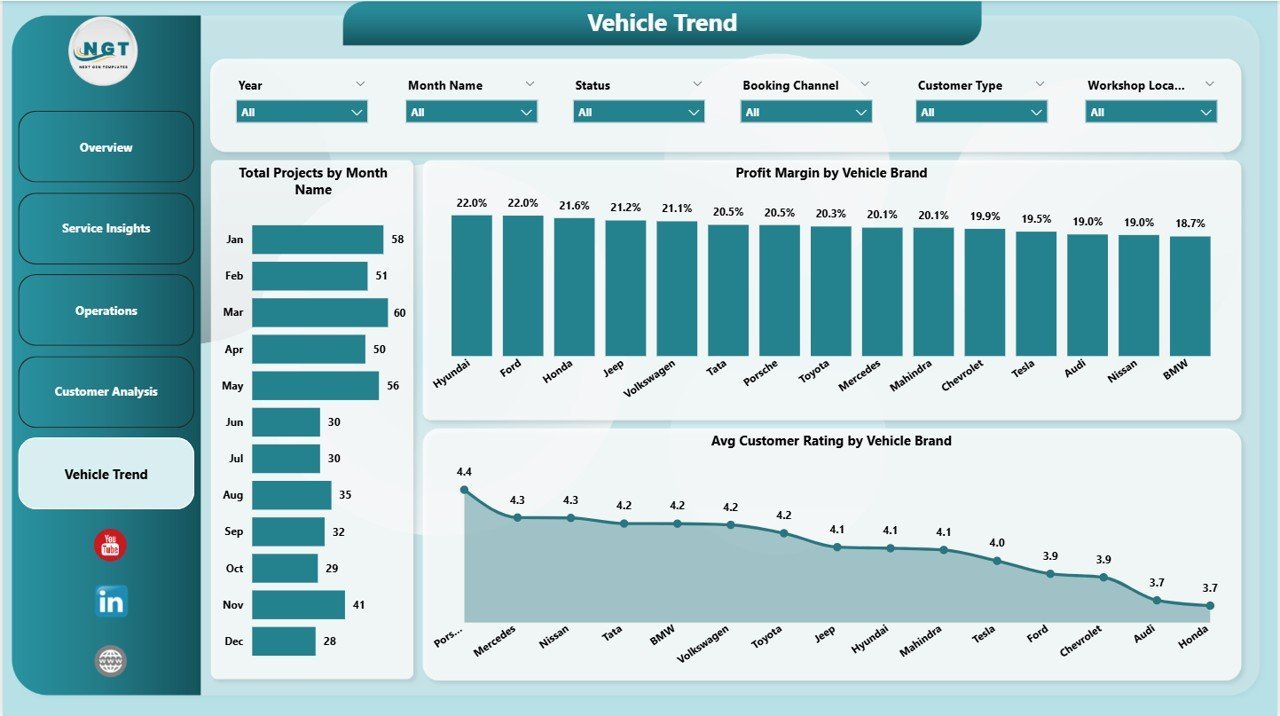
The Vehicle Trend page provides time-series and brand-level analysis of your project workload and customer satisfaction. Charts include Total Projects by Month Name (spot seasonal demand spikes), Profit Margin by Vehicle Brand (which makes bring the most profit), and Avg Customer Rating by Vehicle Brand — helping you understand which vehicle segments your technicians serve best.
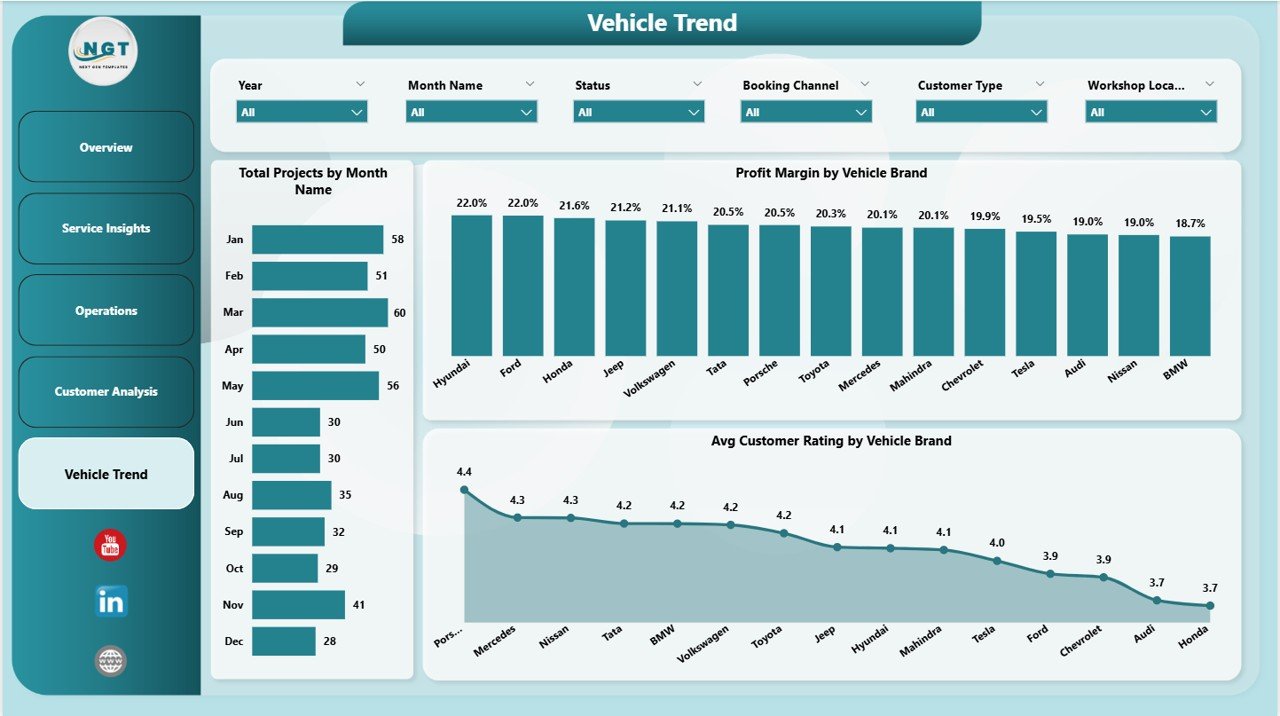 Car Customization Firms Dashboard in Power BI – Vehicle Trend Page
Key Features
- 5 fully interactive Power BI report pages covering Operations, Service, Customer, and Vehicle analytics
- KPI cards: Total Projects, Total Revenue, Net Gross Profit, Profit Margin, Avg Customer Rating
- Drill-through slicers: filter by date range, workshop location, service type, booking channel, and customer type
- Technician-level performance ratings to identify top performers
- Vehicle brand profitability and satisfaction scoring
- Booking channel attribution (online, walk-in, referral) for marketing decisions
- Month-wise revenue vs cost trend for seasonality planning
- Completion rate gauge for project delivery tracking
- Professional dark-themed design optimized for presentations and stakeholder reports
- Compatible with Power BI Desktop (free) — no Power BI Pro license required to edit
Who Is This Dashboard For?
- Car customization workshop owners tracking multi-branch performance
- Operations managers monitoring technician productivity and project completion rates
- Sales and marketing teams analyzing booking channel effectiveness
- Finance leads tracking revenue, costs, and profit margins by service category
- Business analysts building executive-level automotive reports
How to Use This Dashboard
- Download the .zip file and extract the .pbix file
- Open the file in Power BI Desktop (free download from Microsoft)
- Connect your own data source or paste your data into the sample table structure
- Refresh the data model — all 5 dashboard pages update automatically
- Use slicers on each page to filter by location, date, service type, or customer segment
- Export to PDF or publish to Power BI Service for team sharing
Comparison: Manual Reporting vs This Power BI Dashboard
| Feature | Manual Spreadsheet | Car Customization Firms Dashboard in Power BI |
|---|---|---|
| Multi-page reporting | ❌ Multiple files | ✅ 5 pages in one .pbix |
| KPI cards | ❌ Manual calculation | ✅ DAX-powered, auto-update |
| Slicer filtering | ❌ Manual filter/sort | ✅ Interactive slicers |
| Technician performance | ❌ Ad hoc pivot | ✅ Dedicated Operations page |
| Vehicle brand analysis | ❌ Not available | ✅ Vehicle Trend page |
| Booking channel attribution | ❌ Manual tracking | ✅ Customer Analysis page |
| Setup time | ⚠️ Hours per report | ✅ Ready in minutes |
Frequently Asked Questions
Q: Do I need a Power BI Pro license to use this dashboard?
A: No. You can open, edit, and use this dashboard with Power BI Desktop, which is free to download from Microsoft. A Pro license is only needed if you want to publish and share reports via Power BI Service.
Q: Can I customize the colors and branding?
A: Yes. All visuals, colors, fonts, and layouts are fully customizable within Power BI Desktop. You can apply your company branding in minutes.
Q: What data format does this dashboard accept?
A: The dashboard is built on a structured data table. You can connect it to Excel files, SQL databases, SharePoint lists, or any Power BI-supported data source.
Q: Is this suitable for a business with multiple workshop locations?
A: Yes. The dashboard includes Workshop Location as a slicer dimension and shows Net Gross Profit and Profit Margin broken down by location — ideal for multi-branch management.
Q: Can I add more pages or charts?
A: Absolutely. Since you receive the full .pbix source file, you can add new report pages, modify existing visuals, or create additional DAX measures to fit your reporting needs.
📖 Click here to read the Detailed Blog Post
🎥 Visit our YouTube channel for step-by-step video tutorials
👉 YouTube.com/@NextGenTemplates
Watch the step-by-step video tutorial:
YouTube


Reviews
There are no reviews yet.