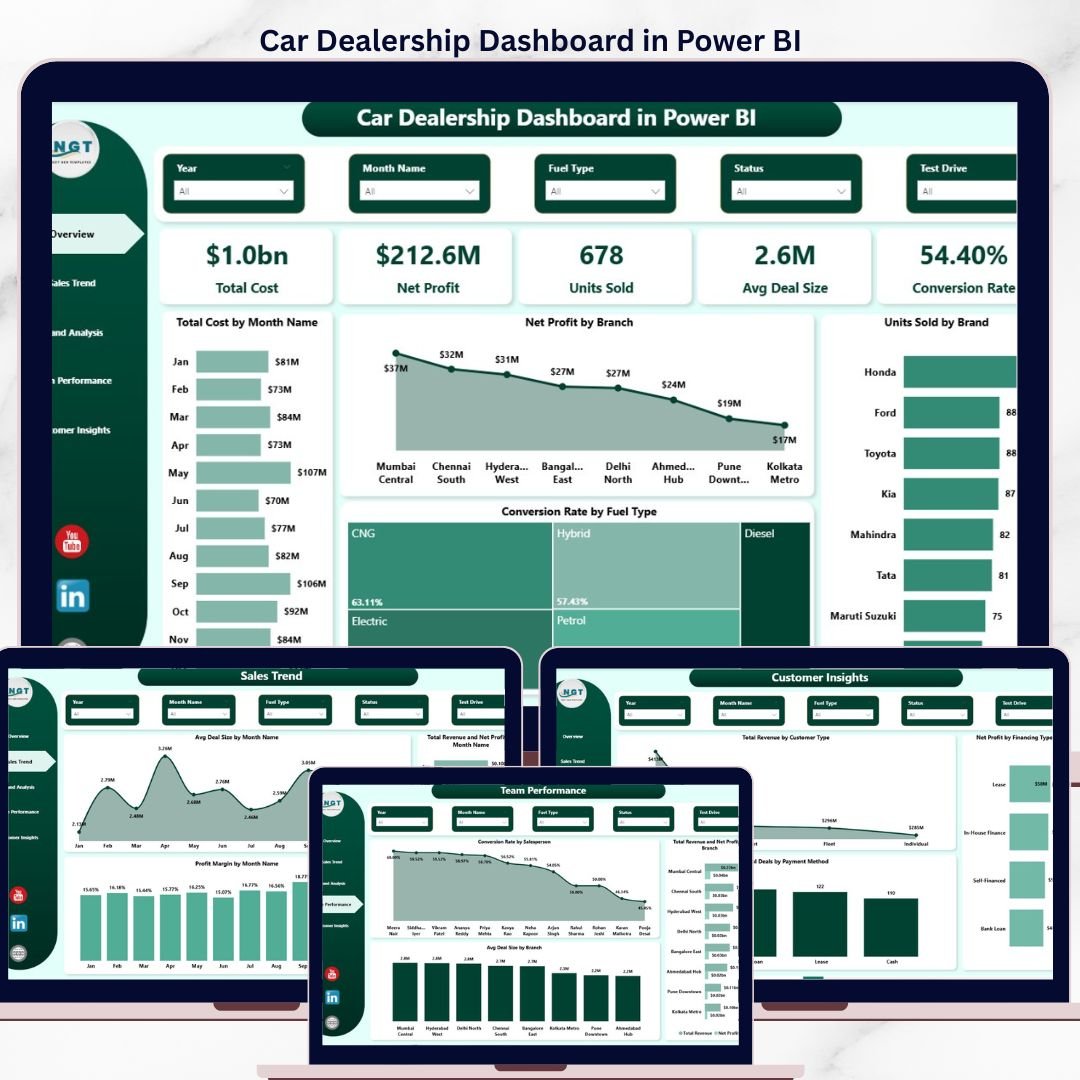
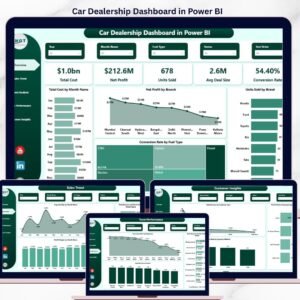
The Car Dealership Dashboard in Power BI tracks 5 KPIs across 5 interactive pages, with 15+ pre-built visuals covering cost, profit, conversion, brand mix and team performance. Setup takes under 10 minutes — open the .pbix file in Power BI Desktop, point the model at your own sales records, and every visual refreshes automatically with your own dealership data.
🌍 Join 8,400+ teams in 40+ countries using NextGenTemplates to replace paid SaaS tools with one-time-purchase Excel, Google Sheets, Power BI and HTML templates.
✅ Instant download · One-time payment · No subscription · No per-user fees · Lifetime access
🔑 Key Features of the Car Dealership Dashboard in Power BI
This dashboard is engineered for independent dealers, multi-brand dealerships, used-car lots and F&I managers who want a DAX-powered command centre for every deal they close. Built on Power BI Desktop with 5 dedicated pages, 15+ visuals and full slicers for Brand, Branch, Fuel Type and Vehicle Type, it replaces scattered DMS reports with a single interactive model that refreshes in seconds. ⚡
🔹 Fully editable .pbix file — every visual, DAX measure and relationship is open for you to customise in Power BI Desktop.
🔹 5 analysis pages — Overview, Sales Trend, Brand Analysis, Team Performance and Customer Insights.
🔹 5 KPI cards on the Overview page — Total Cost, Net Profit, Units Sold, Avg Deal Size and Conversion Rate.
🔹 15+ interactive visuals covering cost trends, profit margin, brand mix, salesperson productivity and financing-type analysis.
🔹 Margin-first measures — Profit Margin %, Conversion Rate and Avg Deal Size are pre-built as DAX measures, not hard-coded columns.
🔹 Multi-brand and multi-branch ready — filter the report for Toyota vs Honda vs Hyundai or compare branches side-by-side in one click.
🔹 Financing insight — Net Profit by Financing Type reveals whether dealership-financed deals actually beat cash on margin.
🔹 Publish to Power BI Service and share reports with the GM, owner, bank or investors via the web and mobile apps.
🔹 Compatible with our full range of Power BI Dashboard Templates so you can standardise reporting across every business unit.
📦 What’s Inside the Car Dealership Dashboard in Power BI
1 — Overview Page
The Overview page is the homepage of the dashboard. Five KPI cards sit across the top — Total Cost, Net Profit, Units Sold, Avg Deal Size and Conversion Rate — while slicers for Brand, Branch, Fuel Type and Vehicle Type let you re-segment every visual in one click.
📈 Total Cost by Month Name — reveals seasonal inventory swings and helps CFOs time stock injections around demand cycles.
🏢 Net Profit by Branch — ranks every outlet by bottom-line profit so the GM sees which store is actually carrying the group.
⛽ Conversion Rate by Fuel Type — shows whether your team is closing Petrol, Diesel, Electric or Hybrid leads best, critical as EV demand shifts.
🚘 Units Sold by Brand — breaks volume across Toyota, Honda, Hyundai and the rest of your inventory mix.
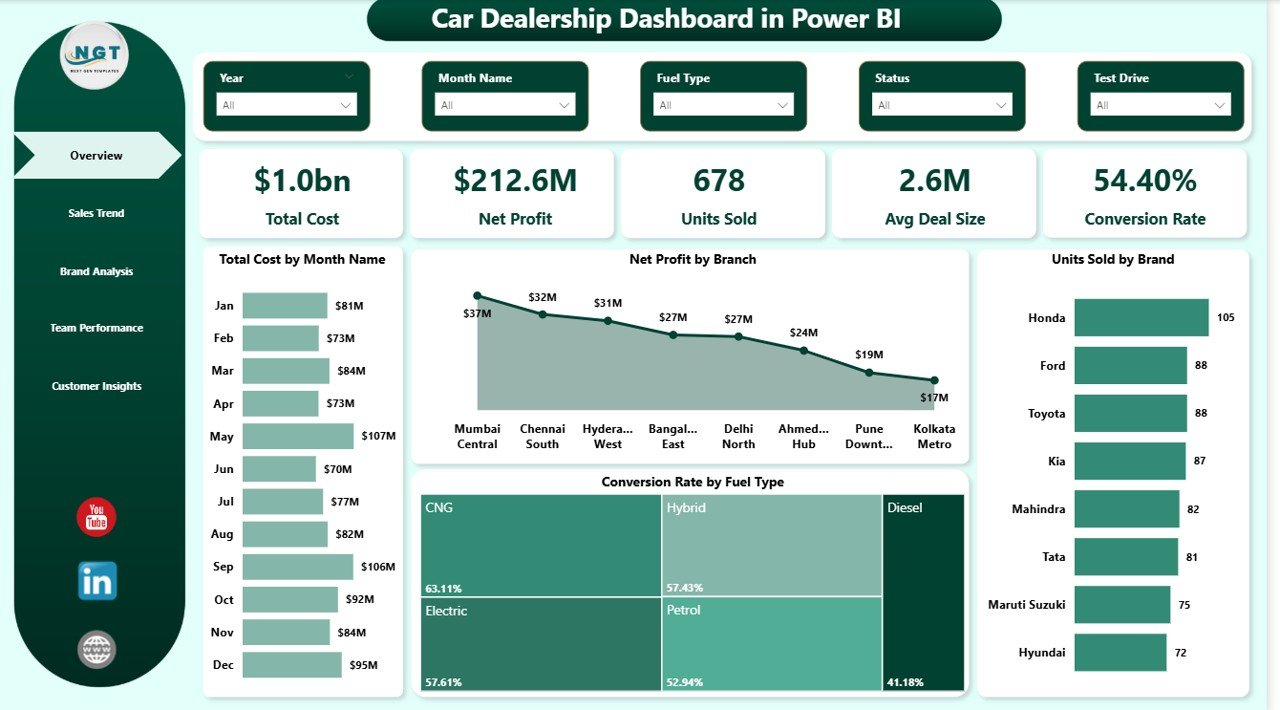
Car Dealership Dashboard in Power BI – Overview Page
2 — Sales Trend
The Sales Trend page analyses performance over time so you can see whether the dealership is growing or slipping.
💵 Avg Deal Size by Month Name — tracks pricing and mix-shift month-by-month to flag discounting pressure before it compounds.
📉 Profit Margin by Month Name — surfaces whether your margin is holding even as volume grows, the leading indicator every dealer-principal watches.
📊 Total Revenue and Net Profit by Month Name — overlays top-line and bottom-line to visualise the revenue-margin gap over the year.
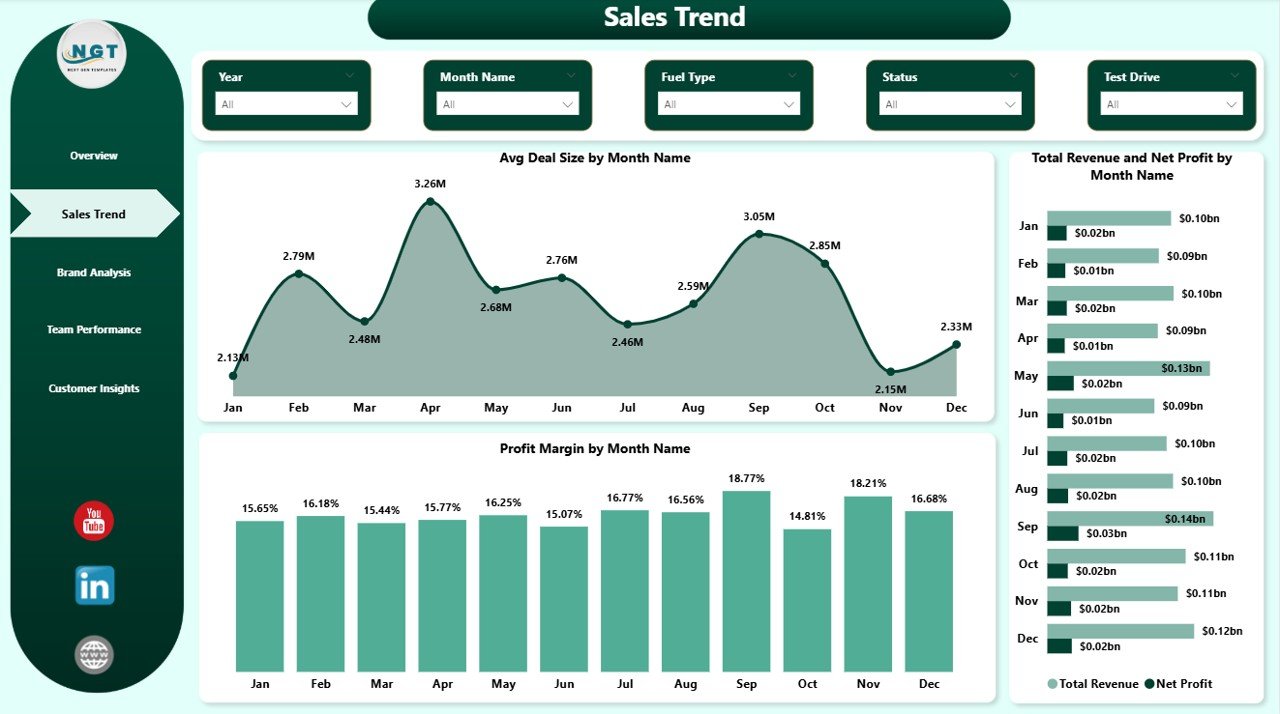
Car Dealership Dashboard in Power BI – Sales Trend
3 — Brand Analysis
The Brand Analysis page ranks your inventory by manufacturer and segment so you know what actually sells and what actually makes money.
🚙 Net Profit by Vehicle Type — compares SUV, Sedan, Hatchback, MUV and Coupe margins to guide inventory mix.
⛽ Total Deals by Fuel Type — splits book by Petrol, Diesel, Electric and Hybrid, essential as EV demand shifts.
💰 Total Revenue and Total Cost by Brand — overlays revenue vs cost per brand so you spot which manufacturers earn their shelf space.
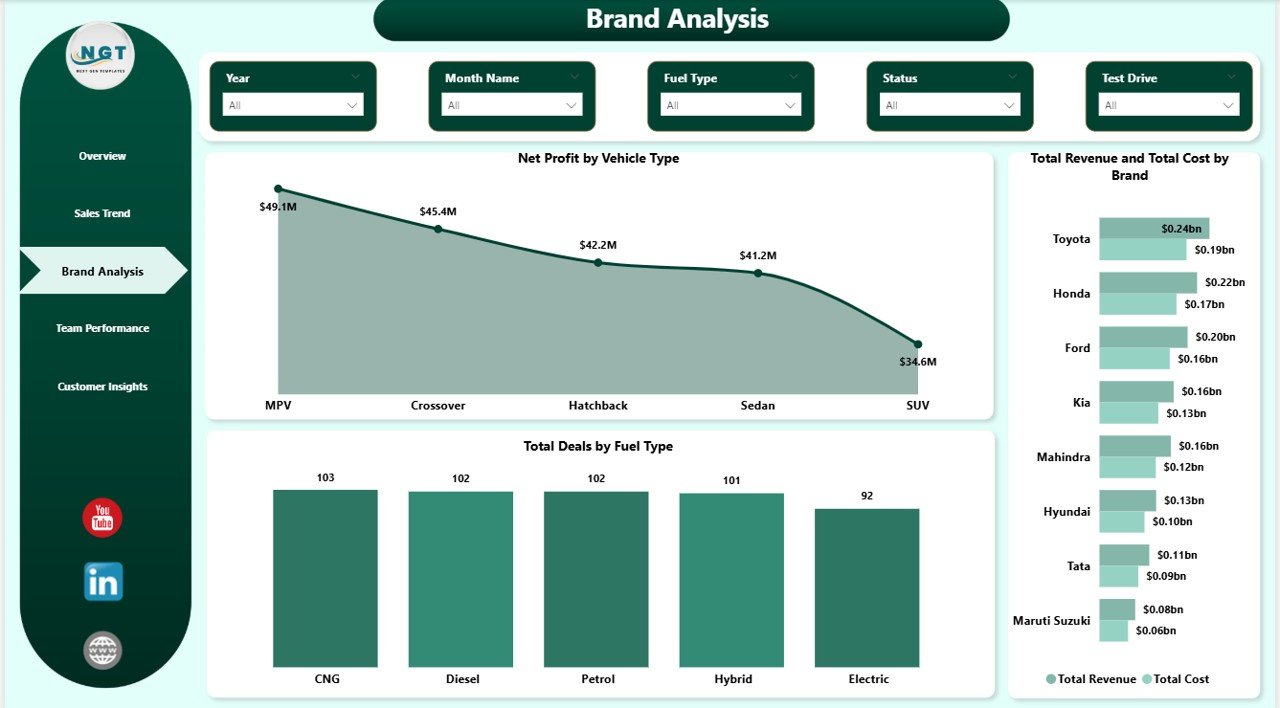
Car Dealership Dashboard in Power BI – Brand Analysis
4 — Team Performance
The Team Performance page puts your sales floor under a microscope — perfect for the weekly sales meeting.
🎯 Conversion Rate by Salesperson — exposes who is closing leads vs who is churning them, the fastest way to find coachable gaps.
💵 Avg Deal Size by Branch — uncovers branches that are under-pricing or over-discounting relative to the group.
🏢 Total Revenue and Net Profit by Branch — shows which outlet manager is actually beating targets on both top-line and bottom-line.
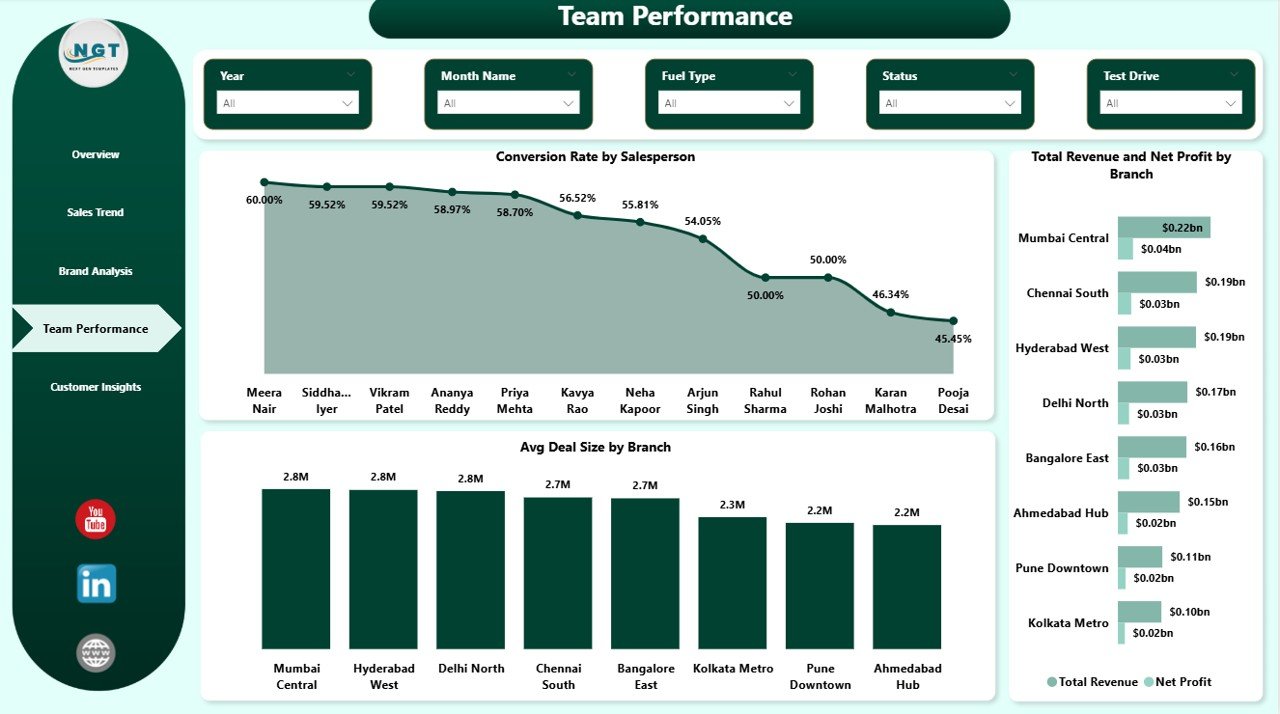
Car Dealership Dashboard in Power BI – Team Performance
5 — Customer Insights
The Customer Insights page uncovers who is buying from you and how they are paying — often the hidden profit driver for F&I managers.
👥 Total Revenue by Customer Type — splits Individual vs Corporate buyers to direct sales effort at the highest-revenue segment.
💳 Total Deals by Payment Method — shows the cash, card, cheque and loan mix, useful for cashflow planning and digital payment adoption.
🏦 Net Profit by Financing Type — compares dealership-financed deals vs bank loans vs cash, because financing margin often beats vehicle margin.
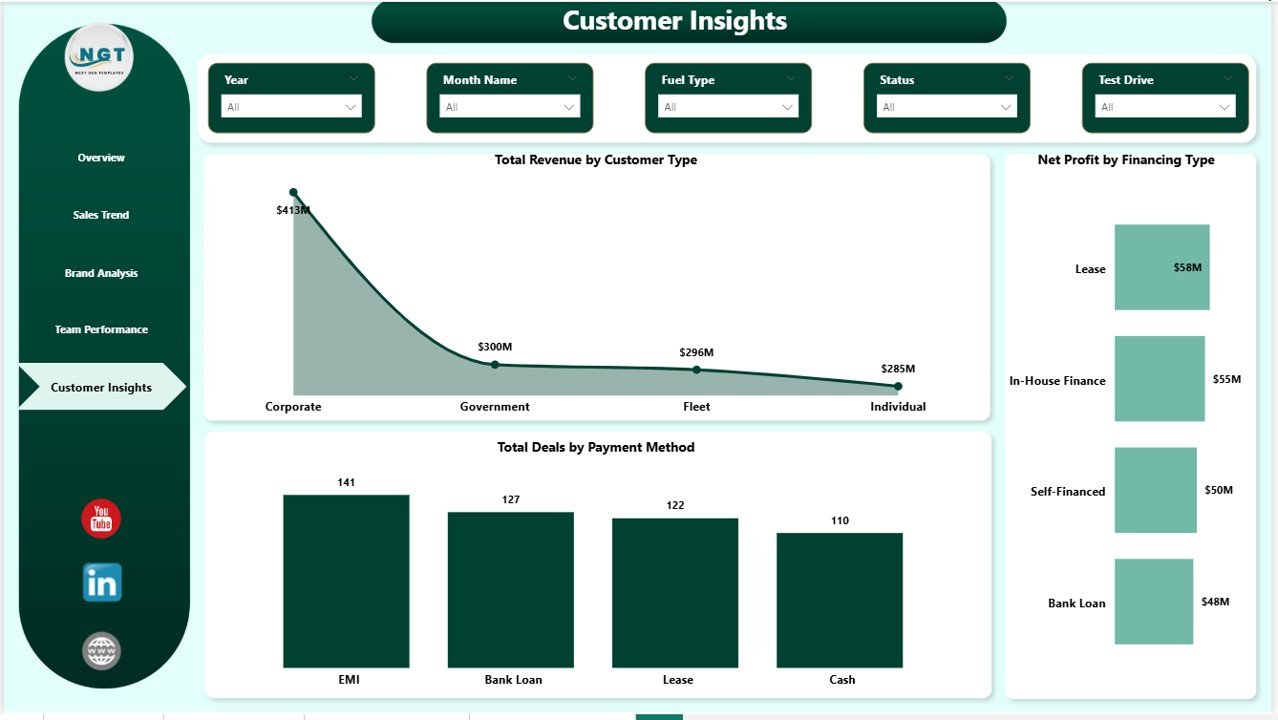
Car Dealership Dashboard in Power BI – Customer Insights
📊 Car Dealership Dashboard in Power BI vs. Tableau Equivalent vs. DealerSocket / VinSolutions — Where This Fits
| Feature | Car Dealership Dashboard in Power BI | Tableau / Qlik Equivalent | DealerSocket / VinSolutions / CDK |
|---|---|---|---|
| Cost | $17.99 one-time | $70 / user / month (Tableau Creator) | $600–1,500 / month / rooftop |
| Platform | Power BI Desktop (free) | Tableau / Qlik Sense | Cloud CRM + DMS |
| Setup time | Under 10 minutes | 1–5 days | 4–8 weeks implementation |
| Multi-brand / multi-branch analysis | ✅ Built-in slicers | ✅ (you build it) | ✅ (paid modules) |
| Margin & Conversion pre-built | ✅ DAX measures included | ✅ (you build it) | ⚠ Requires custom reports |
| Customisable visuals & measures | ✅ Full DAX & model access | ✅ | ❌ Vendor-controlled schema |
| Publish to web with RLS | ✅ Via Power BI Service | ✅ | Cloud only |
| Year-1 cost at 5 users | $17.99 total | $4,200 / year | $36,000–$90,000 |
| Requires DMS integration | ❌ No — standalone | ❌ No | ✅ Required |
For independent dealerships and small multi-brand groups that want margin, conversion and branch-level visibility without paying $600+ per month per rooftop, the Car Dealership Dashboard in Power BI sits in the sweet spot.
👥 Who This Template Is For — and Who It’s Not For
✅ This template is built for:
- Independent used-car and new-car dealers tracking 50–500 sales per month across 1–5 rooftops.
- Multi-brand dealership GMs who want one view of Toyota, Honda, Hyundai performance side-by-side.
- Finance and F&I managers comparing dealership-financed vs bank-loan vs cash deal margins.
- Dealership owners who refuse to pay $600+ per month per rooftop for DealerSocket when a Power BI report will do the same job.
- Business analysts and consultants building dealership Power BI reports for automotive clients.
❌ This template is NOT for:
- Users who do not want to install Power BI Desktop — pick our Car Dealership Dashboard in Excel instead.
- Large franchised auto groups needing integrated DMS (CDK / Reynolds) + CRM + F&I menu selling.
- Teams requiring real-time VIN decoding, OEM incentive feeds or automated credit bureau pulls.
⚙️ How to Use the Car Dealership Dashboard in Power BI
1️⃣ Download and unzip — extract the .pbix file to any folder on your computer.
2️⃣ Install Power BI Desktop (free from Microsoft) if you do not already have it, then double-click the .pbix file to open it.
3️⃣ Replace the sample data — in Power BI Desktop open Transform Data, point the data source at your own dealership sales file and click Close & Apply.
4️⃣ Refresh the report — every KPI card, visual and slicer updates instantly with your own data.
5️⃣ Use slicers and filters on each page to drill into specific brands, branches, fuel types or vehicle segments.
6️⃣ Publish to Power BI Service to share interactive reports with the GM, owner or bank via the web and mobile apps.
💼 Real-World Use Cases
Ramesh runs an independent used-car dealership in Pune with two showrooms and 180 sales a month. He uses the Car Dealership Dashboard in Power BI to compare branch-level profit margin each week, spots that his Wakad branch is under-pricing SUVs by 4%, and coaches his team — without paying ₹50,000 a month for a dealer CRM.
Priya is the F&I manager at a Toyota-Honda multi-brand dealership in Bangalore. She uses the Customer Insights page to see that dealership-financed deals are producing 18% margin vs 11% on cash deals, and reallocates her call-back team to push financing on every walk-in.
David owns a 3-rooftop dealership group in Texas. He was quoted $840 / rooftop / month for DealerSocket Advanced Reporting — $30,240 / year. He replaced the reporting module with the Car Dealership Dashboard in Power BI, kept his DMS and saved $29,000 in year one.
❓ Frequently Asked Questions
What is the Car Dealership Dashboard in Power BI?
The Car Dealership Dashboard in Power BI is a ready-made .pbix template that tracks 5 KPIs and 15+ visuals across 5 analysis pages — Overview, Sales Trend, Brand Analysis, Team Performance and Customer Insights — for independent dealers, multi-brand dealerships and F&I managers who want BI-grade analytics without a monthly SaaS bill.
Which KPIs does the Car Dealership Dashboard in Power BI track?
The Car Dealership Dashboard in Power BI tracks 5 header KPIs: Total Cost, Net Profit, Units Sold, Avg Deal Size and Conversion Rate. Derived DAX measures include Profit Margin %, Total Revenue and Net Profit by Brand, Branch, Salesperson, Vehicle Type, Fuel Type, Customer Type, Payment Method and Financing Type.
Do I need a paid Power BI licence to use this dashboard?
No. You can open, edit and refresh the Car Dealership Dashboard in Power BI using Power BI Desktop, which is free from Microsoft. A paid Power BI Pro or Premium licence is only needed to publish the report to Power BI Service and share it with colleagues.
How does this compare to DealerSocket or VinSolutions?
The Car Dealership Dashboard in Power BI is a one-time $17.99 analytics tool. DealerSocket and VinSolutions are $600–1,500 per month per rooftop cloud CRMs with DMS integration, VIN decoding and F&I workflows. This dashboard replaces the reporting layer, not the full CRM — ideal for independents that already track leads elsewhere.
Will this work for used-car, new-car and EV dealerships?
Yes. The Car Dealership Dashboard in Power BI works for used-car, new-car, EV and mixed inventory dealerships. Brand, Vehicle Type, Fuel Type and Financing Type dimensions handle every segment — add a Stock Type column if you want an explicit new vs used split.
How long does setup take?
Setup takes under 10 minutes. Open the .pbix file in Power BI Desktop, point the data source at your own sales records, click Close & Apply and the Car Dealership Dashboard in Power BI refreshes with your real data across all 5 pages.
Can I add my own custom KPIs to the dashboard?
Yes. The Car Dealership Dashboard in Power BI is fully editable. Add new columns to your data source, create new DAX measures and drop new visuals on any page. Because measures are centralised, custom KPIs slot in without breaking the existing ones.
👤 About the Author
Built by PK — Microsoft Certified Professional with 15+ years of Excel, Google Sheets and Power BI experience. Founder of NextGenTemplates, reaching 300K+ subscribers across YouTube channels (@PK-AnExcelExpert, @NextGenTemplates, @NeoTechNavigators). Every template is hand-built and tested before release.
🔗 Explore Related Templates
📌 Car Dealership Dashboard in Excel — Same dealership analytics in a pivot-powered Excel workbook for Office 365 users.
📌 Automotive KPI Scorecard in Google Sheets — Monthly MTD/YTD scorecard format for dealership leadership reviews.
📌 Used Car Sales KPI Dashboard in Google Sheets — Google Sheets KPI tracker for used-car operators.
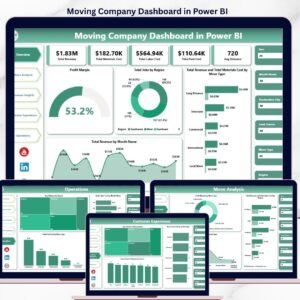
📌 Moving Company Dashboard in Power BI — Service-business Power BI dashboard for movers and logistics operators.
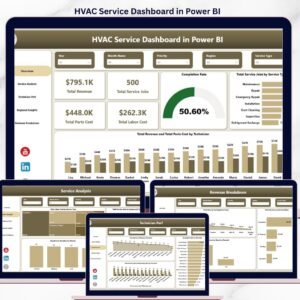
📌 HVAC Service Dashboard in Power BI — Field-service analytics for HVAC contractors tracking technicians and jobs.
Browse the full range of Power BI Dashboard Templates across every industry.
📖 Click here to read the Detailed Blog Post
Watch the step-by-step video tutorial:
🎥 Visit our YouTube channel for step-by-step video tutorials
👉 YouTube.com/@NextGenTemplates
📅 Last updated: April 2026


Reviews
There are no reviews yet.