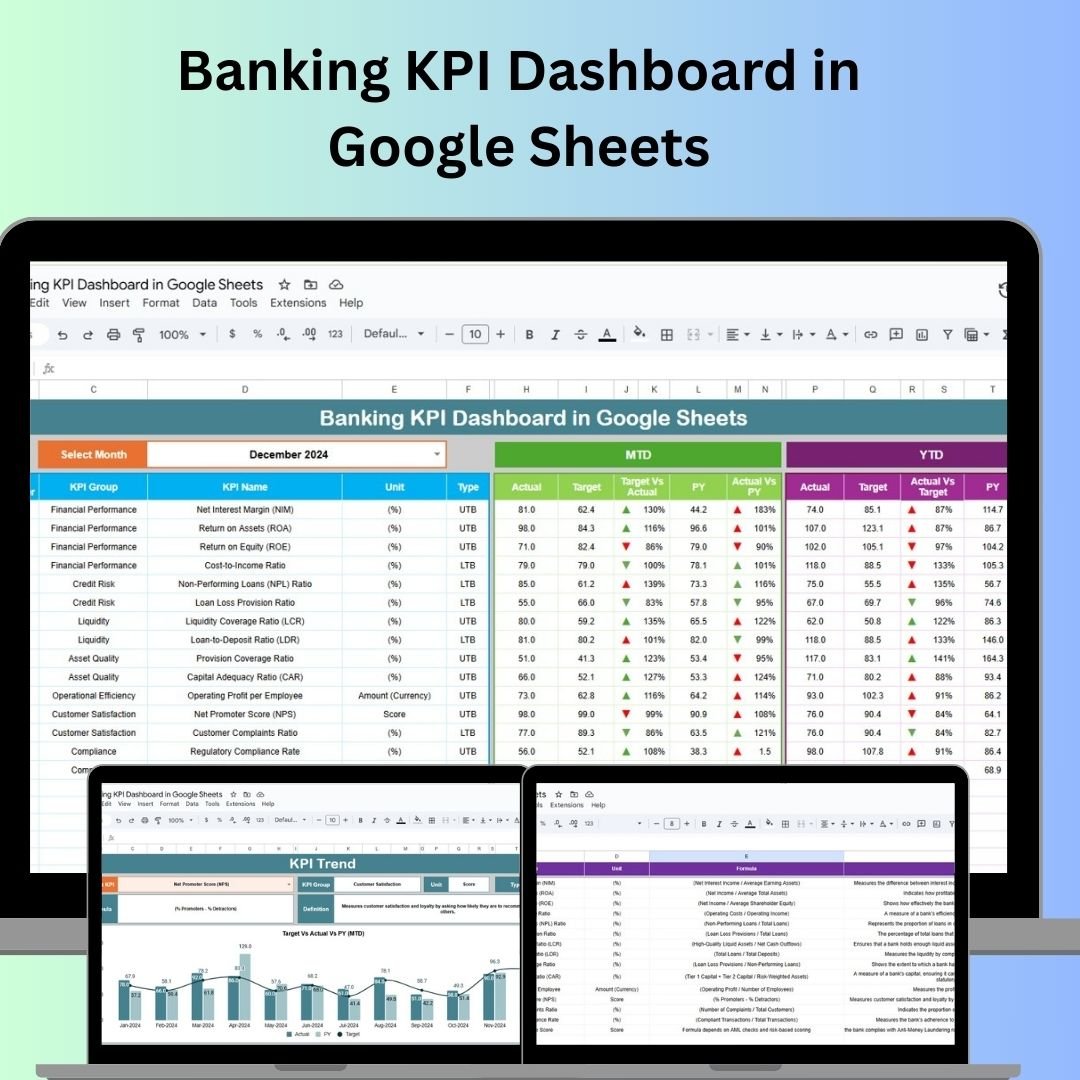


The Banking KPI Dashboard in Google Sheets is an essential tool designed for financial institutions to monitor, track, and optimize key performance indicators (KPIs) within the banking sector. This customizable dashboard enables you to track essential metrics like loan performance, deposit growth, asset quality, and profitability, all within an intuitive and accessible Google Sheets template.

Key Features of the Banking KPI Dashboard in Google Sheets
📊 Comprehensive KPI Tracking
-
Track Key Metrics: Monitor essential KPIs such as loan-to-deposit ratio, non-performing assets (NPA), return on assets (ROA), cost-to-income ratio (CIR), and capital adequacy ratio (CAR).
-
Customizable Metrics: Modify or add KPIs to reflect your organization’s unique needs.
📈 Visual Data Representation
-
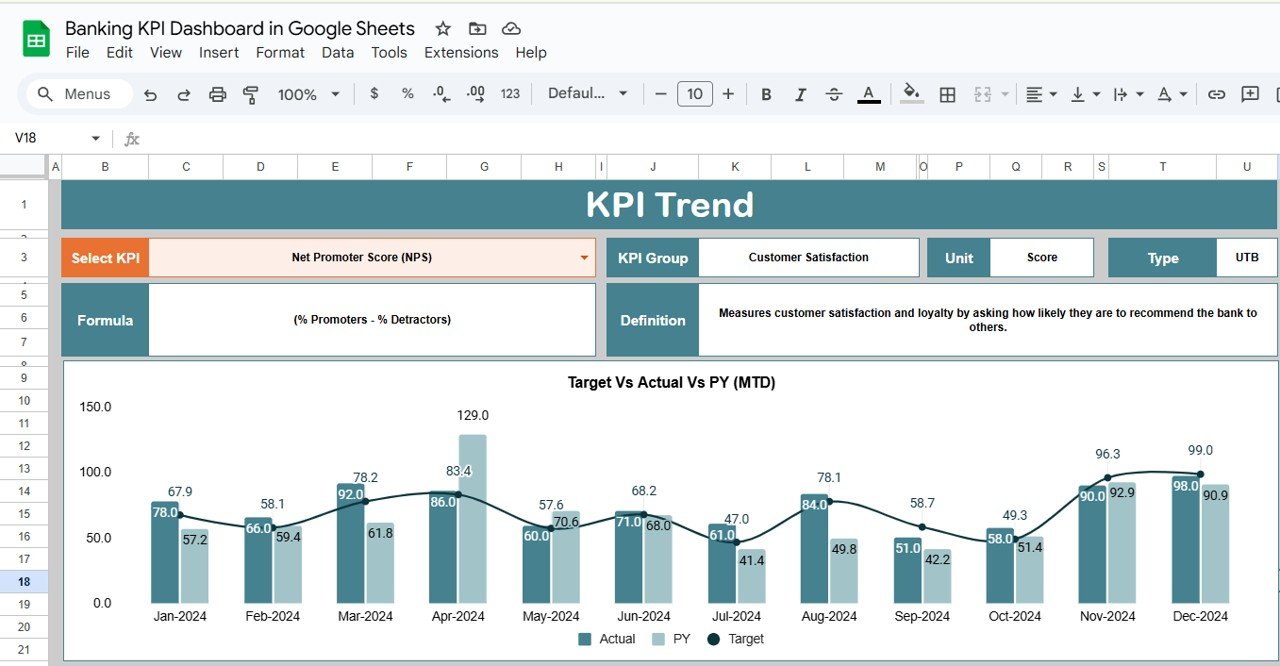
Charts & Graphs: Easily visualize key banking metrics with interactive charts and graphs to identify trends and performance gaps.
-
Trend Analysis: Track your bank’s performance over time and identify areas that require immediate attention.
💡 User-Friendly Interface
-
Intuitive Navigation: The dashboard is designed for ease of use, making it accessible to both technical and non-technical users.
-
Easy Setup: Quick to set up and customize according to your specific banking KPIs and reporting requirements.
🔧 Data Integration
-
Automated Data Updates: Seamlessly integrate data from external sources for real-time KPI tracking and analysis.
-
Report Generation: Generate detailed performance reports to assess KPIs and provide strategic insights to senior management.
Benefits of Using the Banking KPI Dashboard
✅ Improved Decision-Making
Access real-time data to make informed decisions regarding bank operations, risk management, and strategic planning.
✅ Increased Efficiency
Streamline the monitoring of KPIs to assess operational performance quickly and implement improvements where necessary.
✅ Cost Reduction
Track cost-related metrics such as cost-to-income ratio to identify areas where you can reduce operational costs without compromising service quality.
✅ Regulatory Compliance
Ensure that your bank adheres to industry regulations by monitoring compliance metrics like capital adequacy and non-performing assets.
How to Use the Banking KPI Dashboard in Google Sheets
-
Download the Template: Download the Banking KPI Dashboard template and save it to your Google Drive.
-
Input Data: Enter your banking performance data such as loan details, deposits, and profitability into the dashboard.
-
Customize KPIs: Modify the dashboard to track KPIs that are specific to your bank’s operations and strategic goals.
-
Monitor and Analyze: Use the dashboard to monitor performance, analyze trends, and assess the overall health of your financial institution.
-
Make Data-Driven Decisions: Use the insights from the dashboard to improve efficiency, profitability, and compliance, and adjust strategies accordingly.
By using the Banking KPI Dashboard in Google Sheets, financial institutions can track and optimize their operations, improve decision-making, and boost profitability through data-driven insights.
Click here to read the Detailed blog post
Banking KPI Dashboard in Google Sheets
Visit our YouTube channel to learn step-by-step video tutorials
YouTube.com/@NeotechNavigators


Reviews
There are no reviews yet.