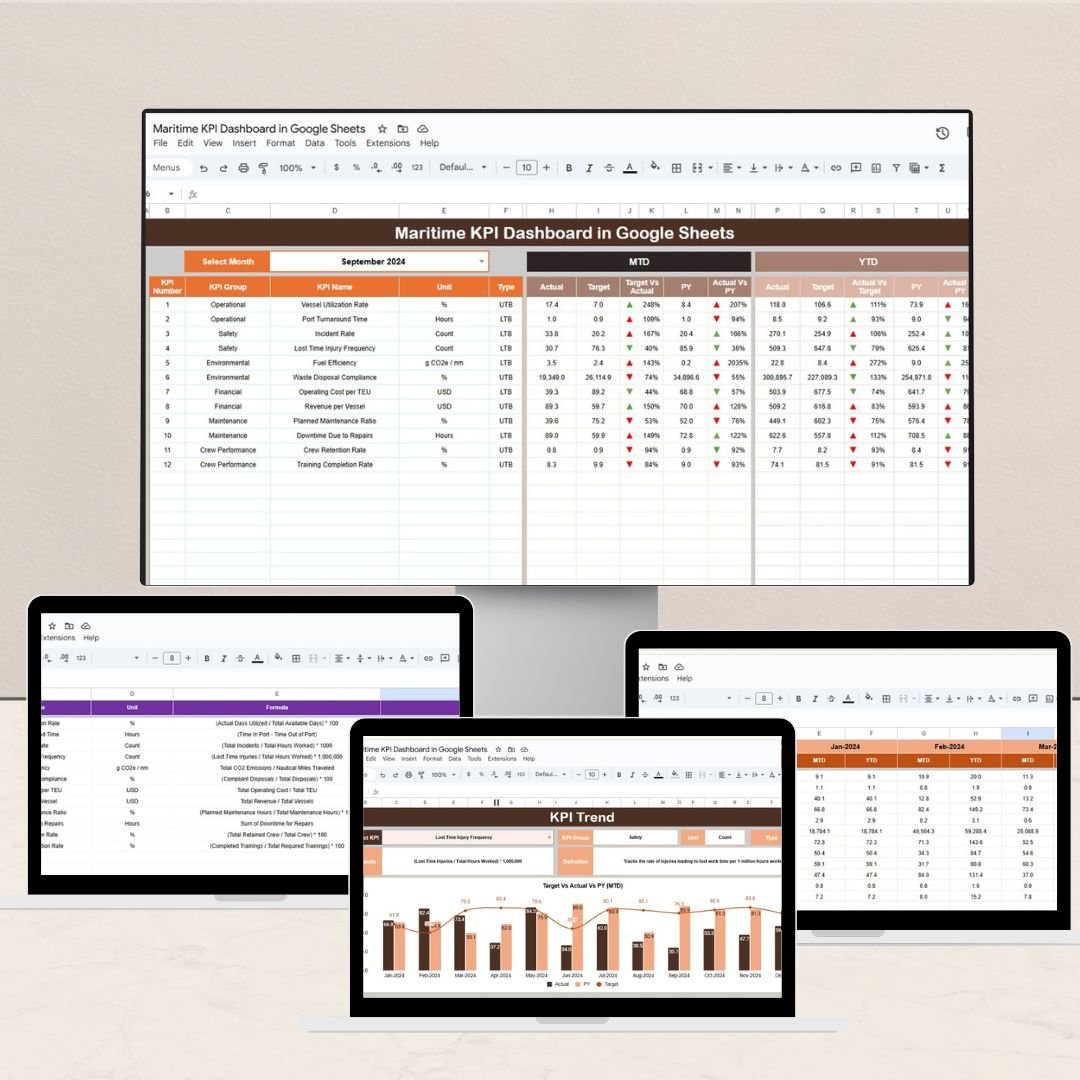
The Maritime KPI Dashboard in Google Sheets is a comprehensive tool designed to help maritime professionals and organizations efficiently monitor, analyze, and optimize key performance indicators (KPIs) related to maritime operations. This intuitive and customizable dashboard helps users track vessel performance, fuel efficiency, maintenance schedules, and more, all within an accessible Google Sheets template.
Key Features of the Maritime KPI Dashboard in Google Sheets
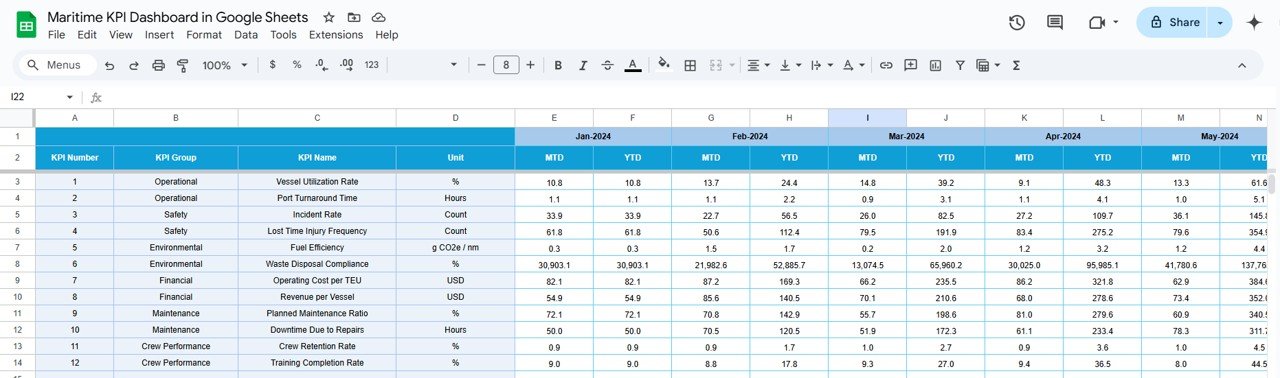
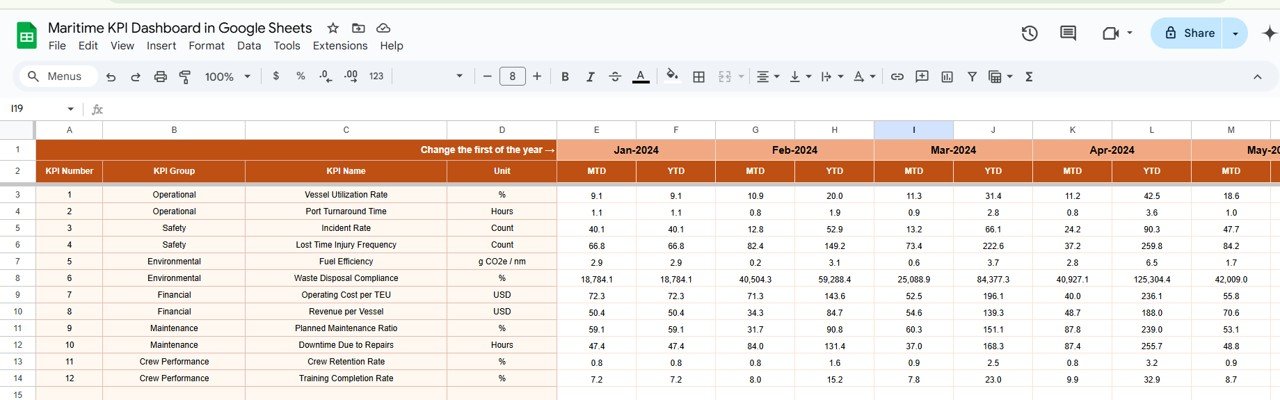
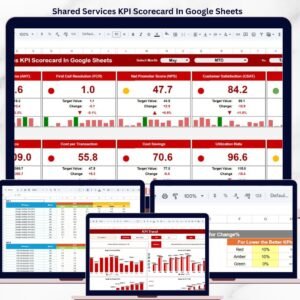
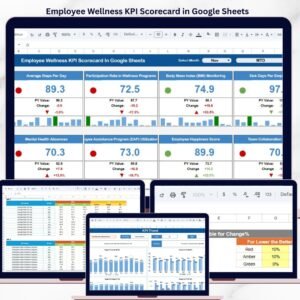
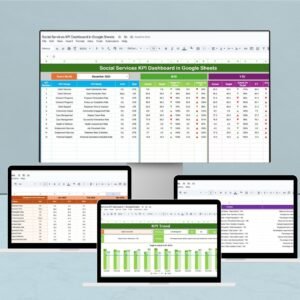
📊 Comprehensive KPI Tracking
-
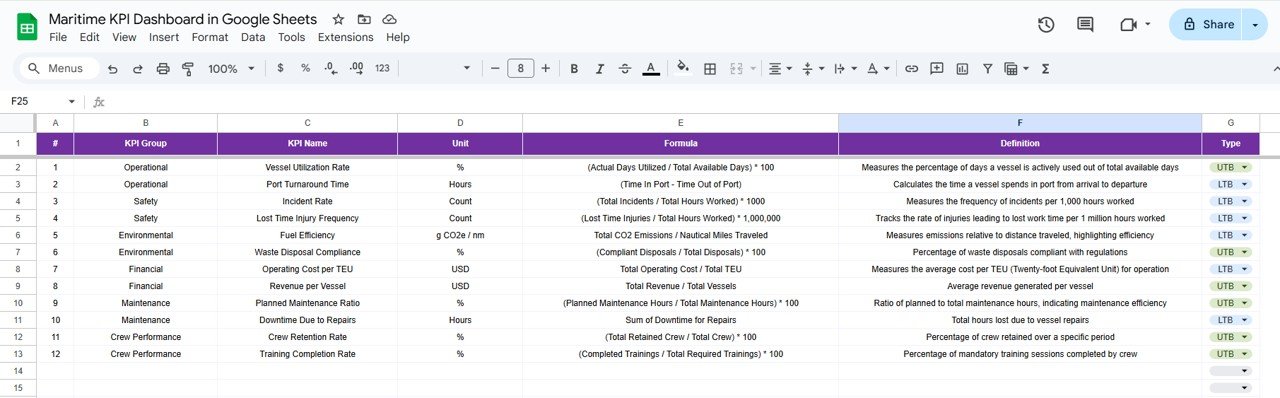
Track Essential Metrics: Monitor important KPIs such as vessel speed, fuel consumption, maintenance schedules, port turnaround times, and more.
-
Real-Time Data: Keep the dashboard updated with real-time data to ensure accurate insights for decision-making.
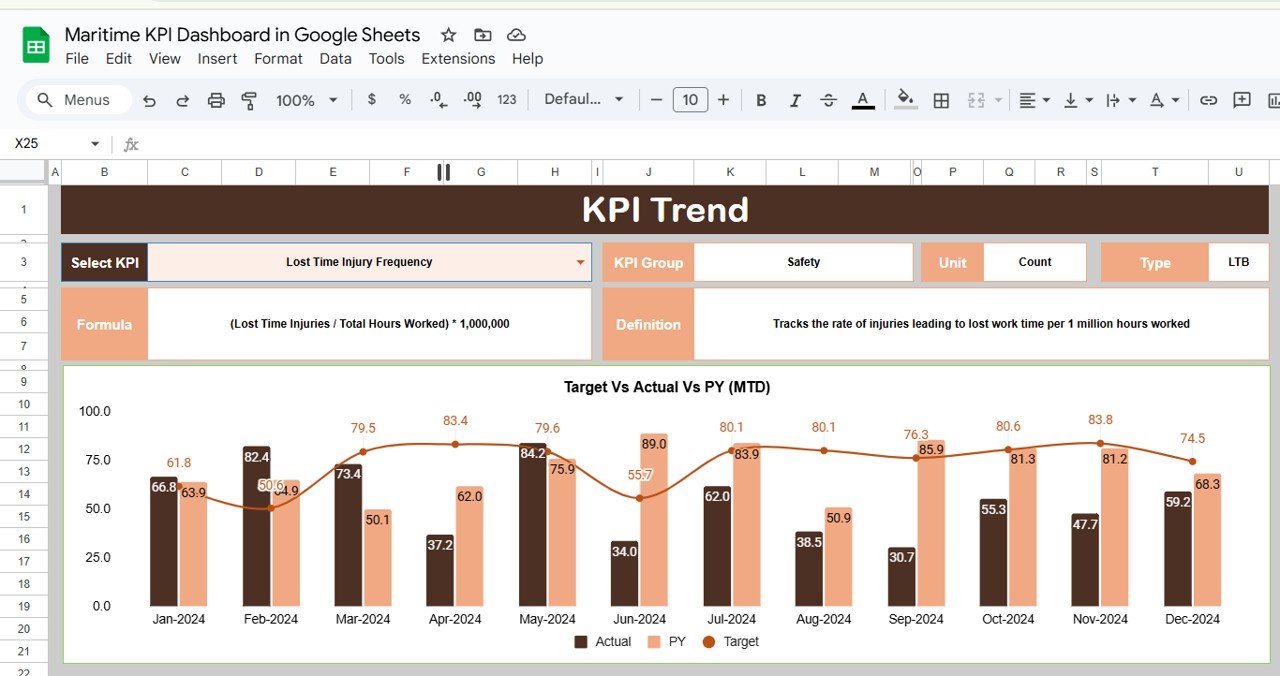
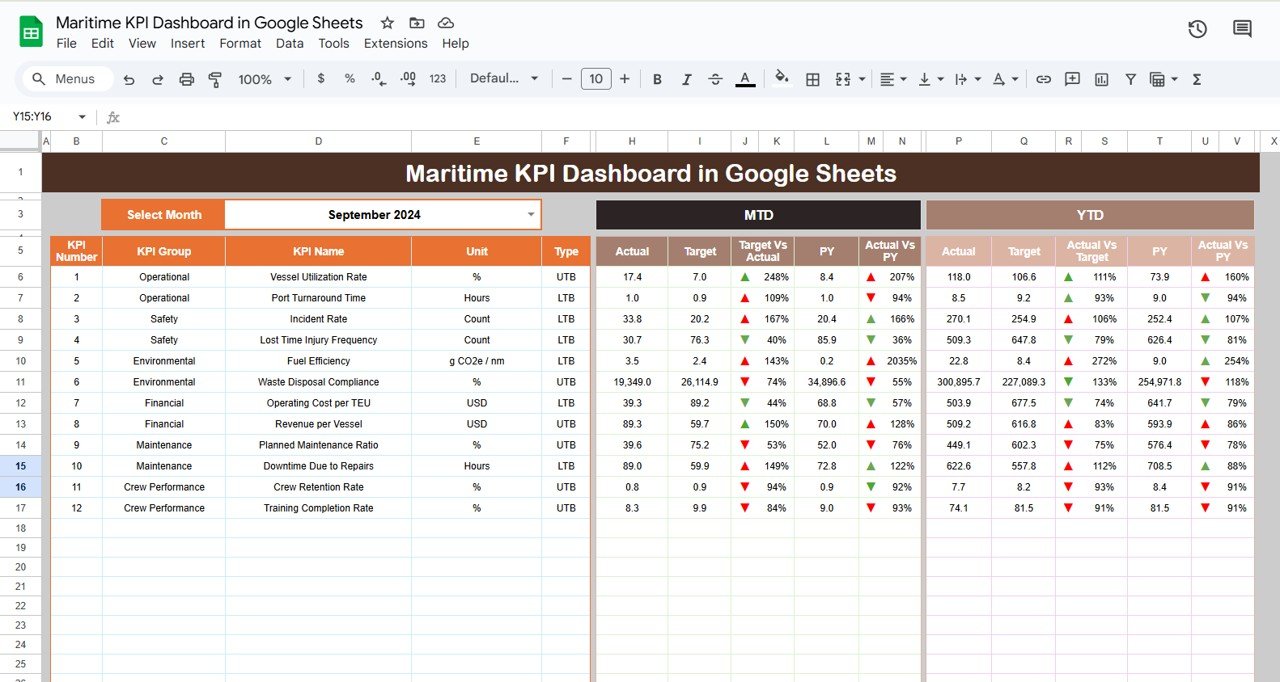
📈 Customizable Dashboard
-
Tailored to Your Needs: Customize the dashboard to reflect your specific maritime operations and the KPIs that matter most to your business.
-
Visual Tools: Use charts and graphs to visualize trends, compare performance, and identify areas for improvement.
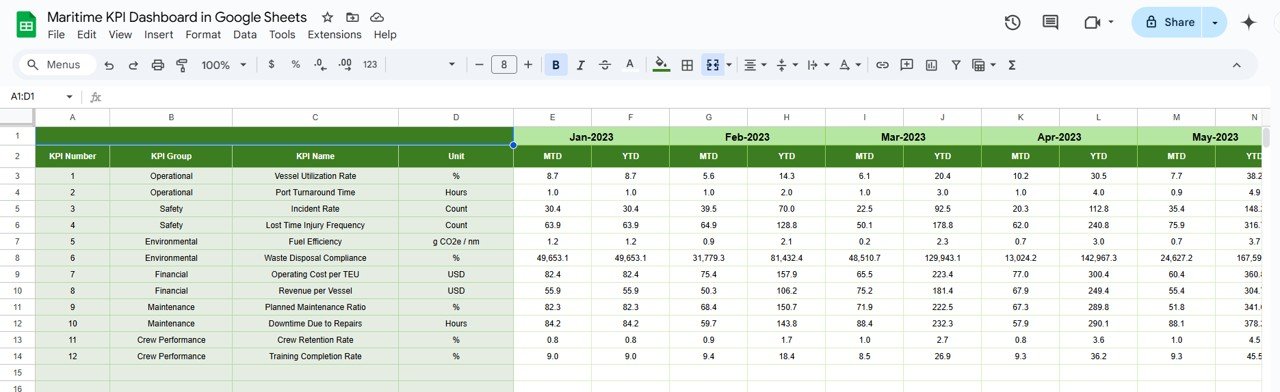
🔧 Data Integration
-
Easily Integrate Data: Seamlessly integrate data from various sources, ensuring that the dashboard reflects a complete view of your maritime operations.
-
Simplify Reporting: Generate reports based on up-to-date KPIs to share with stakeholders and senior management.
⏱️ User-Friendly Interface
-
Simple to Use: Navigate the dashboard with ease, thanks to its intuitive and user-friendly design.
-
Quick Setup: Get started quickly by inputting data and modifying KPIs to fit your specific needs.
Benefits of Using the Maritime KPI Dashboard
✅ Informed Decision-Making
Gain access to real-time insights into key metrics, empowering your team to make informed decisions that improve efficiency and reduce costs.
✅ Improved Operational Efficiency
Track and optimize performance by identifying bottlenecks and areas that require attention in real-time.
✅ Cost Savings
By monitoring fuel consumption, maintenance schedules, and other key metrics, you can reduce operational costs and improve profit margins.
✅ Regulatory Compliance
Ensure that your maritime operations are in compliance with industry regulations by consistently tracking and reporting relevant KPIs.
How to Use the Maritime KPI Dashboard in Google Sheets
-
Download the Template: Download the Maritime KPI Dashboard template and store it on your Google Drive.
-
Input Data: Enter your vessel, fuel, maintenance, and performance data into the designated sections.
-
Customize KPIs: Adjust the dashboard to fit your specific operational needs, adding or removing KPIs as necessary.
-
Analyze Data: Use the visual tools to analyze performance, track trends, and identify areas for improvement.
-
Implement Strategies: Take actionable insights from the dashboard to optimize your maritime operations, reduce costs, and improve overall performance.
By using the Maritime KPI Dashboard in Google Sheets, maritime organizations can enhance their operational efficiency, ensure regulatory compliance, and make data-driven decisions to improve the performance of their fleet.
Click here to read the Detailed blog post
Maritime KPI Dashboard in Google Sheets
Visit our YouTube channel to learn step-by-step video tutorials
YouTube.com/@NeotechNavigators


Reviews
There are no reviews yet.