Managing architectural projects effectively requires constant tracking of key performance indicators (KPIs) to ensure that deadlines are met, budgets are adhered to, and quality standards are maintained. The Architecture KPI Dashboard in Google Sheets is the perfect tool to help you do just that. This customizable, ready-to-use template is built to help architects monitor critical data and streamline project management. Whether you are working on one project or juggling multiple, this tool is designed to keep your projects on track.
Key Features of the Architecture KPI Dashboard 🛠️
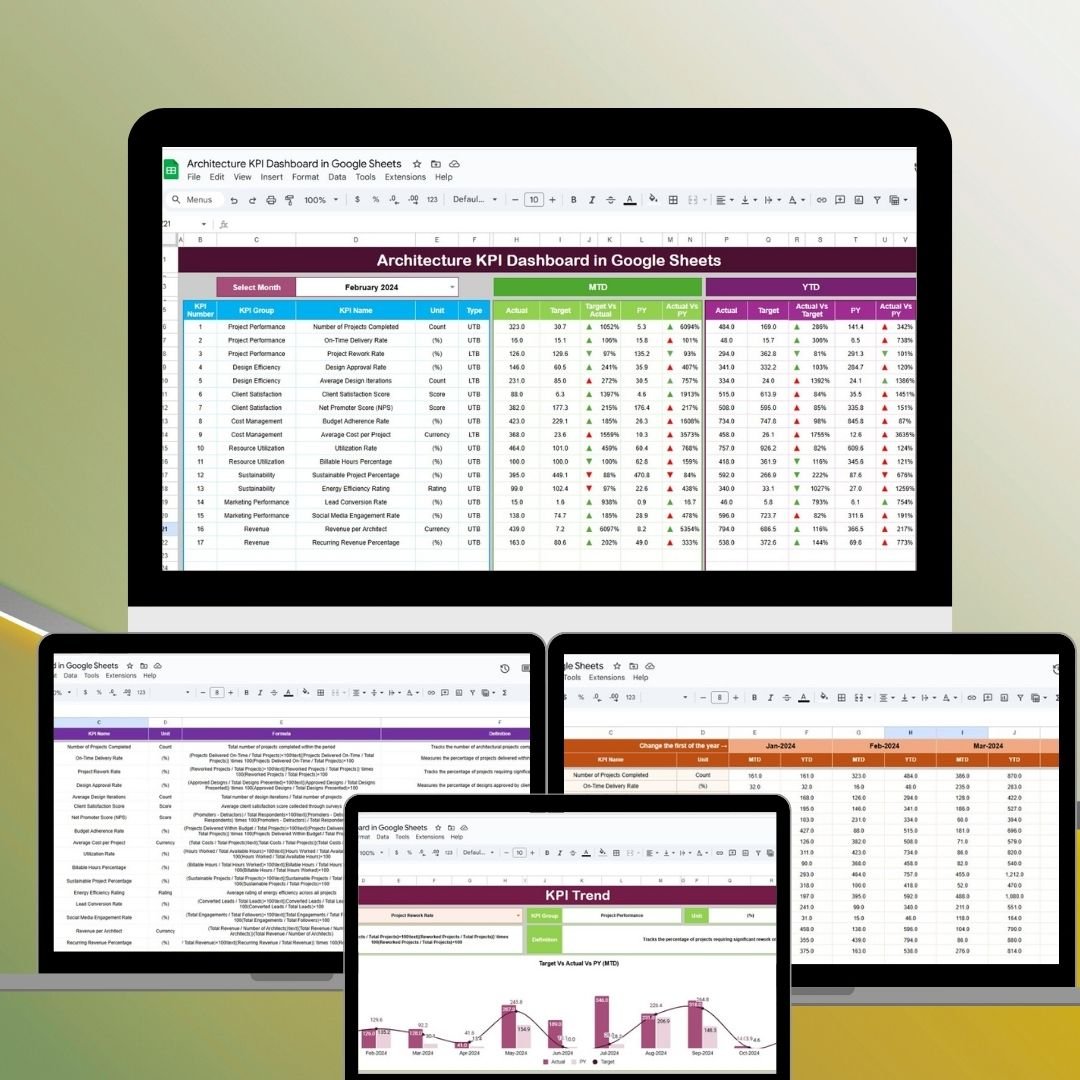
The Architecture KPI Dashboard is packed with essential features designed for ease of use and efficiency:
-
Real-Time Data Tracking: Stay up-to-date with real-time data updates. The dashboard automatically reflects new data entered, ensuring you always have the latest information.
-
Customizable for Your Projects: Whether you’re focusing on budget tracking, project completion, or client satisfaction, the dashboard is fully customizable to meet your specific needs.
-
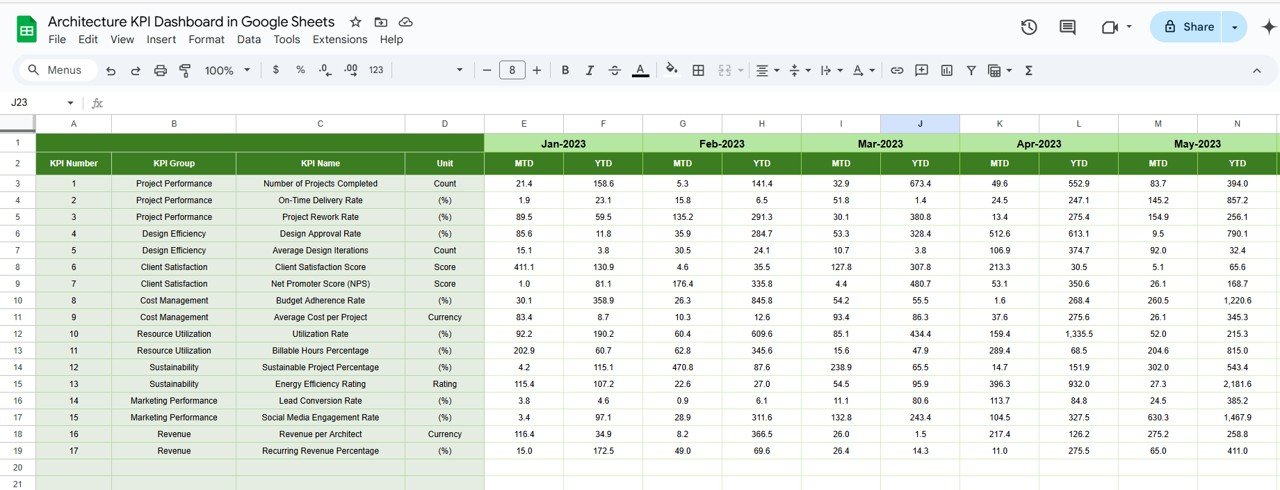
Comprehensive Overview: Get a detailed view of both Month-to-Date (MTD) and Year-to-Date (YTD) data. Easily compare current performance with previous year data to spot trends and issues.
-
Intuitive User Interface: With dropdown menus for easy KPI selection and month adjustments, this dashboard is simple to navigate even for those with minimal technical expertise.
-
Collaboration Made Simple: Since it’s hosted on Google Sheets, you can easily share the dashboard with your team and collaborate in real-time, no matter where they are.
-
Cost-Effective Solution: You won’t need any additional software or licenses, as the dashboard is built within Google Sheets, making it an affordable solution for small to large architecture firms.
What’s Inside the Architecture KPI Dashboard 📋
The dashboard includes six vital worksheets to ensure you have everything you need:
-
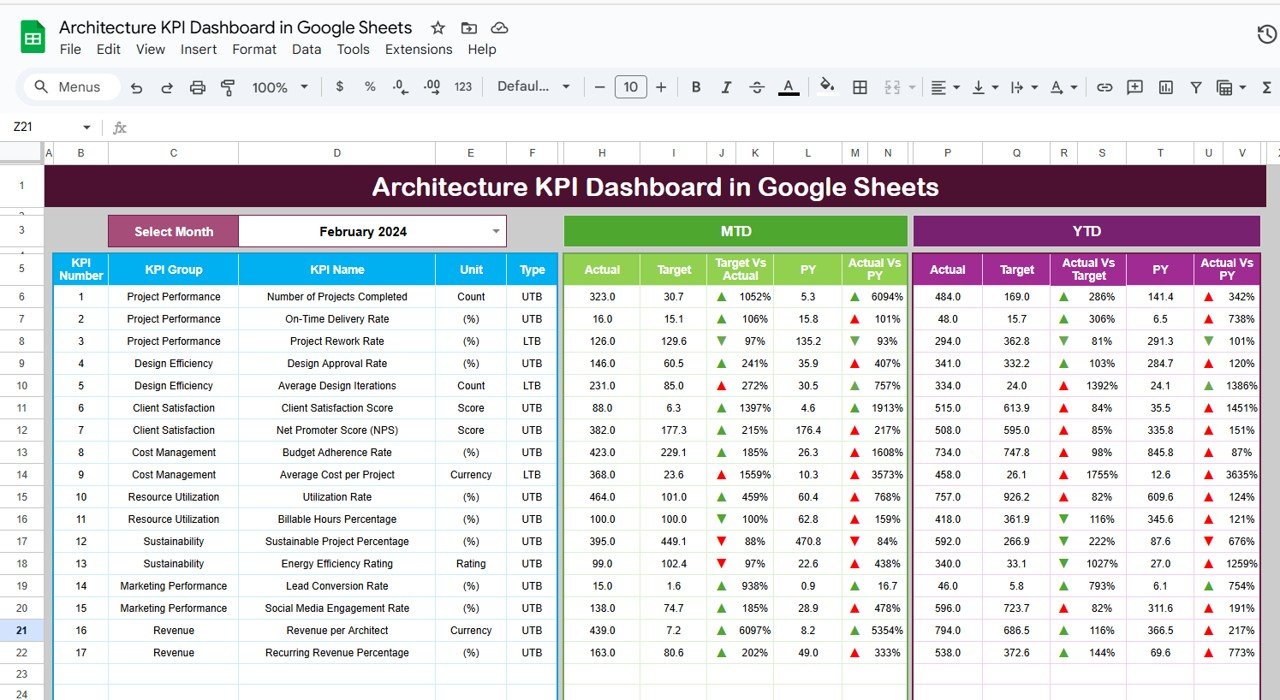
Dashboard Sheet Tab: This is the main sheet where you can track KPIs like MTD Actual, Target, and Previous Year data. With dropdown menus, the data updates automatically when you select a month.
-
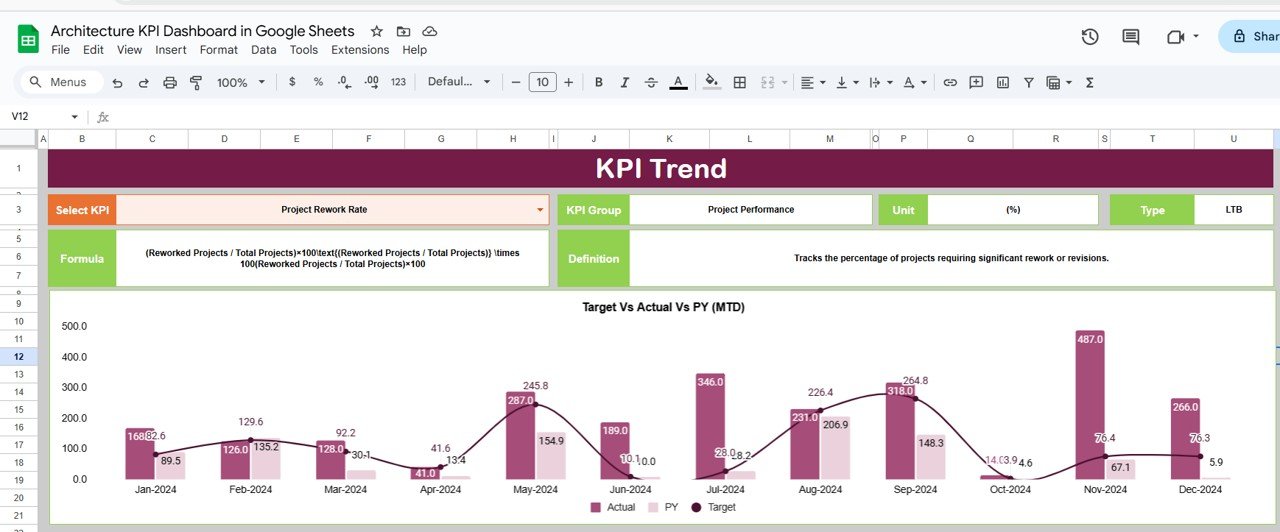
KPI Trend Sheet Tab: Here, you can track individual KPIs, view their trends, and see how they are calculated. You can also see if a KPI is ‘Lower the Better’ or ‘Upper the Better’ for accurate tracking.
-
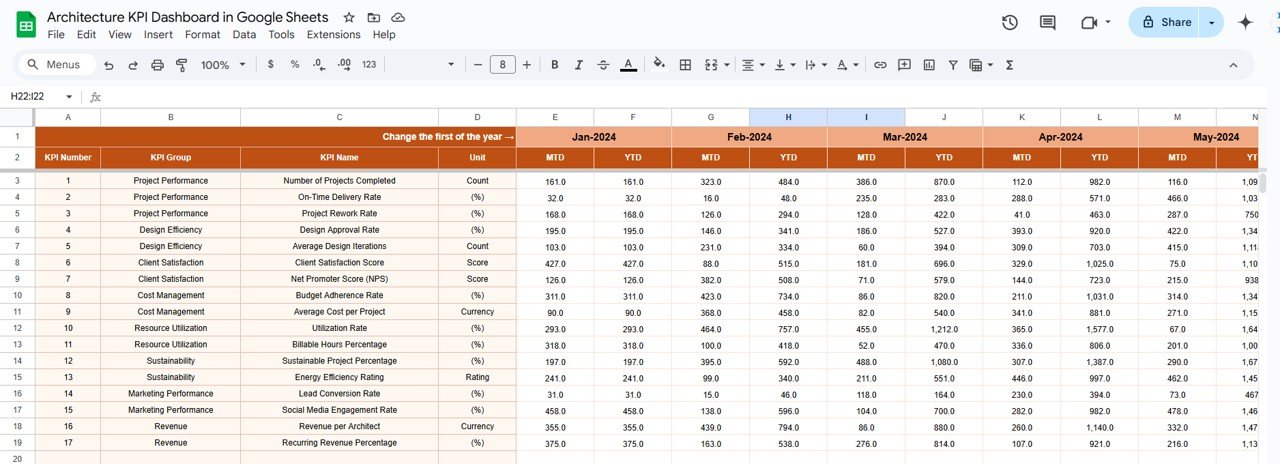
Actual Numbers Sheet Tab: Enter actual performance numbers for MTD and YTD and track progress month by month.
-
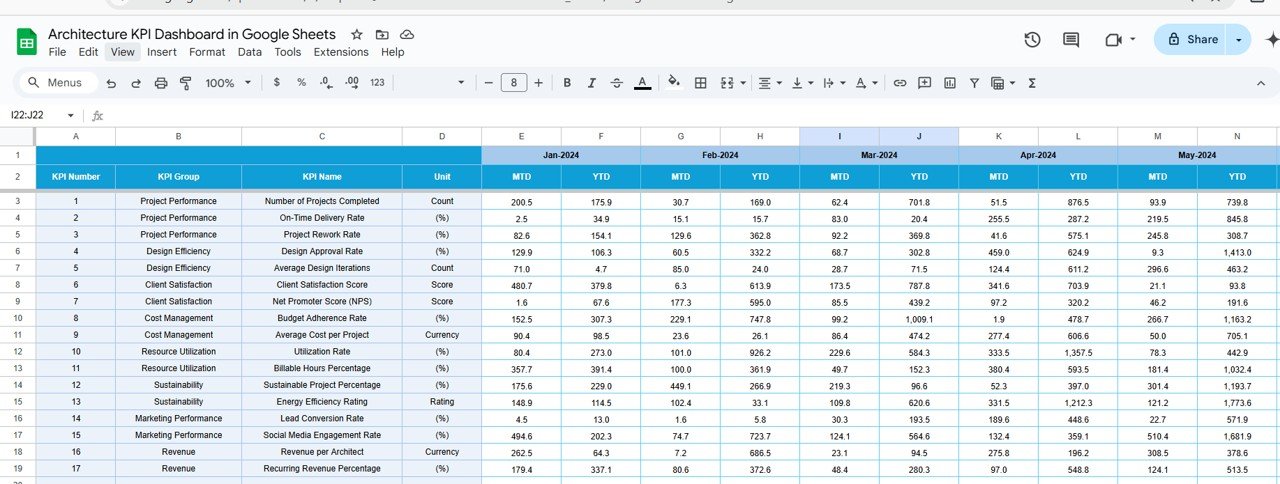
Target Sheet Tab: Set target numbers for each KPI, so you can compare performance against your set goals.
-
Previous Year Numbers Sheet Tab: Track year-over-year performance and compare current data with the same period from the previous year.
-
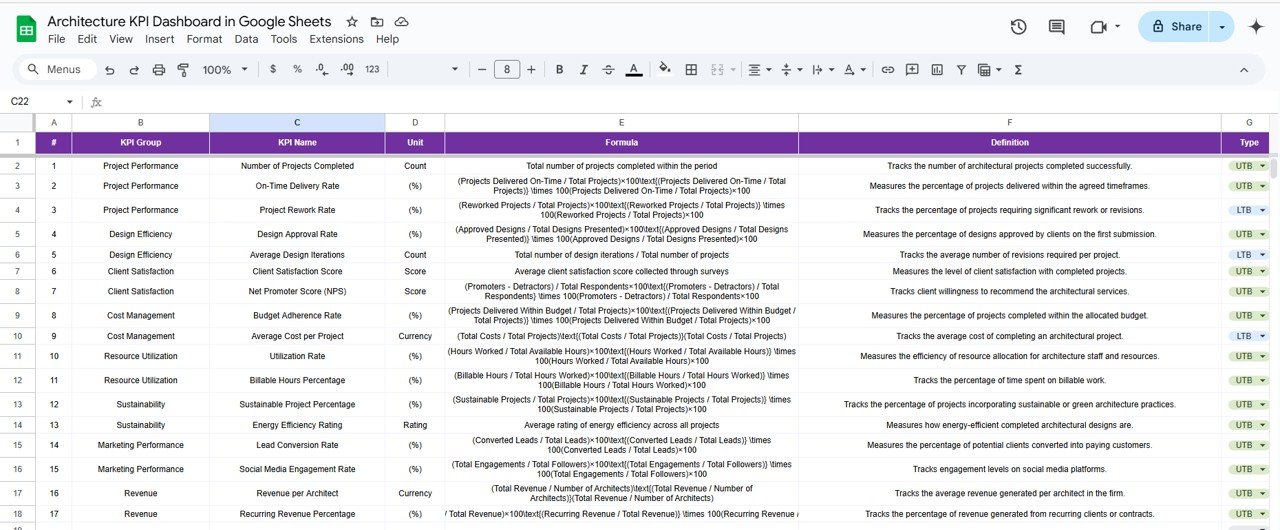
KPI Definition Sheet Tab: This sheet explains each KPI in detail, helping users understand its calculation method, units, and significance.
How to Use the Architecture KPI Dashboard 🖥️
Using the Architecture KPI Dashboard is straightforward:
-
Open the template in Google Sheets and start entering your project data for each KPI.
-
Select the month from the dropdown menu on the main dashboard sheet to automatically update the entire dashboard.
-
Enter actual numbers for MTD and YTD on the corresponding sheets, comparing performance with your targets.
-
Use conditional formatting to highlight areas that need attention – color-coded arrows will show you if a KPI is on track.
-
Collaborate with your team in real-time by sharing the dashboard. You can even set permissions to control who can edit or view the data.
Who Can Benefit from This Architecture KPI Dashboard 👥
This dashboard is ideal for:
-
Architectural Firms: Whether you’re managing large-scale projects or smaller, individual designs, this tool will help you stay organized and on top of performance.
-
Project Managers: Track timelines, budgets, and project progress to ensure everything runs smoothly.
-
Freelance Architects: Manage your projects efficiently with an easy-to-use and cost-effective solution.
-
Teams and Collaborators: Since the dashboard allows for real-time collaboration, teams can update data and track project progress together.
Click here to read the Detailed blog post


Reviews
There are no reviews yet.