

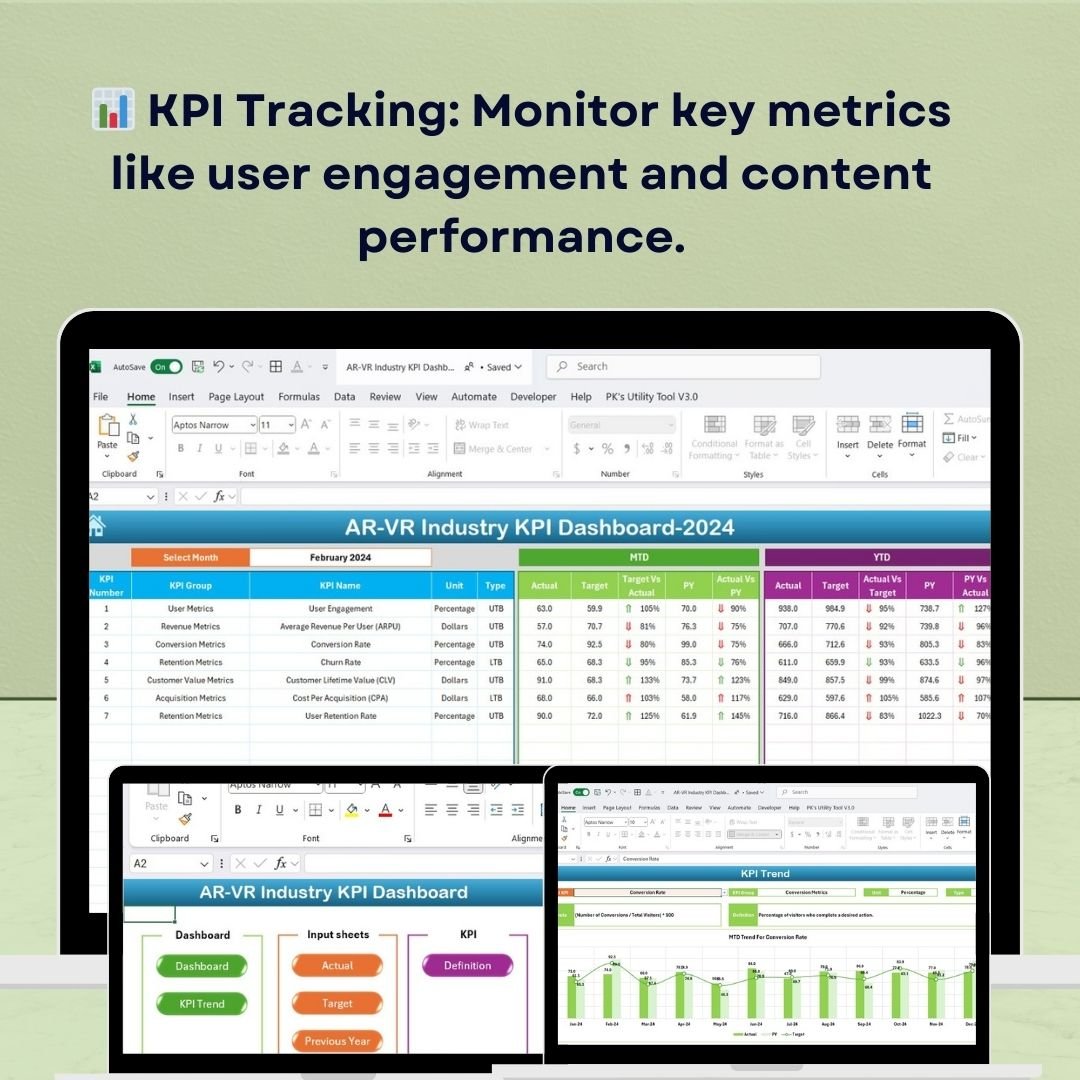



The AR-VR Industry KPI Dashboard in Excel is a dynamic tool designed to help businesses in the augmented reality (AR) and virtual reality (VR) sectors track and analyze their key performance indicators (KPIs). This Excel-based dashboard provides valuable insights into critical metrics such as user engagement, content performance, revenue generation, and customer satisfaction, enabling businesses to optimize their AR/VR products and services.
With the rapid growth of AR and VR technologies, this dashboard helps businesses in these industries stay ahead of the competition by providing real-time data on the performance of their applications, user behavior, and financial performance. By utilizing this KPI dashboard, businesses can identify growth opportunities, enhance customer experiences, and make informed decisions that improve their bottom line.
Key Features of the AR/VR Industry KPI Dashboard in Excel
📊 Comprehensive KPI Tracking
Monitor key metrics such as user engagement, average session duration, content interaction, and app usage frequency. Gain a comprehensive view of your AR/VR app’s performance across various stages.
📈 User Engagement Metrics
Track user engagement with your AR/VR applications, including the number of active users, session frequency, and interaction rates. This helps in evaluating the effectiveness of your AR/VR experiences.
💡 Content Performance Analysis
Measure how well your AR/VR content performs. Track metrics like content views, user feedback, and conversion rates, and use these insights to refine your content and strategy.
📅 Revenue & Financial Tracking
Track your revenue streams from your AR/VR applications, including in-app purchases, subscriptions, or licensing. Monitor financial KPIs such as customer acquisition cost (CAC) and lifetime value (LTV) to assess profitability.
⏱ Time-Based Performance Monitoring
Monitor AR/VR app performance over different time periods (daily, weekly, monthly). Track trends and compare performance across different periods to identify areas for improvement and growth.
🔑 Real-Time Data Integration
Integrate real-time data from your AR/VR platforms to provide up-to-date insights. This ensures that the information is accurate and can be used for making timely business decisions.
Why You’ll Love the AR/VR Industry KPI Dashboard in Excel

✅ Track User Engagement & Behavior
Monitor key metrics such as user activity, session duration, and interactions to understand how users are engaging with your AR/VR products.
✅ Analyze Content Performance
Measure how well your AR/VR content is performing with real-time data on views, interactions, and conversions.
✅ Monitor Financial Health
Keep track of revenue, in-app purchases, and profitability by analyzing important financial KPIs like customer lifetime value (LTV) and customer acquisition cost (CAC).
✅ Make Data-Driven Decisions
Use the insights provided by the dashboard to make informed decisions, improve customer engagement, and optimize content for better performance.
✅ Customizable & Scalable
Tailor the dashboard to meet the specific needs of your AR/VR business. Customize KPIs, add additional metrics, and scale it to fit your growing organization.
What’s Inside the AR/VR Industry KPI Dashboard in Excel?
Comprehensive KPI Tracking: Track user engagement, app performance, and financial data.
User Engagement Metrics: Monitor active users, session frequency, and user behavior.
Content Performance Analysis: Measure content views, feedback, and conversion rates.
Revenue & Financial Tracking: Track revenue, in-app purchases, and profitability.
Time-Based Performance Monitoring: Analyze performance over different periods.
Real-Time Data Integration: Get up-to-date insights from your AR/VR platforms.
How to Use the AR/VR Industry KPI Dashboard in Excel
1️⃣ Download the Template: Access the AR/VR Industry KPI Dashboard in Excel instantly.
2️⃣ Integrate Your Data: Connect your AR/VR platforms to the dashboard to sync real-time data.
3️⃣ Track Key Metrics: Monitor user engagement, content performance, and financial performance.
4️⃣ Analyze Data Trends: Use time-based analysis to track performance and identify areas for improvement.
5️⃣ Optimize Your AR/VR Business: Use the insights from the dashboard to refine your strategies and improve customer experiences.
Who Can Benefit from the AR/VR Industry KPI Dashboard in Excel?
🔹 AR/VR Product Managers & Developers
🔹 AR/VR Content Creators & Designers
🔹 Business Owners & Executives in the AR/VR Industry
🔹 Data Analysts & Marketing Teams
🔹 AR/VR Startups & Established Companies
🔹 Investors & Stakeholders in the AR/VR Sector
Optimize your AR/VR business and improve user experiences with the AR/VR Industry KPI Dashboard in Excel. Track performance, measure engagement, and monitor financial success in one easy-to-use dashboard.
Click here to read the Detailed blog post
Visit our YouTube channel to learn step-by-step video tutorials
Youtube.com/@PKAnExcelExpert































Reviews
There are no reviews yet.