


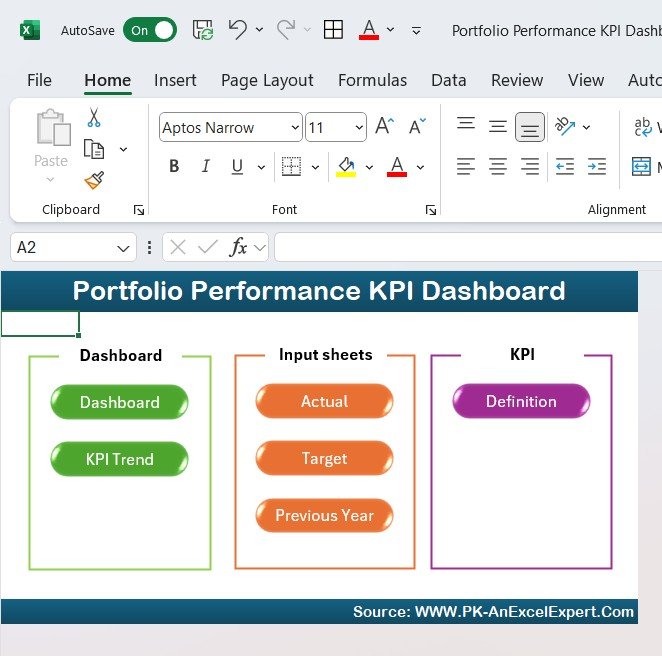

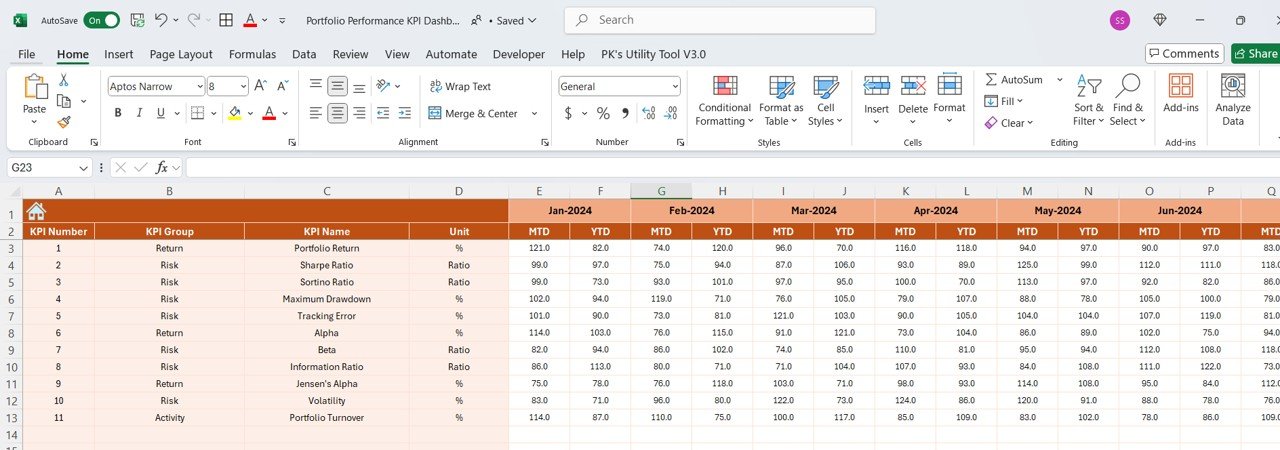
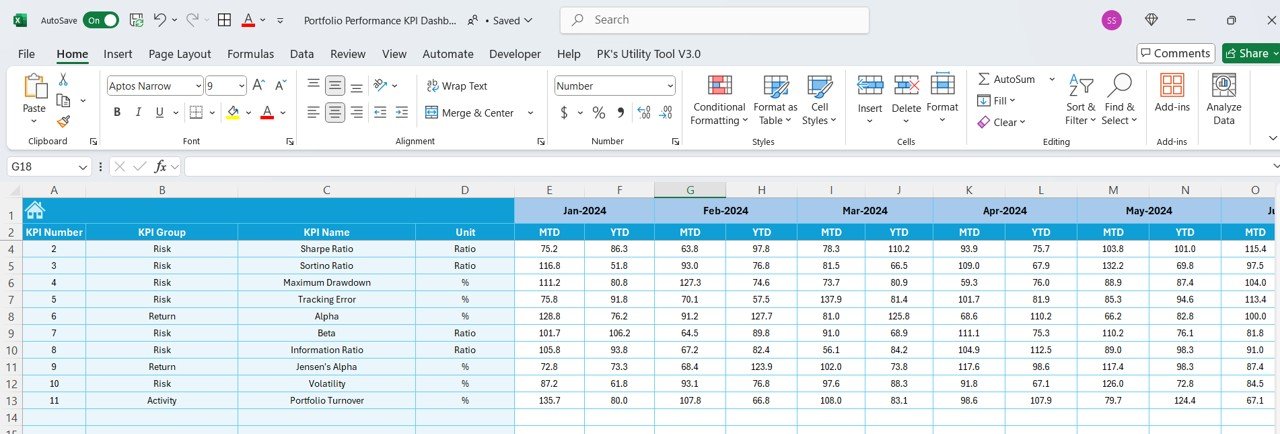
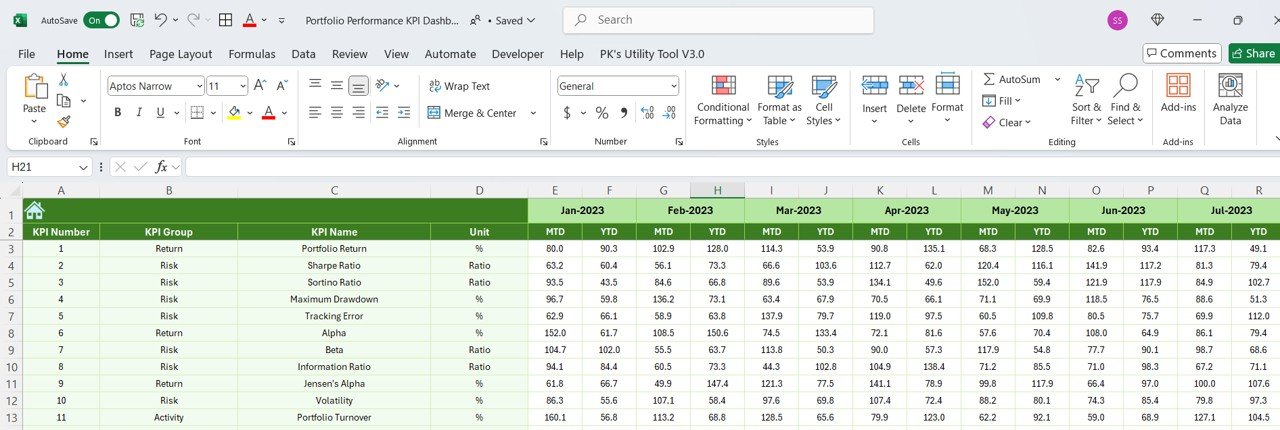
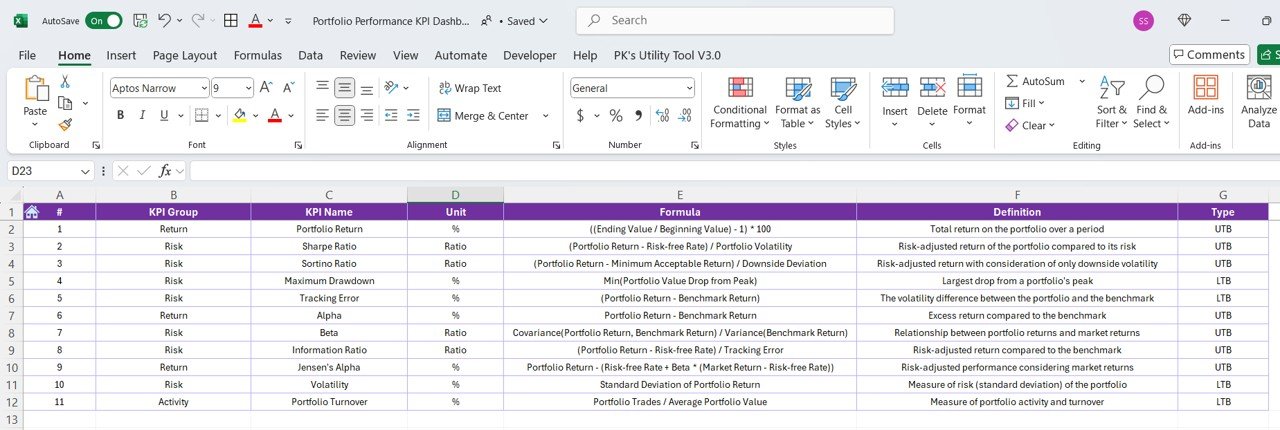

The Portfolio Performance KPI Dashboard in Excel is a powerful tool for tracking and analyzing the performance of your portfolio, whether it’s a financial portfolio, project portfolio, or any other collection of assets or projects. This customizable dashboard allows you to track key performance indicators (KPIs) and monitor how well your portfolio is performing over time. Whether you’re in finance, project management, or asset management, this Excel dashboard provides valuable insights to help you make informed decisions.
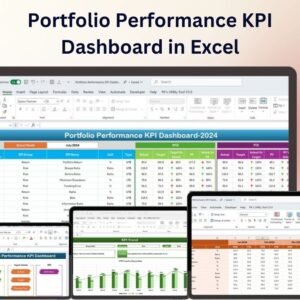
The Portfolio Performance KPI Dashboard uses a variety of visualizations, including charts and graphs, to display portfolio performance. It allows you to track ROI, asset allocation, progress towards goals, and other important metrics that are critical for making strategic adjustments. With easy-to-use customization features, the dashboard can be tailored to fit your unique needs.
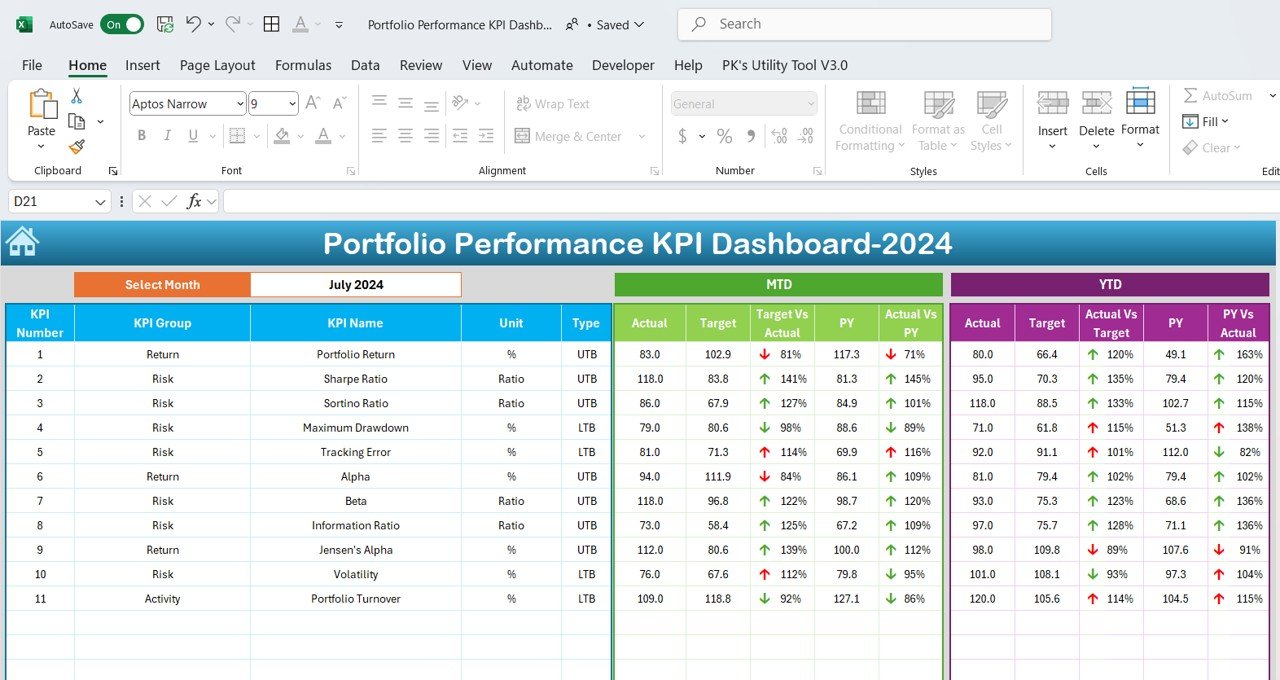
Key Features of the Portfolio Performance KPI Dashboard in Excel
📌 Comprehensive Portfolio Performance Metrics
Track and measure critical performance metrics such as return on investment (ROI), asset performance, goal completion, and more. The dashboard provides a comprehensive overview of your portfolio’s performance across different areas.
🛠 Interactive Data Visualizations
The dashboard includes various interactive visualizations such as bar charts, pie charts, and line graphs. These charts give you an at-a-glance view of the portfolio performance and make it easier to interpret complex data points.
💡 Customizable KPIs
Customize the KPIs based on your portfolio’s unique requirements. You can track different aspects of your portfolio, such as profitability, progress towards goals, and risk levels. This flexibility allows you to tailor the dashboard to meet your specific needs.
🔢 Real-Time Data Updates
The Portfolio Performance KPI Dashboard automatically updates in real-time as your data changes. Whether you’re tracking financial investments or project milestones, the dashboard will always display the most up-to-date data, ensuring you stay on top of your portfolio’s performance.
🚀 Clear and Actionable Insights
The dashboard presents the data in a way that highlights key trends and insights. This enables you to make informed decisions quickly and take action when necessary, whether it’s reallocating resources, adjusting strategies, or identifying areas for improvement.
📊 Ideal for Portfolio Managers and Analysts
Whether you’re a portfolio manager, financial analyst, or project manager, this dashboard is designed to give you a clear overview of your portfolio’s performance. It’s a versatile tool for anyone managing a portfolio of investments, projects, or other assets.
⚙ User-Friendly Setup
Setting up and customizing the Portfolio Performance KPI Dashboard is simple and doesn’t require advanced Excel skills. The clear instructions and easy-to-follow guide ensure that you can get started quickly.
🚀 Why You’ll Love the Portfolio Performance KPI Dashboard in Excel
✅ Track Portfolio Metrics – Measure ROI, asset performance, and progress toward goals. ✅ Customizable KPIs – Tailor the dashboard to track the metrics most important to you. ✅ Real-Time Updates – Automatically updates as you input new data, providing up-to-date insights. ✅ Interactive Visualizations – Use charts and graphs to visualize performance metrics. ✅ User-Friendly Setup – Easy to customize and set up without requiring advanced Excel knowledge.
📂 What’s Inside the Portfolio Performance KPI Dashboard in Excel?
- Portfolio Performance Metrics: Track ROI, asset performance, and goal progress.
- Interactive Charts: Visualize data with bar, pie, and line charts.
- Customizable KPIs: Tailor the dashboard to your unique portfolio.
- Real-Time Data Updates: Ensure your data is always current with automatic updates.
- Step-by-Step Setup Instructions: Simple guide to help you get started quickly.
🔍 How to Use the Portfolio Performance KPI Dashboard in Excel
1️⃣ Download the Template – Instant access to the Excel file upon purchase. 2️⃣ Input Your Data – Enter your portfolio’s data, such as asset performance, ROI, and progress metrics. 3️⃣ Customize KPIs – Adjust the KPIs to reflect the aspects of your portfolio you want to track. 4️⃣ Analyze and Monitor – Use the dashboard to track performance and identify trends. 5️⃣ Make Informed Decisions – Leverage the insights to make data-driven decisions and optimize your portfolio.
🎯 Who Can Benefit from the Portfolio Performance KPI Dashboard in Excel? 🔹 Portfolio Managers
🔹 Financial Analysts
🔹 Project Managers
🔹 Asset Managers
🔹 Business Analysts
🔹 Anyone managing a portfolio of assets or projects
Optimize your portfolio management with the Portfolio Performance KPI Dashboard in Excel. With customizable KPIs and real-time updates, this dashboard makes it easy to track performance, visualize trends, and make data-driven decisions.
Click here to read the Detailed blog post
https://www.pk-anexcelexpert.com/portfolio-performance-kpi-dashboard-in-excel/




















Reviews
There are no reviews yet.