

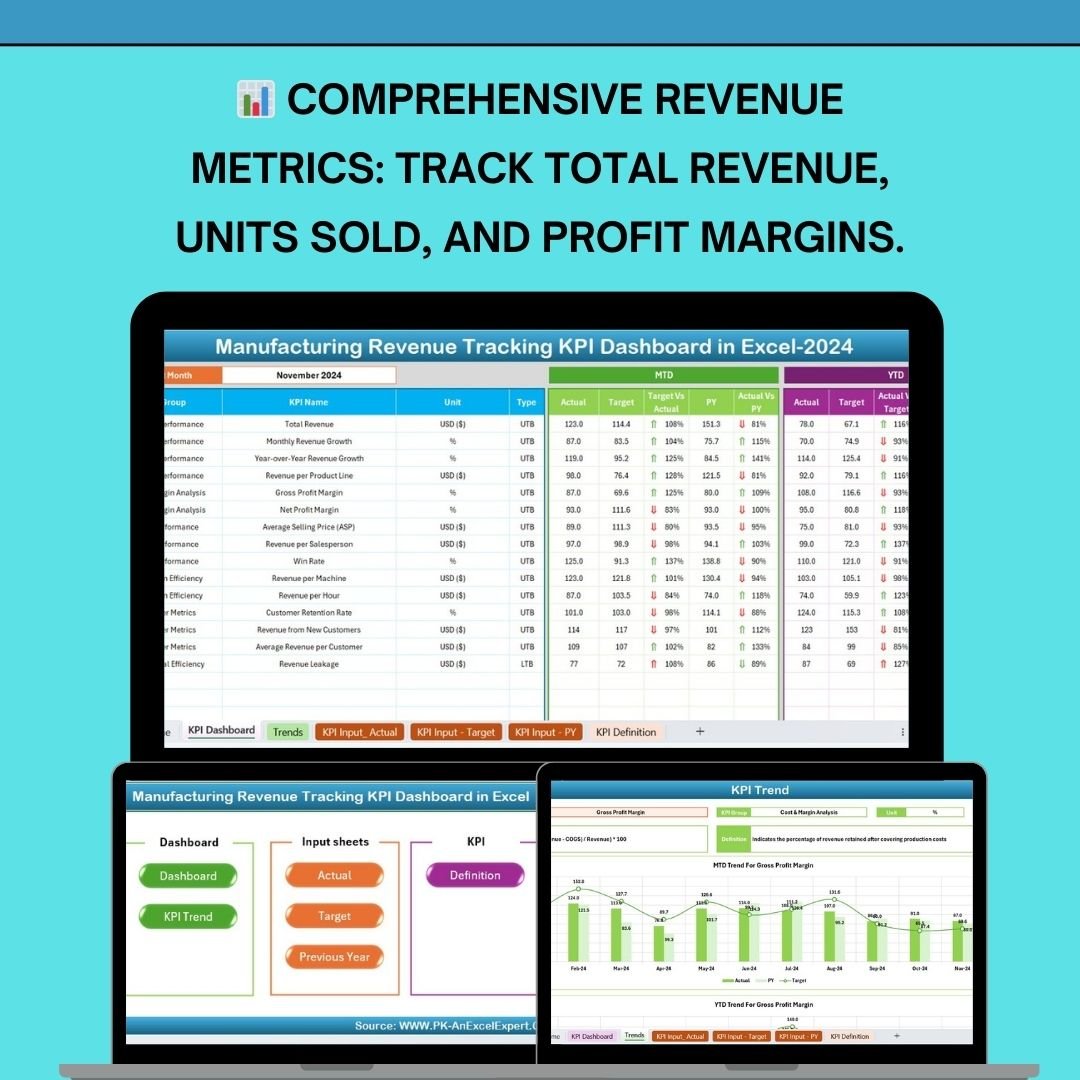
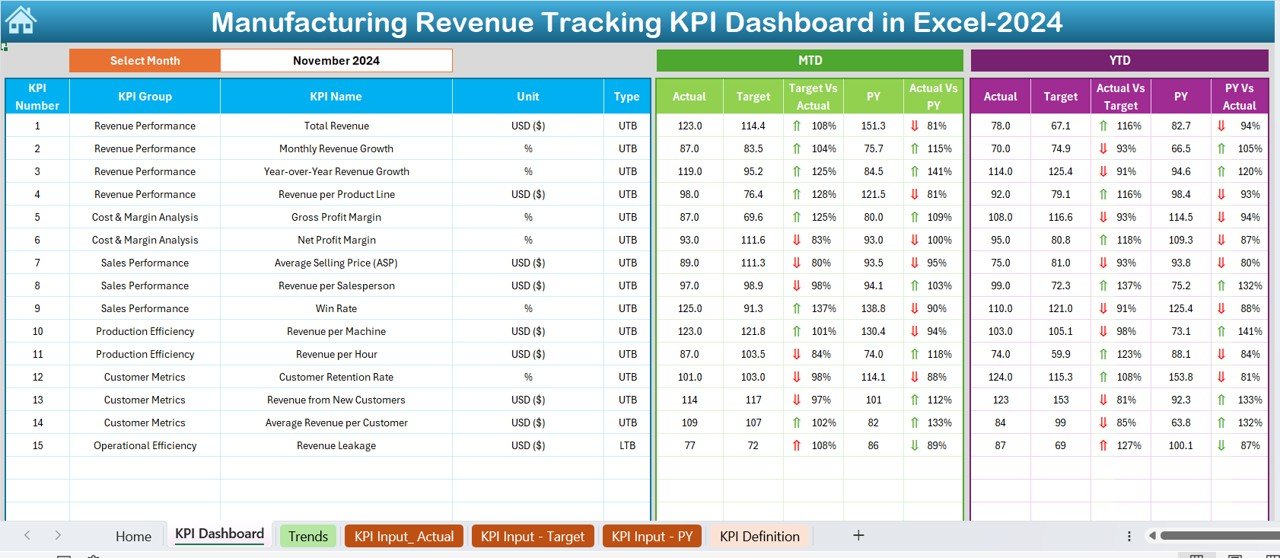

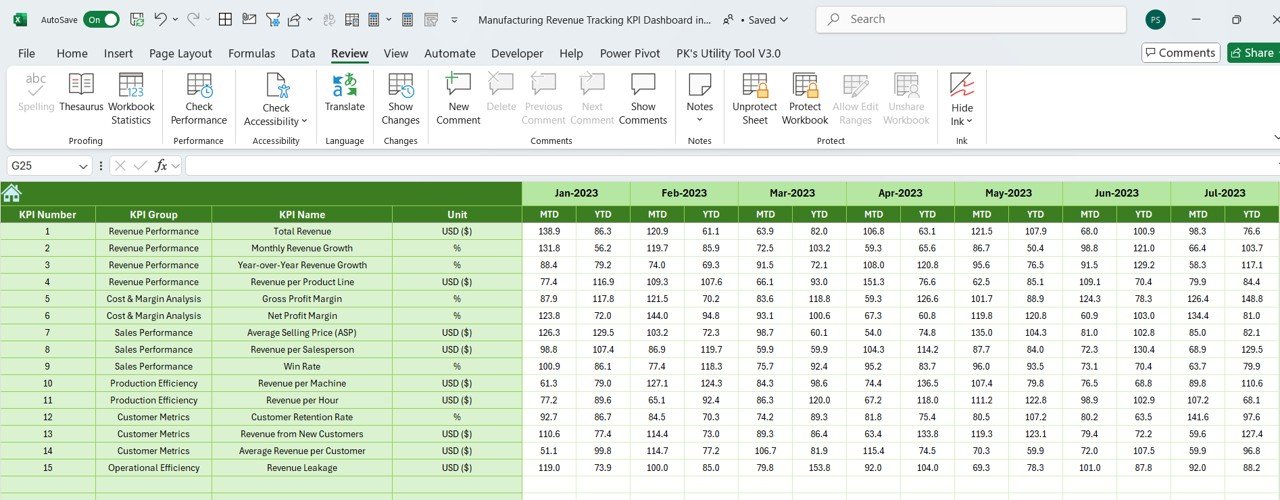
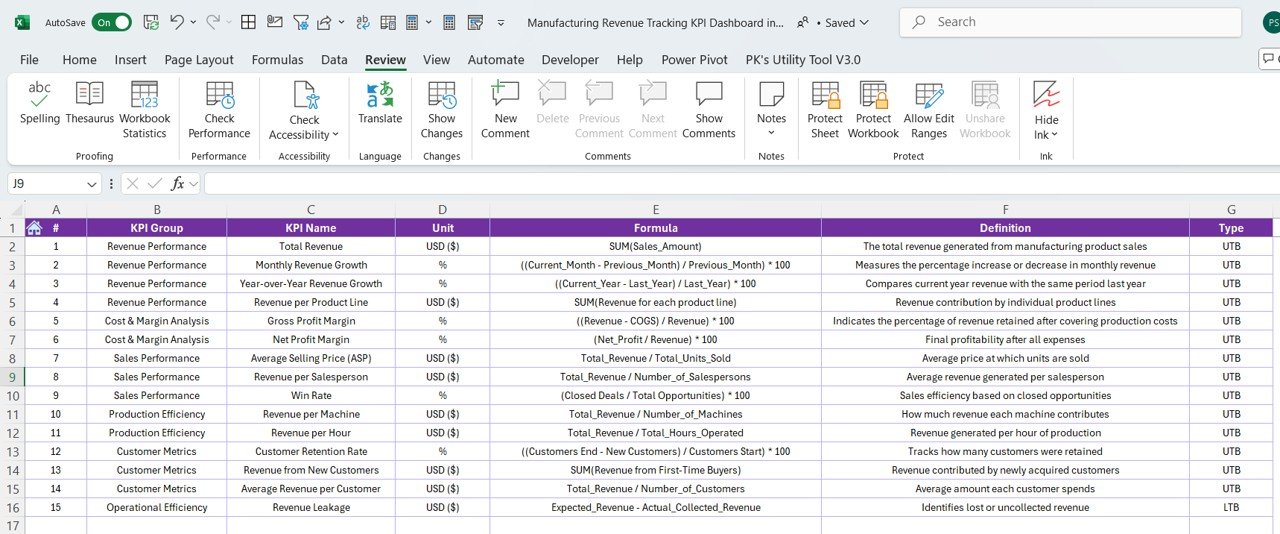

The Manufacturing Revenue Tracking KPI Dashboard in Excel is an essential tool for manufacturing businesses to track, analyze, and optimize revenue performance. This Excel-based dashboard helps manufacturers monitor key performance indicators (KPIs) such as total revenue, sales volume, average selling price, and profit margins, offering real-time insights that can drive business growth and operational improvements.
By tracking these critical metrics, manufacturers can identify trends, pinpoint areas for cost reduction, and maximize profitability. Whether you’re managing a small manufacturing unit or overseeing a large-scale operation, this dashboard simplifies the process of revenue tracking, helping you make data-driven decisions that boost your bottom line.
Key Features of the Manufacturing Revenue Tracking KPI Dashboard in Excel
📊 Comprehensive Revenue Metrics Tracking
Track and monitor key revenue metrics such as total revenue, units sold, average selling price, and profit margins. This allows you to evaluate the performance of your manufacturing operations on a granular level.
📈 Sales Volume & Pricing Analysis
Analyze sales volume trends and pricing changes over time. Identify opportunities to adjust prices, improve sales strategies, and optimize product offerings based on real-time data.
💰 Profit Margin & Cost Analysis
Measure profit margins and assess the cost of production. Identify areas where you can reduce costs or increase efficiency to improve profitability.
📅 Time-Based Tracking
Monitor manufacturing revenue performance over different periods (daily, weekly, monthly, and yearly). This feature enables you to compare performance across timeframes, helping you identify trends and forecast future revenue.
⚙️ Customizable Dashboard
Customize the dashboard to fit your specific business needs. Add or remove KPIs, adjust data fields, and tailor the design to your preferences to reflect your unique manufacturing revenue tracking requirements.
📈 Real-Time Data Integration
Integrate data from various manufacturing systems and tools to get real-time revenue insights. This ensures that you’re always working with the most accurate and up-to-date information.
Why You’ll Love the Manufacturing Revenue Tracking KPI Dashboard in Excel

✅ Track Key Revenue Metrics
Monitor total revenue, units sold, pricing, and profit margins, ensuring you’re always on top of your manufacturing operations.
✅ Analyze Sales Trends & Performance
Use the sales volume and pricing analysis features to understand trends and make informed decisions about product pricing, sales strategies, and inventory management.
✅ Increase Profitability & Efficiency
By analyzing profit margins and production costs, you can optimize your operations and improve profitability.
✅ Data-Driven Decision Making
Leverage the insights from the dashboard to make informed, data-driven decisions that enhance revenue performance and operational efficiency.
✅ Scalable & Customizable
The dashboard is fully customizable and can scale with your business. Whether you’re tracking revenue for a small manufacturing unit or a large-scale operation, the dashboard adapts to your needs.
What’s Inside the Manufacturing Revenue Tracking KPI Dashboard in Excel?
Comprehensive Revenue Metrics Tracking: Track total revenue, units sold, and profit margins.
Sales Volume & Pricing Analysis: Analyze sales trends and pricing adjustments over time.
Profit Margin & Cost Analysis: Monitor profit margins and production costs.
Time-Based Tracking: Track revenue performance across different time periods.
Customizable Features: Tailor the dashboard to reflect your business’s unique needs.
Real-Time Data Integration: Integrate data from multiple systems for real-time analysis.
How to Use the Manufacturing Revenue Tracking KPI Dashboard in Excel
1️⃣ Download the Template: Instantly access the Manufacturing Revenue Tracking KPI Dashboard in Excel.
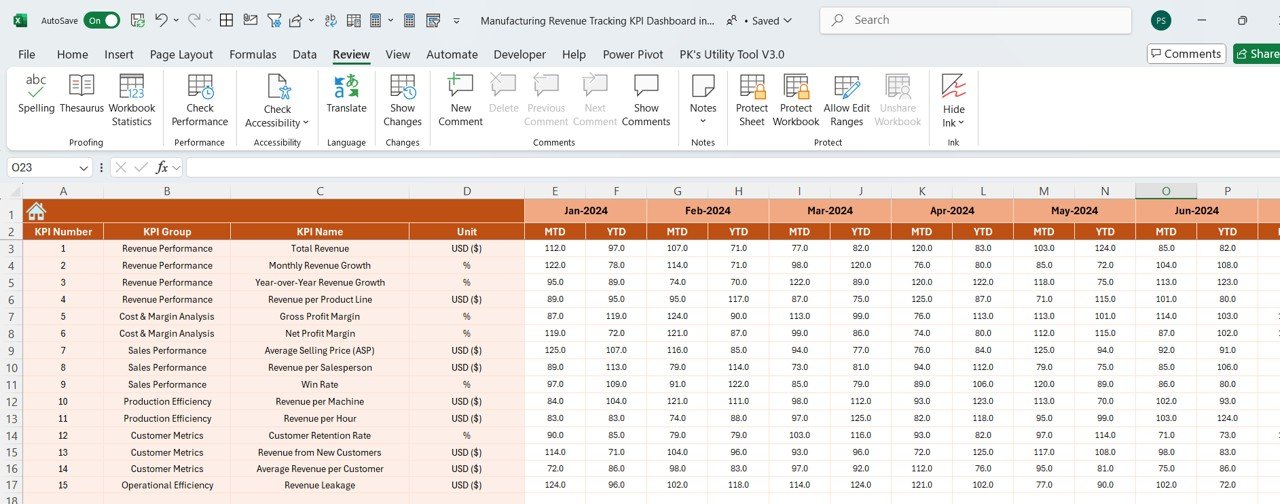
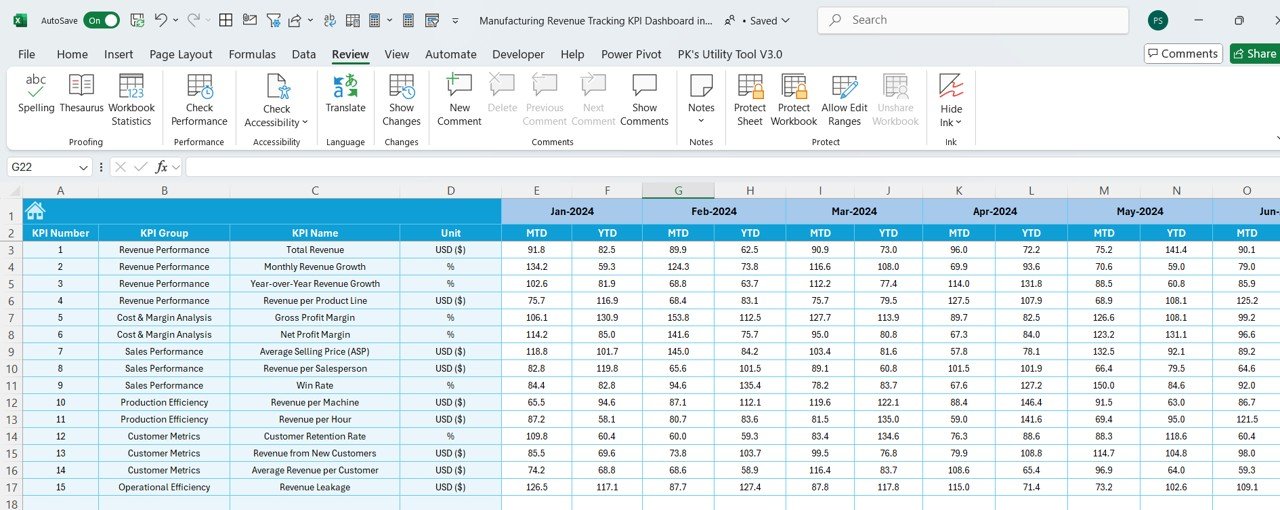
2️⃣ Input Your Revenue Data: Enter key data such as sales volume, unit prices, and production costs.
3️⃣ Track Key Metrics: Monitor revenue, sales, and profit margins over various timeframes.
4️⃣ Analyze Trends & Opportunities: Use the sales volume and pricing analysis to identify trends and opportunities for growth.
5️⃣ Optimize Operations: Use the insights to reduce costs, improve efficiencies, and increase profitability.
Who Can Benefit from the Manufacturing Revenue Tracking KPI Dashboard in Excel?
🔹 Manufacturing Business Owners & Managers
🔹 Sales & Operations Teams
🔹 Finance & Accounting Teams
🔹 Supply Chain & Production Managers
🔹 Small & Medium Enterprises (SMBs) in Manufacturing
🔹 Large Enterprises & Manufacturing Corporations
🔹 Business Analysts & Financial Analysts
Track your manufacturing revenue and optimize your operations with the Manufacturing Revenue Tracking KPI Dashboard in Excel. Monitor key revenue metrics, analyze sales and profit margins, and make data-driven decisions that improve your manufacturing business performance.
Click here to read the Detailed blog post
Visit our YouTube channel to learn step-by-step video tutorials
Youtube.com/@PKAnExcelExpert































Reviews
There are no reviews yet.