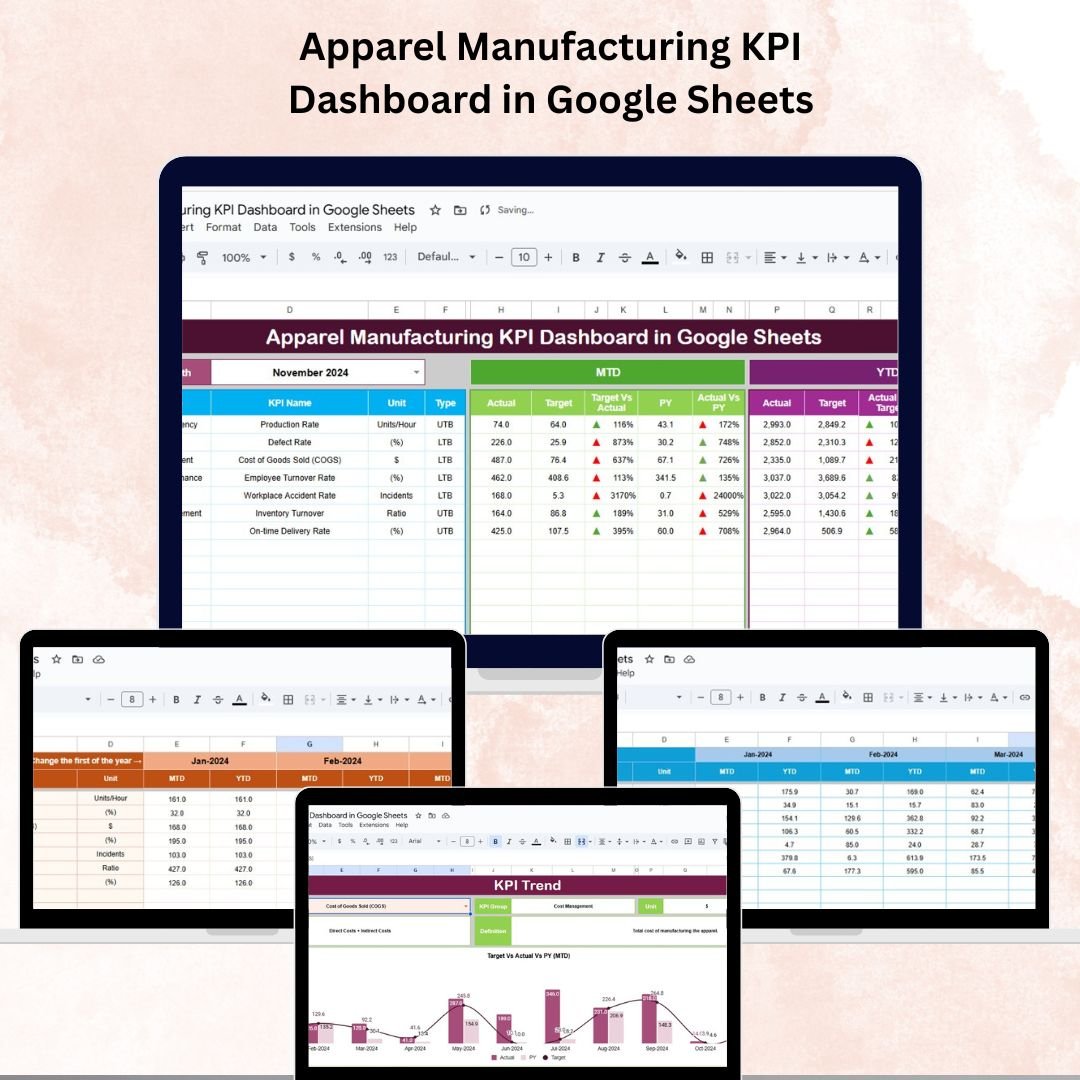
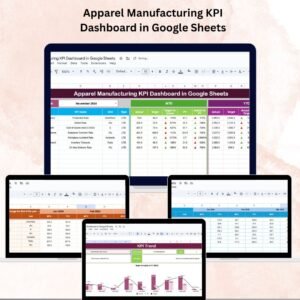
In the fast-paced world of apparel manufacturing, every decision counts. The Apparel Manufacturing KPI Dashboard in Google Sheets is a ready-to-use, customizable tool that empowers you to track, analyze, and optimize your production performance.
From production output to quality control metrics, this dashboard consolidates your key performance indicators (KPIs) into one clear and interactive view, enabling managers, supervisors, and quality specialists to make data-driven decisions that improve efficiency, reduce costs, and maintain high product standards.
🔑 Key Features of the Apparel Manufacturing KPI Dashboard
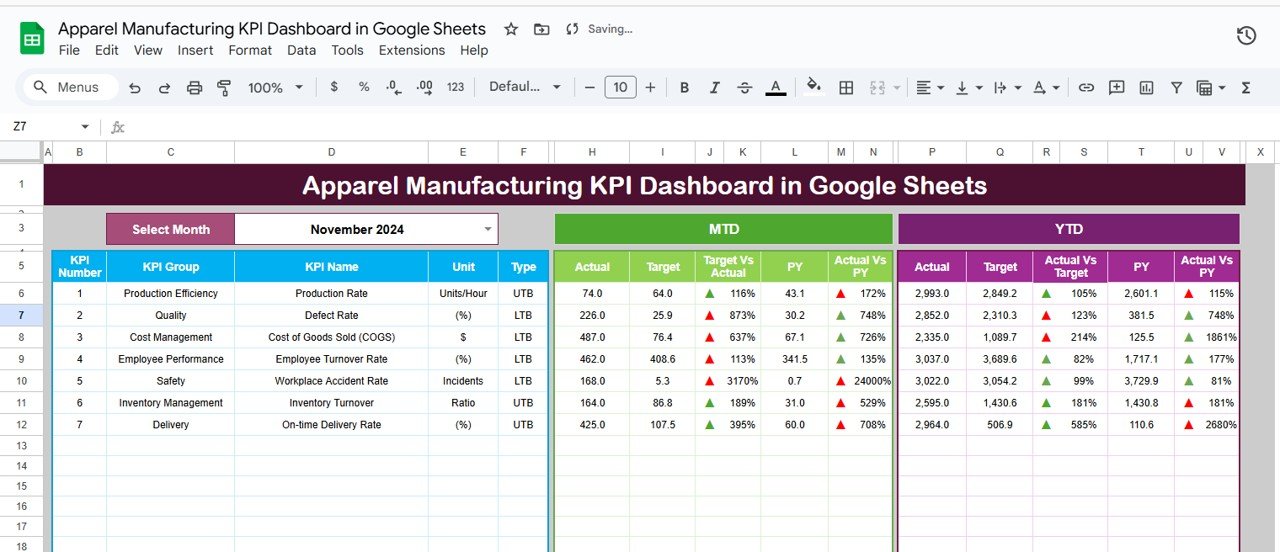
📌 Dashboard Sheet – Centralized KPI Overview
-
Select Month from a dropdown menu to filter all dashboard visuals instantly.
-
Track MTD (Month-to-Date) and YTD (Year-to-Date) actuals, targets, and previous year data side-by-side.
-
Conditional formatting with arrows (▲/▼) and color coding to show performance at a glance.
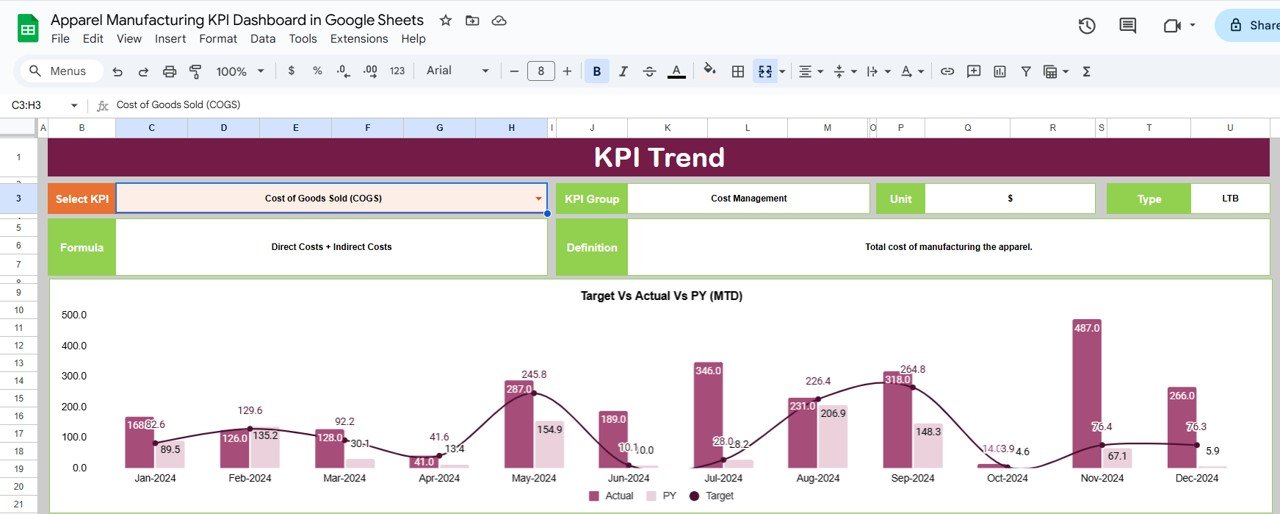
📈 KPI Trend Sheet – Detailed Performance Analysis
-
Choose any KPI from a dropdown to analyze its performance trend.
-
See KPI Group, Unit, performance type (Lower the Better / Upper the Better), formula, and definition.
-
Track historical data to identify patterns and improvement opportunities.
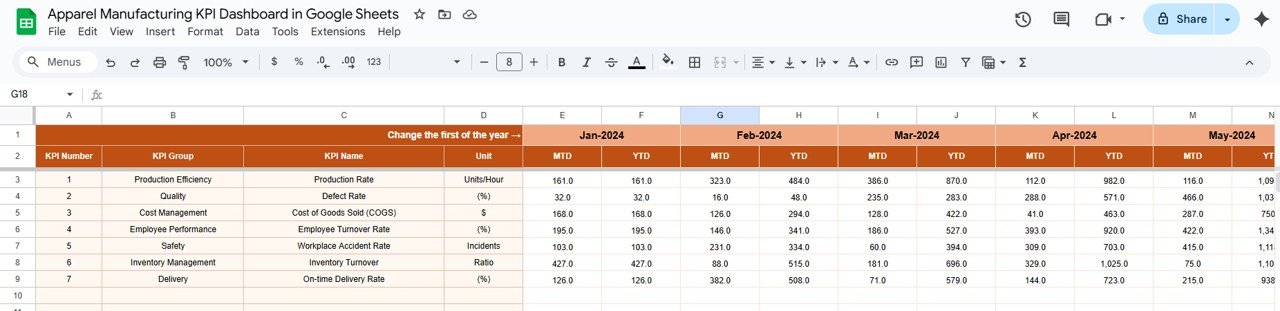
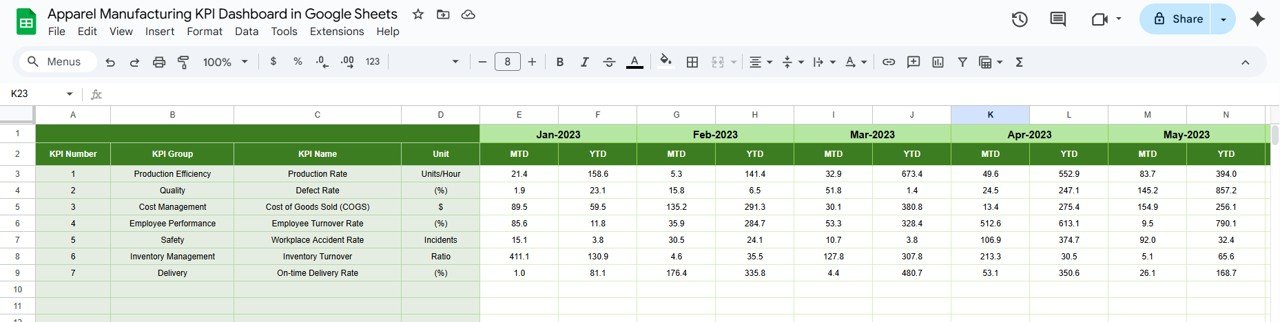
🧾 Actual Number Sheet – Live Data Entry
-
Input monthly and yearly actual performance figures.
-
Keep the dashboard updated with fresh data as production progresses.
🎯 Target Sheet – Goal Setting Made Simple
-
Define monthly and yearly targets for each KPI.
-
Ensure teams remain aligned with production and quality objectives.
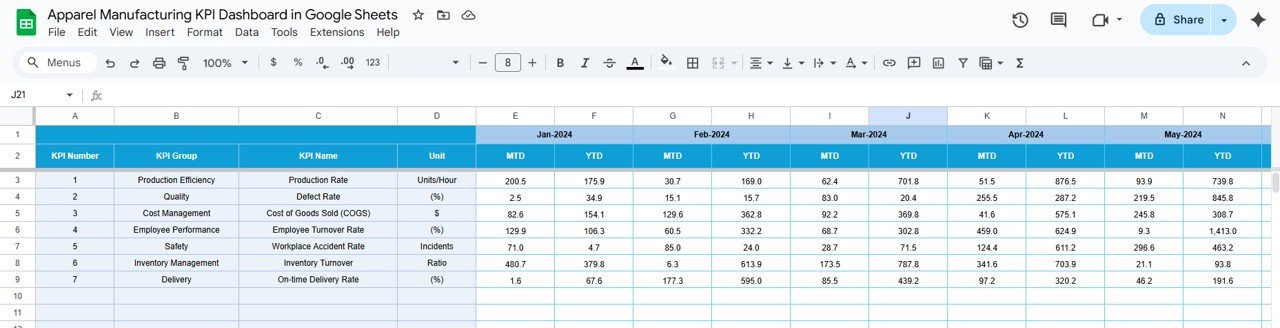
📊 Previous Year Number Sheet – Benchmarking
-
Enter last year’s figures to compare current performance with historical benchmarks.
-
Spot year-over-year improvements or declines.
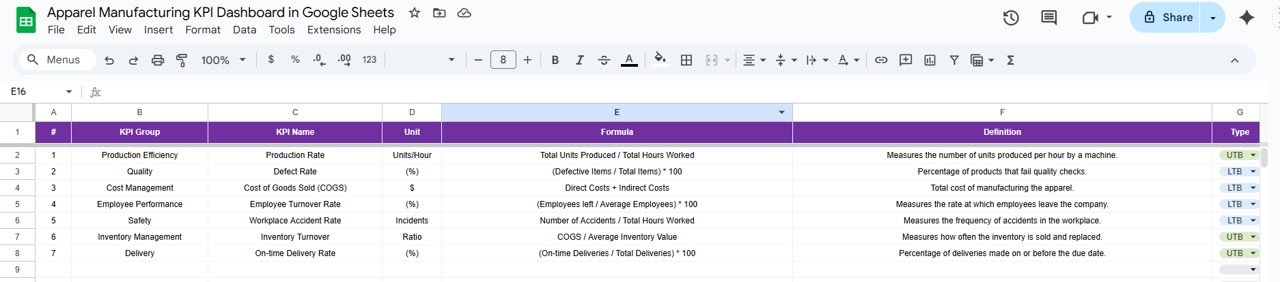
📖 KPI Definition Sheet – Consistency & Clarity
-
Maintain a complete reference of all KPIs with clear definitions, units, formulas, and categories.
-
Keep your performance tracking structured and easy to manage.
📦 What’s Inside the Apparel Manufacturing KPI Dashboard?
✅ Dashboard Tab – Real-time KPI summary with visual indicators
✅ KPI Trend Tab – In-depth analysis of selected metrics
✅ Actual Number Tab – Data entry for live results
✅ Target Tab – KPI goal setting
✅ Previous Year Data Tab – Year-over-year performance comparison
✅ KPI Definition Tab – Central reference for all tracked metrics
✅ Pre-Built Formulas & Conditional Formatting – Fully functional, no setup required
✅ Customizable Fields – Adjust KPIs to match your factory’s needs
🧠 How to Use the Apparel Manufacturing KPI Dashboard
-
Set Your KPIs – Define them in the KPI Definition Sheet.
-
Enter Targets – Add monthly and yearly goals in the Target Sheet.
-
Input Actual Data – Log real-time or monthly performance figures.
-
Monitor Trends – Use KPI Trend Tab for detailed analysis.
-
Compare with Past Performance – Utilize the Previous Year Sheet for benchmarking.
👥 Who Can Benefit from This Dashboard?
-
🏭 Factory Managers – Monitor production and quality metrics in real time.
-
🛠 Production Supervisors – Identify bottlenecks and address them quickly.
-
📋 Quality Control Teams – Track defect rates and quality improvements.
-
📦 Operations Managers – Optimize resources for maximum output.


Reviews
There are no reviews yet.