

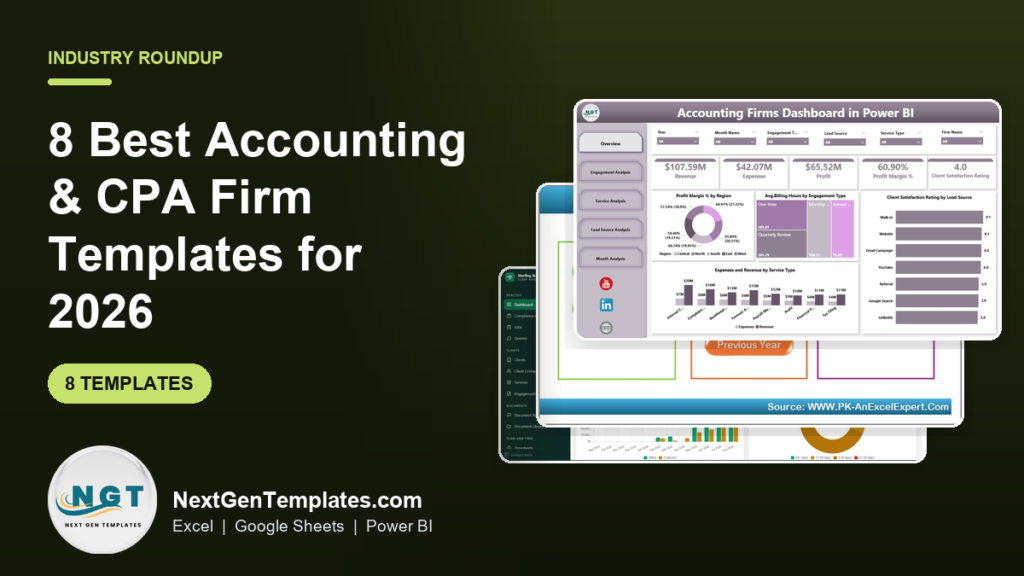
The best accounting firm dashboard template for most CPA practices in 2026 is the Accounting Firms Dashboard in Power BI ($17.99): five pages show revenue, expenses, profit margin, billing hours and client satisfaction by service, engagement type, region and lead source. The Accounting Firms KPI Dashboard in Power BI is the best value at $11.99.
Last updated: September 2026
Key takeaways
- Best overall accounting firm dashboard template: the Accounting Firms Dashboard in Power BI at $17.99, with Overview, Engagement, Service, Lead Source and Month Analysis pages.
- Best value: the Accounting Firms KPI Dashboard in Power BI at $11.99, a monthly MTD/YTD scorecard against target and last year.
- All eight picks are one-time purchases from $8.99 to $39.99; CPA practice management software is billed per user, every month.
- Three picks report on firm performance, two are full browser-based systems for running client work and ledgers, and three cover tax compliance and audit quality.
- The dashboards report on your numbers; they do not prepare returns, run e-filing or replace your general ledger software.
Accounting and CPA firm templates compared
| Template | Format | Best For | Price |
|---|---|---|---|
| Accounting Firms Dashboard | Power BI | Best overall: profit margin by service, engagement and region | $17.99 |
| Accounting Firms KPI Dashboard | Power BI | Best value: monthly KPI scorecard vs target and prior year | $11.99 |
| Accounting Firms KPI Dashboard | Excel | Partners who report KPIs from Excel | $14.99 |
| Accounting Firm Client Management System | Web App (Google Apps Script) | Clients, compliance calendar, jobs, timesheets, WIP and billing | $39.99 |
| Accounting Ledger Pro Management System | Web App (Google Apps Script) | Bookkeeping ledgers, cashbook, bankbook and stock for clients | $39.99 |
| Tax Compliance KPI Dashboard | Google Sheets | Lowest-cost tax compliance scorecard, shared | $8.99 |
| Audit & Internal Controls KPI Dashboard | Power BI | Audit practice and control-testing KPIs | $11.99 |
| Corporate Audit Dashboard | Google Sheets | Audit findings, risk levels and audit cost by client or location | $9.99 |
How we picked these accounting firm templates
We searched the full NextGenTemplates catalogue of Excel, Google Sheets, Power BI and web app products for accounting firm, CPA, bookkeeping, tax and audit tools, then kept the eight that a managing partner, practice manager or audit lead would open every month. Each pick had to run from a real data or input sheet, show measures an accounting practice actually manages, such as profit margin by service line, billing hours, WIP, receivables or audit findings, and be editable without a consultant.
We left the generic finance-department dashboards (cost efficiency, revenue tracking and similar KPI files) out of the ranking because they describe a company’s own finance team, not a firm that serves clients. Prices are the current one-time list prices on each product page. For practice benchmarks we point to the AICPA & CIMA, whose Private Companies Practice Section publishes the most widely used management-of-an-accounting-practice survey in the US.
Why accounting firms need a dashboard in the first place
Accounting firms are data-rich and insight-poor. Hours sit in a time-tracking tool, jobs in a workflow board, invoices in a billing module and receipts in the bank. What partners rarely have is one page that answers the three questions that decide the year: which services make money, who is overloaded before deadline season, and how much finished work has not been billed or collected.
That gap is expensive in a deadline business. Compliance work is seasonal, so a practice can look busy and profitable in March and still finish the year with thin margins because bookkeeping clients were underpriced, payroll engagements ate more hours than quoted, and WIP sat unbilled for 60 days. Without a profit-by-service view, the firm keeps selling the work that loses money.
Practice management platforms such as Karbon, TaxDome, Canopy and Financial Cents include reports, but they are subscriptions priced per user per month, and their standard reports rarely match the exact view a managing partner wants for a partner meeting. An accounting firm dashboard template sits on top of your exports. It does not replace those systems; it turns their numbers into a clear monthly view for a one-time $8.99 to $39.99.
The 8 best accounting and CPA firm templates for 2026
1. Accounting Firms Dashboard in Power BI: best overall

This is the most complete accounting firm dashboard template in the roundup, and it ranks first for one reason: it is the only pick that shows profitability by the way an accounting practice actually sells, by service type and by engagement type. Five pages, Overview, Engagement Analysis, Service Analysis, Lead Source Analysis and Month Analysis, share one set of slicers for year, month, engagement type, lead source, service type and firm name.
Who it is for: managing partners, practice managers and firm owners of small and mid-sized CPA and bookkeeping firms with more than one service line.
- Overview cards for Revenue, Expenses, Profit, Profit Margin % and Client Satisfaction Rating.
- Profit margin % by region and average billing hours by engagement type (one-time, monthly, quarterly and annual work).
- Expenses vs revenue by service type, covering lines such as audit, tax filing, bookkeeping, payroll and compliance.
- Client satisfaction by lead source, from referrals and walk-ins to website, Google Search, YouTube and LinkedIn.
Concrete uses: the sample data shows $107.59M revenue, $65.52M profit and a 60.90% margin, which is exactly the kind of headline a partner meeting should break down by service; find out whether monthly bookkeeping clients burn more billing hours than their fee supports; and see whether referral clients rate the firm higher than clients from paid channels before you set next year’s marketing budget. Price: $17.99. Get the Accounting Firms Dashboard in Power BI →
Best for: the firm that wants to know which services, regions and lead sources actually make money.
2. Accounting Firms KPI Dashboard in Power BI: best value
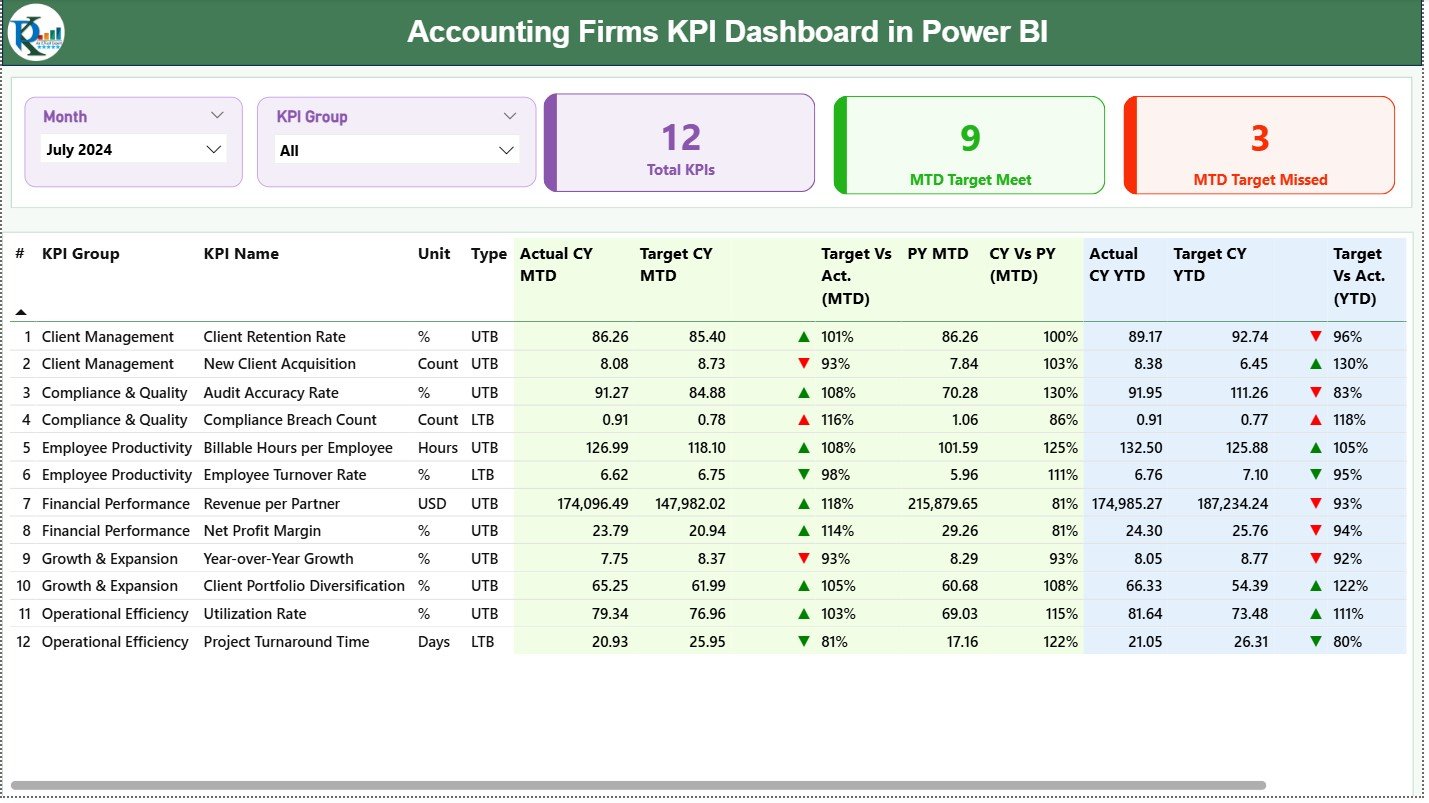
At $11.99 this is the best value in the list and a different kind of template from pick 1. Instead of transaction rows, you enter one monthly actual and one target per KPI, and the report shows month-to-date and year-to-date performance against target and against the previous year, with green and red arrows.
Who it is for: CA and CPA firms, tax consultants, outsourced accounting providers and audit teams that review a fixed KPI set every month.
- Summary page with month and KPI group slicers (revenue, billing, audits, productivity, compliance and more).
- Three cards: total KPIs, MTD target met and MTD target missed.
- KPI table with actual vs target and current year vs previous year, for both MTD and YTD.
- KPI Trend page plus a drill-through KPI Definition page with unit, formula and UTB/LTB type, all fed from three Excel input sheets.
Concrete uses: track realization rate, average days to bill and returns filed on time against target each month; show partners that YTD revenue per staff member is ahead of last year even when one month dips; and hand a new manager the KPI Definition page instead of a briefing. Price: $11.99. Get the Accounting Firms KPI Dashboard in Power BI →
Best for: a monthly partner scorecard at the lowest price.
3. Accounting Firms KPI Dashboard in Excel
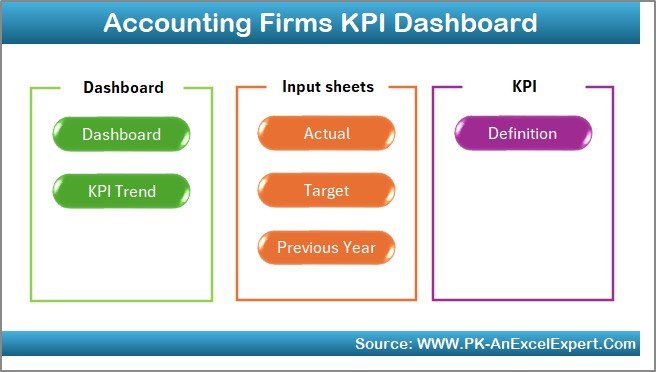
The same KPI scorecard approach as pick 2, built entirely in Microsoft Excel for firms that do not use Power BI. Seven sheets cover navigation, the dashboard, trends, actual inputs, targets, previous-year numbers and KPI definitions, and every figure is formula-driven.
Who it is for: partners and practice managers who already live in Excel and want a scorecard that opens on any laptop with no extra software.
- Seven sheets: Home, Dashboard, KPI Trend, Actual Numbers Input, Target, Previous Year and KPI Definition.
- Month selector drop-down that refreshes every MTD and YTD value on the Dashboard.
- Fiscal-year start month setting, so a firm with a non-calendar year still gets correct YTD figures.
- Conditional formatting arrows and trend charts of actual vs target vs previous year for any KPI.
Concrete uses: set a fiscal year that starts in May after tax season and compare each month with the same month last year; review client retention and billing efficiency against target in the monthly partner meeting; and add your own KPIs, such as WIP days, without rebuilding anything. Price: $14.99. Get the Accounting Firms KPI Dashboard in Excel →
Best for: Excel-first firms that want targets and year-on-year comparison.
Not sure where to start? Most firms start with the Accounting Firms Dashboard in Power BI ($17.99) to see profit by service line. If you only need a monthly scorecard for partners, the KPI Dashboard in Power BI ($11.99) is the cheapest way to put targets in front of everyone.
4. Accounting Firm Client Management System Web App: best for running the practice
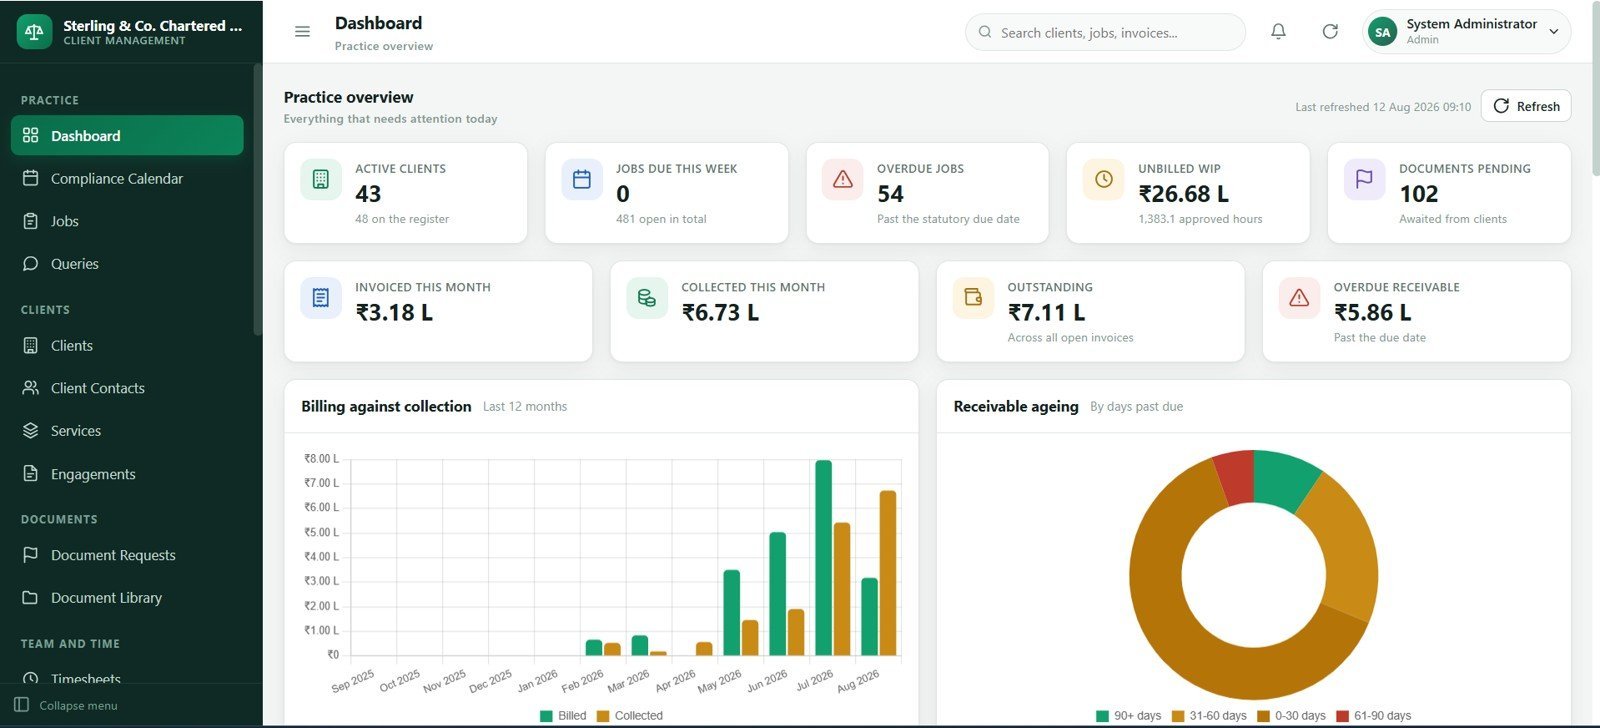
This is not a report; it is a browser-based operating system for the practice. Twenty-four connected screens cover clients, contacts, services, engagements, a compliance calendar, jobs, document requests, client queries, timesheets, WIP, invoices, receipts, expenses and client ledgers, with users, roles and an audit log behind them.
Who it is for: small accounting, bookkeeping and tax practices that want job and deadline control without committing to a monthly practice management subscription.
- Practice dashboard: active clients, jobs due this week, overdue jobs, unbilled WIP, pending documents, invoiced, collected and outstanding value.
- Compliance calendar and jobs register with service line, filing period, assigned staff, due date, stage, hours and billing status.
- Document requests and client queries with reminder counts and response due dates.
- Timesheets with billable value, approvals and billed/unbilled status, plus invoices, receipts, ageing and client ledgers.
Concrete uses: see every return due this week by staff member before the deadline crunch; chase the ten clients still missing bank statements from one screen; and review unbilled WIP every Friday so finished work is invoiced within days, not months. It runs on Google Apps Script in your own Google account, and a live demo with seven role logins is on the product page. Price: $39.99. Get the Accounting Firm Client Management System →
Best for: firms that need deadlines, jobs and WIP under control, not just a report.
5. Accounting Ledger Pro Management System Web App
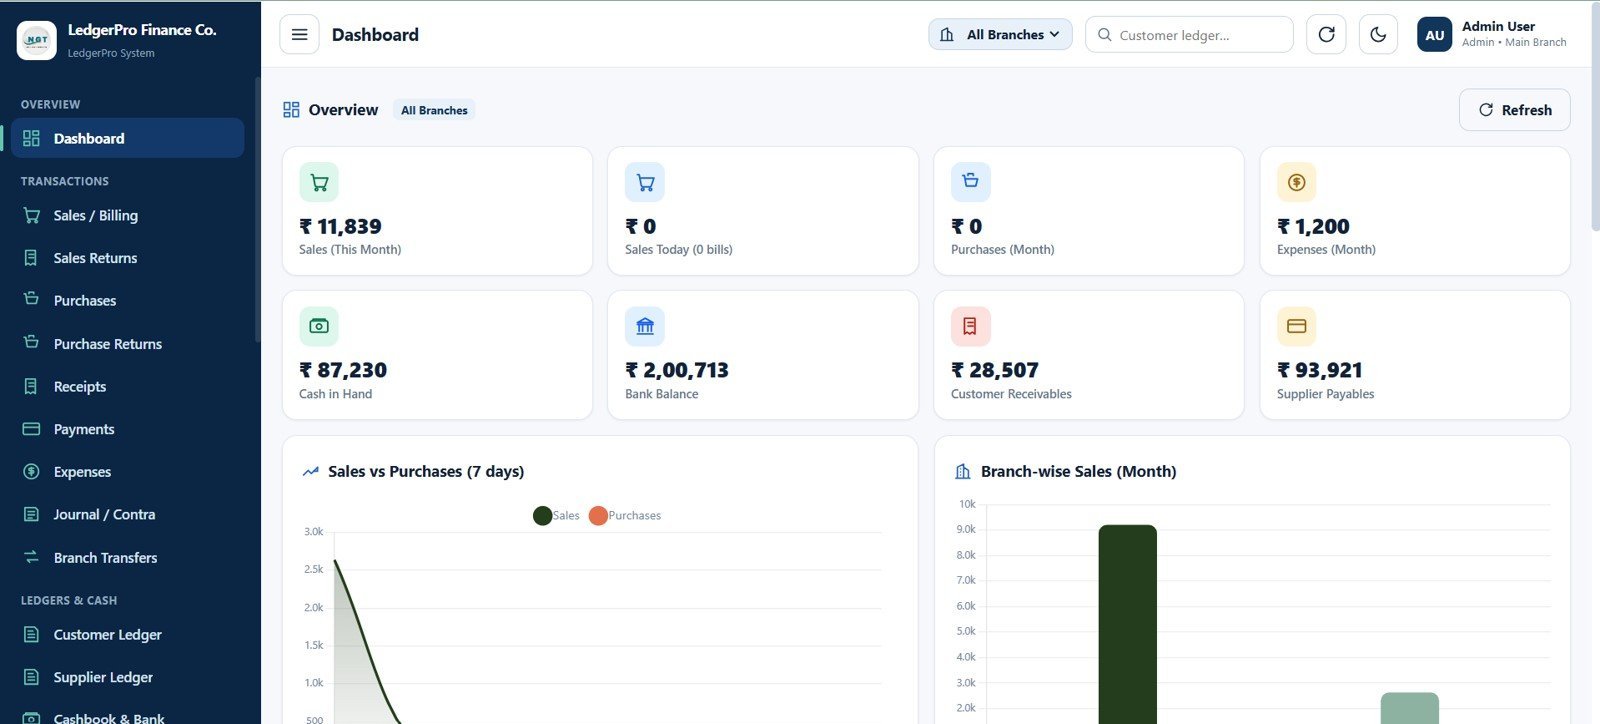
Where pick 4 runs the firm, Ledger Pro runs the books. It is a 30-page accounting workspace for sales invoices, purchase bills, returns, receipts, supplier payments, expenses, journal vouchers, contra entries, ledgers, stock and reports, with approvals, an archive database and an audit log.
Who it is for: bookkeeping practices that keep books for small trading clients, and small business owners who want a private, editable ledger instead of per-user software.
- Dashboard cards for sales this month, sales today, purchases, expenses, cash in hand, bank balance, receivables and payables.
- Customer ledger, supplier ledger, chart of accounts, cashbook and bankbook.
- Stock ledger with branch transfers, quantity in and out, and balances.
- Nine role logins, from admin and accountant to cashier and auditor, with module-level permissions.
Concrete uses: set up a separate instance for a retail bookkeeping client and review receivables and payables from its dashboard; give the client’s cashier entry rights while the accountant approves; and let an auditor role view records without changing them. You get the source code and a deployment guide for your own Google account. Price: $39.99. Get Accounting Ledger Pro →
Best for: bookkeepers who need a full ledger system with roles and an audit trail.
6. Tax Compliance KPI Dashboard in Google Sheets
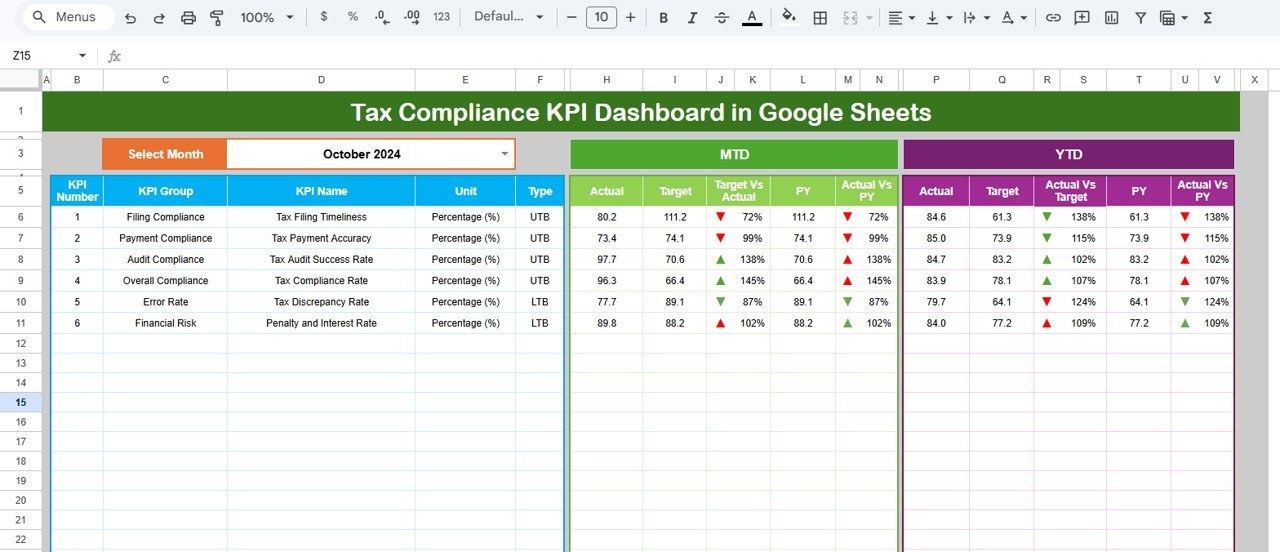
The lowest-priced pick in the guide. It is a six-worksheet KPI scorecard for tax compliance performance, and because it lives in Google Sheets, a tax manager and the partners can open the same live file from any browser during filing season.
Who it is for: tax practices, tax departments of general accounting firms and in-house tax teams on Google Workspace.
- Six worksheets: Dashboard, KPI Trend, Actual Numbers, Target Numbers, Previous Year and KPI Definition.
- Month selector that recalculates MTD and YTD actual, target and previous-year values.
- Target vs actual and previous year vs actual variance percentages with up and down arrows.
- Custom KPI definitions with group, unit, formula and LTB/UTB type, and no add-ons or macros.
Concrete uses: track returns filed on time, extensions filed and notices resolved against target each month; compare this season with last season on the same scoreboard; and share a view-only link with partners instead of emailing spreadsheets. Price: $8.99. Get the Tax Compliance KPI Dashboard →
Best for: tax season tracking on the smallest budget.
7. Audit & Internal Controls KPI Dashboard in Power BI
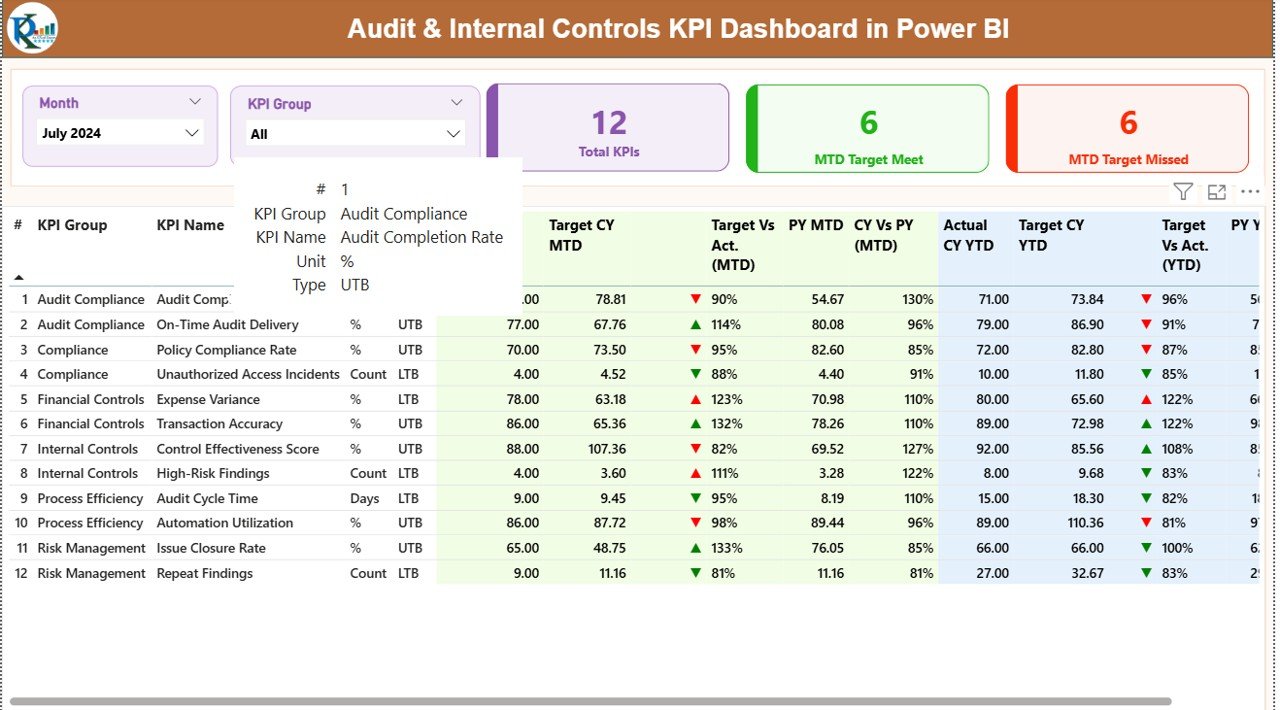
A KPI scorecard built for audit and assurance work. It uses the same Excel-driven structure as pick 2, with actual, target and KPI definition sheets, but the KPI set centres on audit efficiency and control effectiveness rather than firm revenue.
Who it is for: audit partners, assurance managers, internal audit teams and firms offering internal control reviews to clients.
- Summary page with cards for total KPIs, MTD target met and MTD target missed, plus a detailed MTD and YTD KPI table.
- Trend page with combo charts comparing current year, previous year and target.
- Drill-through KPI Definition page so every reviewer reads each metric the same way.
- Monthly update from the Excel input sheets, with no DAX to write.
Concrete uses: monitor audits completed on schedule and average days from fieldwork to report; show the quality control partner whether open findings are falling quarter on quarter; and report control-testing progress to a client’s audit committee. Price: $11.99. Get the Audit & Internal Controls KPI Dashboard →
Best for: audit practices that report quality and timeliness KPIs.
8. Corporate Audit Dashboard in Google Sheets

A transaction-level audit tracker rather than a scorecard. Each audit is a row, and the dashboard turns those rows into compliance scores, risk levels, findings and audit cost across departments, locations and auditors, with a search tool for pulling up any record.
Who it is for: audit managers who track many engagements or locations and want the findings and cost picture in one shared file.
- Overview with average compliance score, total audit cost, audits by type, status and month.
- Risk and compliance view: critical-risk audits, high-risk findings, re-audit requirements.
- Findings by category, location, department and auditor.
- Cost and efficiency view with average audit cost by location, auditor and month, plus a keyword search.
Concrete uses: see which auditor raises the most high-risk findings and whether their reviews take longer; compare average audit cost by location before quoting a new multi-site client; and track which audits need a re-audit after corrective action. Price: $9.99. Get the Corporate Audit Dashboard in Google Sheets →
Best for: shared audit findings and cost tracking on a small budget.
The accounting firm KPIs every dashboard should show
Whichever accounting firm dashboard template you pick, make sure the monthly report answers these questions. The formulas work in any spreadsheet once your time, billing and client data sit in one table.
| KPI | Formula | What to watch for |
|---|---|---|
| Chargeable (utilization) rate | Billable hours divided by total available hours | Varies by level; partners bill less than staff. Track the trend by person, not one month |
| Realization rate | Fees billed divided by standard value of time worked | Falling figures mean write-downs on fixed-fee or underquoted jobs |
| Collection rate | Cash collected divided by fees billed | Commonly targeted at 95% or above for recurring clients |
| WIP days (lockup) | Unbilled WIP divided by average daily fee value | Rising WIP days means finished work is not being invoiced |
| Debtor days (DSO) | Receivables divided by fees billed, times days in period | Chase anything past 60 days before year-end |
| Profit margin by service | (Service revenue minus service cost) divided by service revenue | Bookkeeping and payroll often trail tax and advisory work |
| Revenue per full-time employee | Net fee revenue divided by FTE headcount | Compare against your own history and peer surveys |
| On-time filing rate | Returns filed by deadline divided by returns due | Anything under 100% needs a named cause |
A quick worked example: a firm billing $80,000 in a month with $104,000 of standard-rate time on the clock has a 76.9% realization rate, and if $72,000 of that is collected, collection realization is 90%. Put both numbers on the monthly dashboard and the partner meeting stops arguing about whether the firm is busy and starts asking why a quarter of the time never reaches an invoice. For deeper formulas, see our DSO and AR/AP metrics guide and the 12 profitability KPIs to track.
How to choose the right accounting firm dashboard template
Match the template to two things: whether you need reporting or a system to run the work, and the software your team already uses.
- Which services make money: the Accounting Firms Dashboard in Power BI ($17.99).
- Monthly partner scorecard, Power BI: the Accounting Firms KPI Dashboard in Power BI ($11.99).
- Monthly partner scorecard, Excel only: the Accounting Firms KPI Dashboard in Excel ($14.99).
- Deadlines, jobs, documents and WIP: the Accounting Firm Client Management System ($39.99).
- Keeping books for trading clients: Accounting Ledger Pro ($39.99).
- Tax practice or tax department: the Tax Compliance KPI Dashboard ($8.99), or the Tax Advisory Dashboard in Power BI ($17.99) for advisory revenue.
- Audit and assurance: the Audit & Internal Controls KPI Dashboard ($11.99) for KPIs, or the Corporate Audit Dashboard ($9.99) for findings and cost.
Other specialist options: the Outsourced Accounting KPI Dashboard in Excel ($14.99) suits firms selling outsourced AP, AR and payroll under SLAs, and the Auditing Firm Management System Web App ($39.99) is the audit-practice twin of pick 4. For client-facing reporting, our 15 finance KPIs guide, the cash flow KPIs guide, the budget variance metrics guide and the payroll KPIs guide show what to put in front of your own clients each month.
When an accounting firm template is NOT the right answer
A dashboard is a reporting layer, and even the two web apps are starter systems, not certified accounting platforms. Be honest about where an accounting firm dashboard template stops:
- You need tax preparation and e-filing. Returns belong in professional tax software. Export filing status into the dashboard; never prepare returns in a spreadsheet.
- You need a client portal with e-signatures and secure document exchange at scale. Dedicated practice management platforms do this better than any template.
- You keep a client’s statutory books. For formal general ledgers with bank feeds, multi-currency and payroll tax filing, use QuickBooks Online, Xero or similar, and report from their exports.
- Your audit methodology needs documented workpapers. Audit software handles sign-offs, sampling and review notes; the audit dashboards here only summarise results.
- Dozens of staff enter data at the same moment. Google Sheets and Apps Script handle light collaboration, but heavy concurrent entry needs a database-backed system.
If none of those apply, and for monthly partner reporting they usually do not, a template is the faster, cheaper and more flexible choice, and it keeps working if you change practice management software later.
Frequently asked questions
What is an accounting firm dashboard template?
An accounting firm dashboard template is a ready-made Power BI, Excel or Google Sheets file that turns your time, billing and client records into KPI cards and charts. You replace the sample data with your own, refresh, and see revenue, expenses, profit margin, billing hours and client satisfaction by service line without building reports by hand.
Which KPIs should a CPA firm track on a dashboard?
Start with chargeable hours, realization rate, collection rate, WIP days, debtor days, profit margin by service line, revenue per employee and on-time filing rate. Add client satisfaction and lead source if you are growing. The Accounting Firms Dashboard and the KPI dashboards in this guide cover most of these out of the box.
Is a dashboard template a replacement for Karbon, TaxDome or Canopy?
No. Practice management software handles client portals, e-signatures, automated workflows and secure document exchange. A dashboard template is a reporting layer on top of exports from those systems or your own spreadsheets, and it costs a one-time $8.99 to $17.99 instead of a per-user monthly subscription.
What is the difference between the Accounting Firms Dashboard and the KPI Dashboard?
The Accounting Firms Dashboard analyses transaction data, so you can slice revenue, profit and billing hours by service, engagement type, region and lead source. The KPI Dashboard is a scorecard: you enter one monthly actual and target per KPI and it shows MTD and YTD performance against target and last year.
Excel, Google Sheets or Power BI: which is best for an accounting firm?
Choose Excel when one partner or practice manager owns the monthly report, Google Sheets when several people need the same live file in a browser, and Power BI when client and engagement data runs into thousands of rows or you present to partners on screen. The web apps suit firms that need to run work, not just report on it.
Can these templates track WIP and unbilled time?
The Accounting Firm Client Management System tracks timesheets with billable value, approvals and billed or unbilled status, and its dashboard shows unbilled WIP. The KPI dashboards can report WIP days as a custom KPI once you enter the monthly figure. The Power BI Accounting Firms Dashboard focuses on billing hours, revenue and margin.
Do I need a Power BI Pro licence?
No. The three Power BI templates open in the free Power BI Desktop application. You need a paid Power BI licence only if you want to publish the report to the Power BI service and share it online with partners who do not have the file.
Is client data safe in these templates?
The files store only what you enter. Use client codes instead of names and tax IDs in dashboards, keep files in your firm’s secured storage, and share Google Sheets versions only with named colleagues. The two web apps deploy in your own Google account, so the data never sits on a NextGenTemplates server.
Do I need macros or coding skills?
No. The Excel and Google Sheets dashboards run on formulas and drop-down selectors, and the Power BI files refresh from Excel input sheets. The web apps need a one-time deployment in your Google account using the step-by-step guide supplied; after that, staff use them in a browser like any other app.
How long does setup take?
Most firms are running in an afternoon. Export clients, jobs, hours, billed and collected amounts from your current tools, paste them into the input or data sheet using the same column headings, refresh, then check the revenue card against a figure you trust from your accounting system before sharing it with partners.
Get more accounting firm templates
Ready to see profit by service line on one page? Start with our best overall accounting firm dashboard template, the Accounting Firms Dashboard in Power BI ($17.99), or the best-value Accounting Firms KPI Dashboard ($11.99). Building reports for clients too? The Finance & Accounting Command Center bundle packs 8 finance templates across Excel, Power BI and Google Sheets for $64.99 instead of $102.92 bought separately.
See how other professional-services firms report with our law firm dashboard templates, the insurance agency templates and the bank and credit union templates, or compare formats in our Power BI dashboard templates ranked by industry. Subscribe to the NextGenTemplates YouTube channel for setup tutorials.