


Days sales outstanding (DSO) in Excel measures the average number of days it takes to collect payment after a credit sale: divide accounts receivable by total credit sales, then multiply by the number of days in the period. Track it alongside nine more AR & AP metrics — DPO, CCC, CEI and AR/AP turnover — to protect cash flow in 2026.
Last updated: September 2026
Key takeaways
- Days sales outstanding Excel formula: (Accounts Receivable ÷ Total Credit Sales) × Days in Period. A DSO within 1.25× of your payment terms (about 37 days on net-30) is healthy.
- Track 10 metrics, not one: DSO, Best Possible DSO, DPO, Cash Conversion Cycle, AR Turnover, AP Turnover, Collection Effectiveness Index, Average Days Delinquent, Bad Debt to Sales, and AR Aging >90 days.
- Cash Conversion Cycle = DSO + DIO − DPO. Best-in-class firms push it toward zero or negative; 30–60 days is normal for most SMBs.
- The Accounts Receivable KPI Dashboard in Excel ($12.99) calculates DSO, CEI, ADD and aging automatically — no formula-building required.
- All 8 templates are $4.99–$12.99; the Finance & Accounting Command Center bundle ($64.99) covers every metric across Excel, Power BI and Google Sheets.
The 10 AR & AP metrics at a glance
| Metric | Formula | Healthy benchmark | Where to see it |
|---|---|---|---|
| Days Sales Outstanding (DSO) | (AR ÷ Credit Sales) × Days | < 45 days; ≤ 1.25× terms | AR KPI Dashboard |
| Best Possible DSO (BPDSO) | (Current AR ÷ Credit Sales) × Days | Within 5–7 days of DSO | AR KPI Dashboard |
| Days Payable Outstanding (DPO) | (AP ÷ COGS) × Days | 30–60 days; ≈ supplier terms | AP KPI Dashboard |
| Cash Conversion Cycle (CCC) | DSO + DIO − DPO | 30–60 days; lower is better | Cash Flow KPI Dashboard |
| AR Turnover Ratio | Net Credit Sales ÷ Avg AR | 6–12× per year | AR KPI Dashboard |
| AP Turnover Ratio | Purchases ÷ Avg AP | 6–10× per year | AP KPI Dashboard |
| Collection Effectiveness Index (CEI) | See section below | > 80% good; > 90% excellent | AR KPI Dashboard |
| Average Days Delinquent (ADD) | DSO − BPDSO | < 5–10 days | AR KPI Dashboard |
| Bad Debt to Sales | (Bad Debt ÷ Credit Sales) × 100 | < 1% of sales | AR KPI Dashboard |
| AR Aging > 90 days | (AR >90 days ÷ Total AR) × 100 | < 5–10% of AR | AR KPI Dashboard |
The 8 dashboard templates compared
| Template | Format | Best for | Price |
|---|---|---|---|
| Accounts Receivable KPI Dashboard (Best overall) | Excel | DSO, CEI, ADD, aging in one file | $12.99 |
| Accounts Payable KPI Dashboard | Excel | DPO & AP turnover control | $12.99 |
| Cash Flow KPI Dashboard | Excel | Cash Conversion Cycle & liquidity | $12.99 |
| Accounts Receivable KPI Dashboard (Best value) | Google Sheets | Free, cloud-based DSO tracking | $8.99 |
| Accounts Payable KPI Dashboard | Power BI | Interactive DPO drill-down | $11.99 |
| Accounts Payable KPI Dashboard | Google Sheets | Shared AP tracking | $9.99 |
| Cash Flow KPI Dashboard | Google Sheets | Live cash-cycle monitoring | $9.99 |
| Accounts Payable & Receivable Calendar | Excel | Due-date & collection scheduling | $4.99 |
How we picked these
We searched the full NextGenTemplates catalog of 900+ paid Excel, Google Sheets and Power BI templates for tools that actually calculate the receivables and payables metrics finance teams are graded on. We kept only dashboards that compute DSO, DPO, turnover, aging or the cash conversion cycle from your own ledger data — not generic bookkeeping sheets. Off-topic products originally tagged to this list (satellite imaging, credit-rating agencies) were removed because they do not touch AR/AP. Every price below is the live USD store price at publication.
The 10 AR & AP metrics to track in 2026
Each metric below gives you a one-sentence definition, the exact formula, a realistic benchmark range, and the single mistake that quietly wrecks the number. Together they turn a pile of invoices into a working-capital early-warning system. If you would rather not build the formulas yourself, every one of these is pre-wired in the days sales outstanding Excel dashboard further down.
1. Days Sales Outstanding (DSO)
Definition: The average number of days it takes to collect cash after a credit sale.
Formula: DSO = (Accounts Receivable ÷ Total Credit Sales) × Number of Days in Period.
Benchmark: Under 45 days is generally healthy; a DSO no more than 1.25× your payment terms (about 37 days on net-30) means collections are on track. It varies widely by industry, so trend it against yourself.
Common mistake: Using total sales instead of credit sales in the denominator. Cash sales never sit in receivables, so including them understates DSO and hides a collections problem. See Investopedia’s DSO reference for the standard definition.
2. Best Possible DSO (BPDSO)
Definition: The DSO you would achieve if every invoice that is not yet overdue were collected exactly on the due date.
Formula: BPDSO = (Current Receivables ÷ Total Credit Sales) × Number of Days.
Benchmark: The gap between actual DSO and BPDSO should stay within 5–7 days. A wide gap means overdue invoices, not slow terms, are the problem.
Common mistake: Ignoring BPDSO entirely. Reporting DSO with no BPDSO tells you the speed but never whether the delay is caused by generous terms or by genuine delinquency.
3. Days Payable Outstanding (DPO)
Definition: The average number of days your business takes to pay its own suppliers.
Formula: DPO = (Accounts Payable ÷ Cost of Goods Sold) × Number of Days.
Benchmark: Typically 30–60 days, ideally matching or slightly exceeding supplier terms so you conserve cash without straining relationships.
Common mistake: Stretching DPO as high as possible. Pushing every supplier to the limit forfeits early-payment discounts (often 1–2%) and damages the goodwill you need when you require flexibility yourself.
4. Cash Conversion Cycle (CCC)
Definition: How many days cash is tied up between paying suppliers and collecting from customers.
Formula: CCC = DSO + DIO (Days Inventory Outstanding) − DPO.
Benchmark: 30–60 days is normal for most SMBs; best-in-class firms drive it toward zero or even negative by collecting before they pay.
Common mistake: Optimizing one leg in isolation — for example slashing DSO while letting DPO collapse. The three levers move together, which is why a single cash flow KPI dashboard that shows all three at once beats three separate spreadsheets.
5. Accounts Receivable Turnover Ratio
Definition: How many times per year you collect your average receivables balance.
Formula: AR Turnover = Net Credit Sales ÷ Average Accounts Receivable.
Benchmark: 6–12 times a year for most businesses; higher means faster collection, though an unusually high ratio can signal overly strict credit terms costing you sales.
Common mistake: Using period-end AR instead of the average of opening and closing balances. Seasonal spikes then distort the ratio badly.
6. Accounts Payable Turnover Ratio
Definition: How many times per year you pay off your average payables balance.
Formula: AP Turnover = Total Supplier Purchases ÷ Average Accounts Payable.
Benchmark: 6–10 times a year is typical; a falling ratio can mean cash-flow strain, while a very high one may mean you are paying faster than necessary.
Common mistake: Substituting COGS for actual purchases when the two differ materially (large inventory swings), which misstates the ratio.
7. Collection Effectiveness Index (CEI)
Definition: The percentage of receivables actually collected in a period versus what was available to collect — a quality-of-collections score.
Formula: CEI = [(Beginning AR + Monthly Credit Sales − Ending Total AR) ÷ (Beginning AR + Monthly Credit Sales − Ending Current AR)] × 100.
Benchmark: Above 80% is good; above 90% is excellent and signals a disciplined collections process.
Common mistake: Treating CEI as interchangeable with DSO. DSO measures speed; CEI measures the effectiveness of the collection effort, and the two can diverge sharply in a growing business.
8. Average Days Delinquent (ADD)
Definition: The average number of days invoices are paid late, beyond their due date.
Formula: ADD = DSO − Best Possible DSO.
Benchmark: Keep it under 5–10 days. Rising ADD is the earliest sign that customer payment behaviour is deteriorating.
Common mistake: Reporting DSO with no ADD. ADD isolates the pure “lateness” component, which DSO alone blends with your standard terms.
9. Bad Debt to Sales Ratio
Definition: The share of credit sales you ultimately write off as uncollectable.
Formula: Bad Debt to Sales = (Bad Debt Written Off ÷ Total Credit Sales) × 100.
Benchmark: Under 1% is healthy for most industries; higher is acceptable in high-risk lending or subscription models but must be provisioned for.
Common mistake: Writing debt off too late. Delaying write-offs flatters the ratio and the aging report while the real cash was lost months earlier.
10. AR Aging Over 90 Days
Definition: The proportion of your receivables that are more than 90 days past due — the highest-risk bucket.
Formula: AR Aging >90 = (Receivables More Than 90 Days Past Due ÷ Total Receivables) × 100.
Benchmark: Keep it under 5–10% of total AR; anything over 90 days past due has a steeply falling probability of collection.
Common mistake: Watching only the total AR figure. A stable total can hide a shift from current invoices into the 90-plus bucket — which an aging breakdown catches instantly.
Stop rebuilding these formulas every month. The Accounts Receivable KPI Dashboard in Excel ($12.99) computes DSO, BPDSO, CEI, ADD, turnover and full aging from a single paste of your ledger. Get the AR dashboard →
The 8 best days sales outstanding Excel dashboard templates for 2026
1. Accounts Receivable KPI Dashboard in Excel — best overall
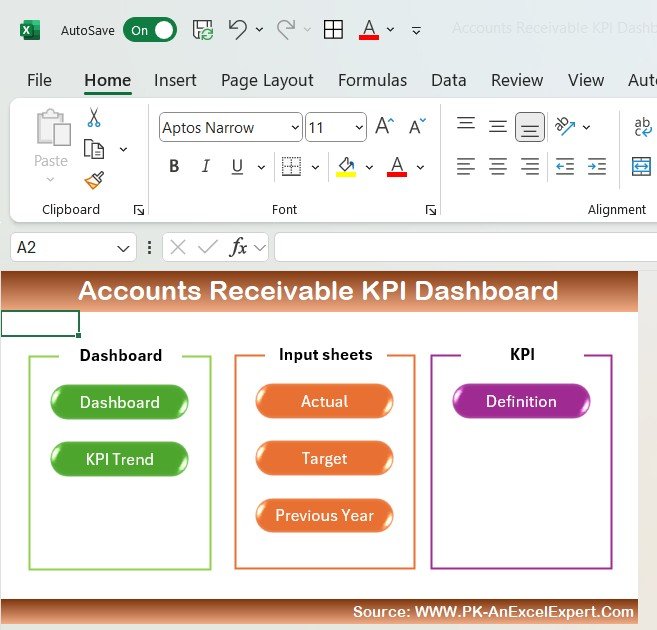
What it is: A ready-built Excel dashboard that turns your invoice ledger into every receivables metric on this page. It earns best overall because it covers six of the ten metrics — DSO, BPDSO, CEI, ADD, AR turnover and aging — in one file with zero formula-building.
Who it is for: Finance managers, credit controllers and small-business owners who bill on credit terms.
What is inside:
- Automated DSO and Best Possible DSO with month-over-month trend
- Collection Effectiveness Index and Average Days Delinquent tiles
- Full 0–30 / 31–60 / 61–90 / 90+ aging bucket breakdown
- Top-overdue-customer ranking for prioritised chasing
Use cases: Cut a 52-day DSO toward your 40-day target; spot the 8% of AR sitting past 90 days; brief management with one screenshot instead of a pivot-table marathon.
Price: $12.99. View the AR KPI Dashboard →
Best for: The single most complete receivables tracker for Excel users.
2. Accounts Payable KPI Dashboard in Excel

What it is: The payables counterpart to #1, built to manage DPO and AP turnover so you conserve cash without missing discounts.
Who it is for: AP teams and owners who want to time supplier payments deliberately.
What is inside: DPO trend, AP turnover ratio, upcoming-payment schedule, discount-capture tracking and supplier concentration.
Use cases: Extend DPO from 28 to 40 days to free working capital; flag invoices with a 2% early-pay discount worth taking; balance cash timing against the AR side.
Price: $12.99. View the AP KPI Dashboard →
Best for: Teams optimizing DPO and supplier-payment timing in Excel.
3. Cash Flow KPI Dashboard in Excel
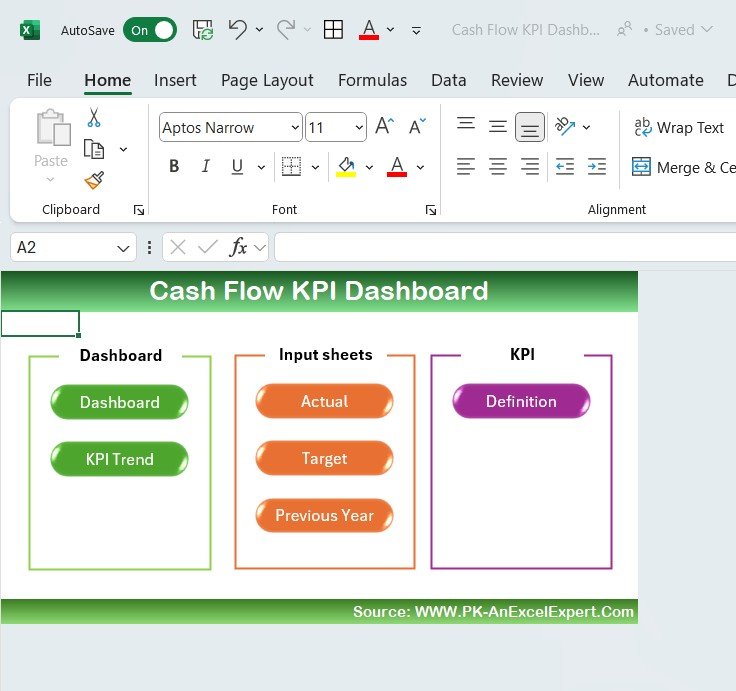
What it is: The dashboard that ties DSO and DPO together into the Cash Conversion Cycle and overall liquidity view.
Who it is for: Owners and controllers who need the working-capital big picture, not just one side of the ledger.
What is inside: CCC calculation, operating cash-flow trend, inflow-vs-outflow waterfall and runway indicators.
Use cases: Watch CCC fall from 55 to 35 days as collections tighten; model the cash impact of a new payment term; catch a runway squeeze a quarter early.
Price: $12.99. View the Cash Flow KPI Dashboard →
Best for: Seeing the whole cash conversion cycle in one place.
4. Accounts Receivable KPI Dashboard in Google Sheets — best value
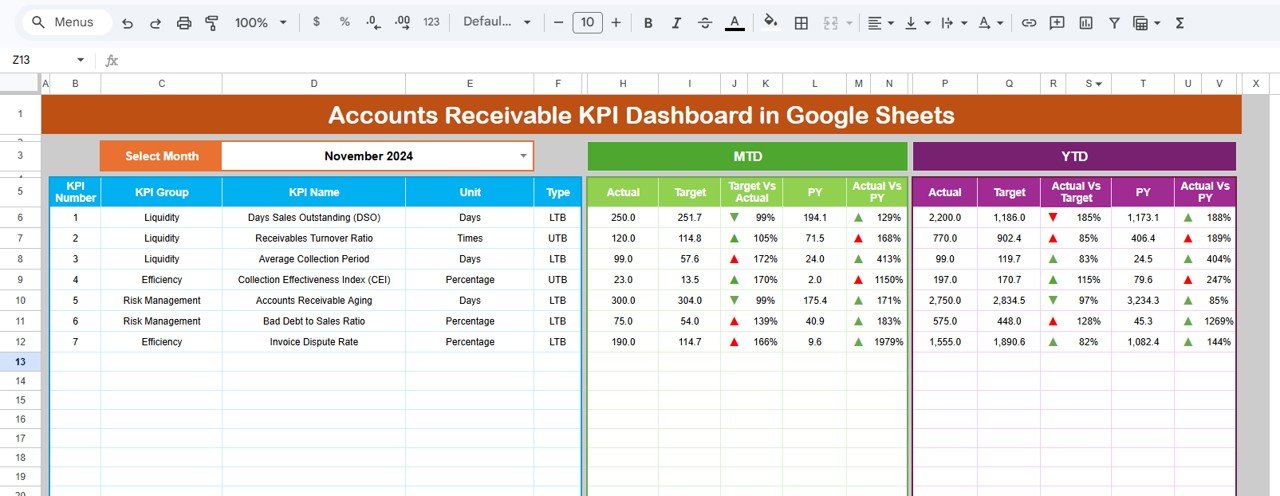
What it is: The same receivables metric set as #1 in a free, cloud-based, share-anywhere Google Sheets build.
Who it is for: Remote and multi-user finance teams who live in Google Workspace.
What is inside: DSO, aging buckets, CEI, and collection-priority list with live collaboration and no software cost.
Use cases: Let three people update collections notes at once; auto-refresh DSO for a weekly stand-up; share read-only with leadership.
Price: $8.99. View the Google Sheets AR Dashboard →
Best for: The lowest-cost full DSO dashboard for cloud teams.
5. Accounts Payable KPI Dashboard in Power BI
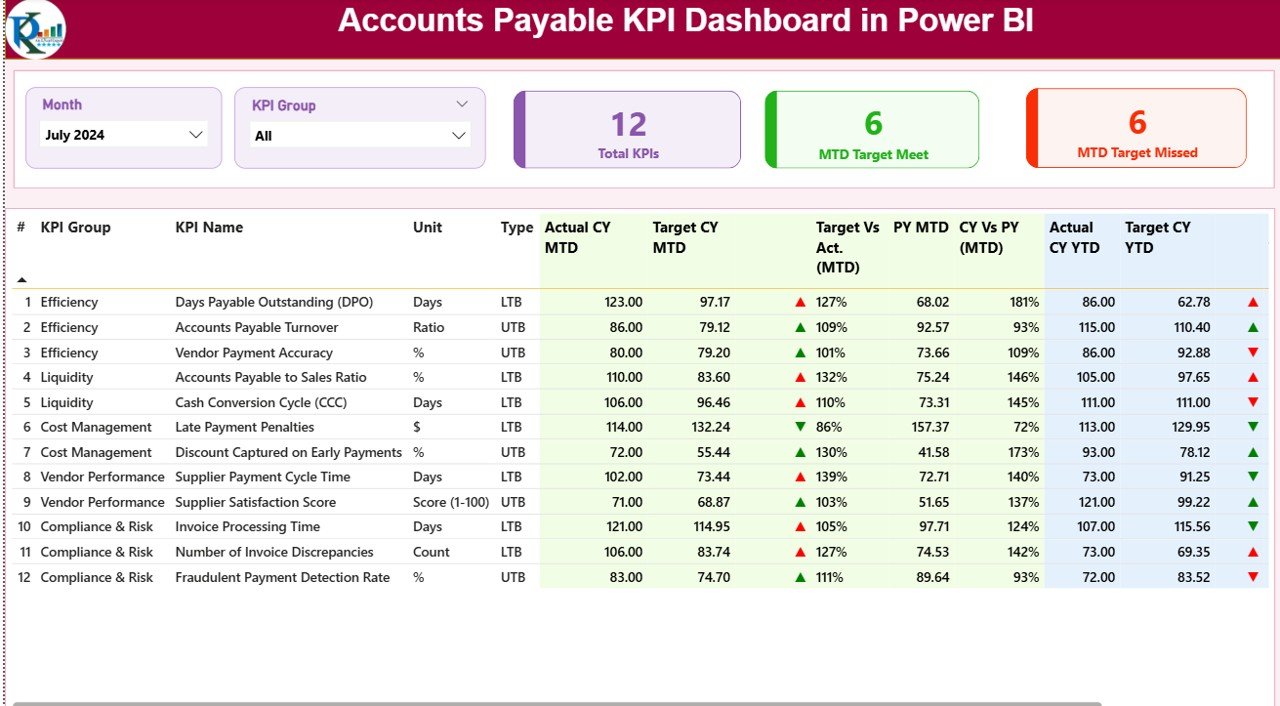
What it is: An interactive Power BI report for DPO and AP turnover with slice-and-dice by supplier, entity and period.
Who it is for: Larger AP functions already using Power BI for reporting.
What is inside: DPO and AP turnover visuals, drill-through by vendor, aging of payables and refreshable data model.
Use cases: Drill from group DPO into a single problem vendor; compare payment timing across subsidiaries; schedule automatic refreshes.
Price: $11.99. View the Power BI AP Dashboard →
Best for: Interactive, drillable payables analysis.
6. Accounts Payable KPI Dashboard in Google Sheets
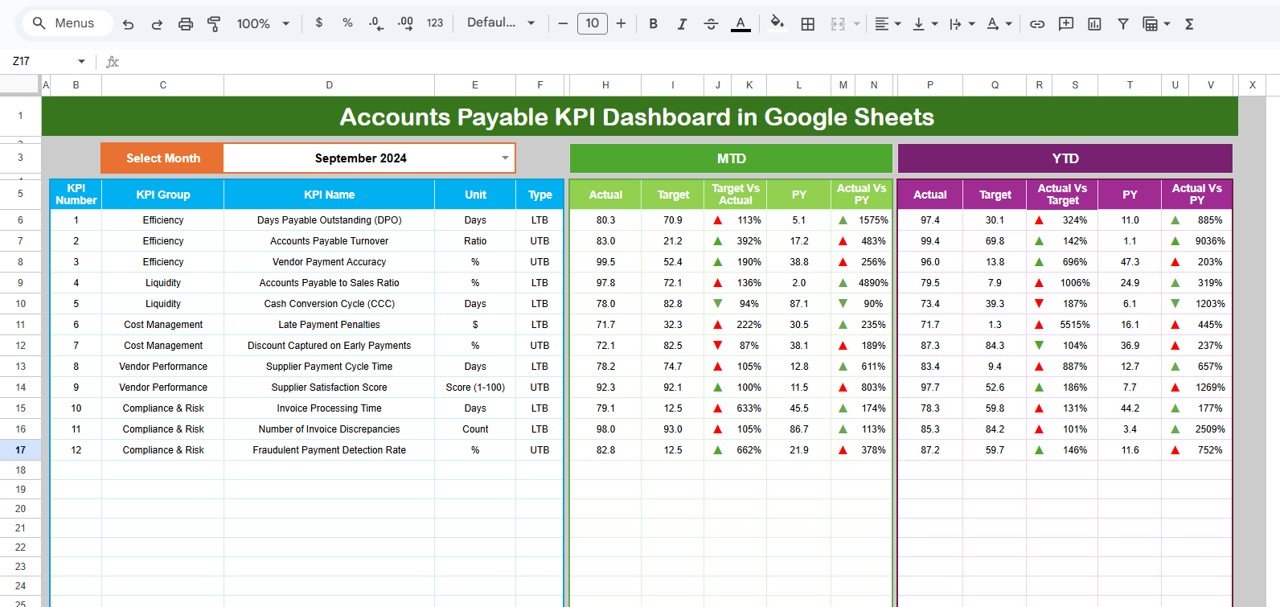
What it is: A cloud-based AP dashboard covering DPO, turnover and a payment calendar for collaborative teams.
Who it is for: Google Workspace users who manage supplier payments as a group.
What is inside: DPO trend, AP turnover, upcoming-payments view and supplier list, all editable in the browser.
Use cases: Share the payment queue with approvers; keep DPO visible to the owner in real time; avoid desktop-software licensing.
Price: $9.99. View the Google Sheets AP Dashboard →
Best for: Shared, browser-based payables tracking.
7. Cash Flow KPI Dashboard in Google Sheets
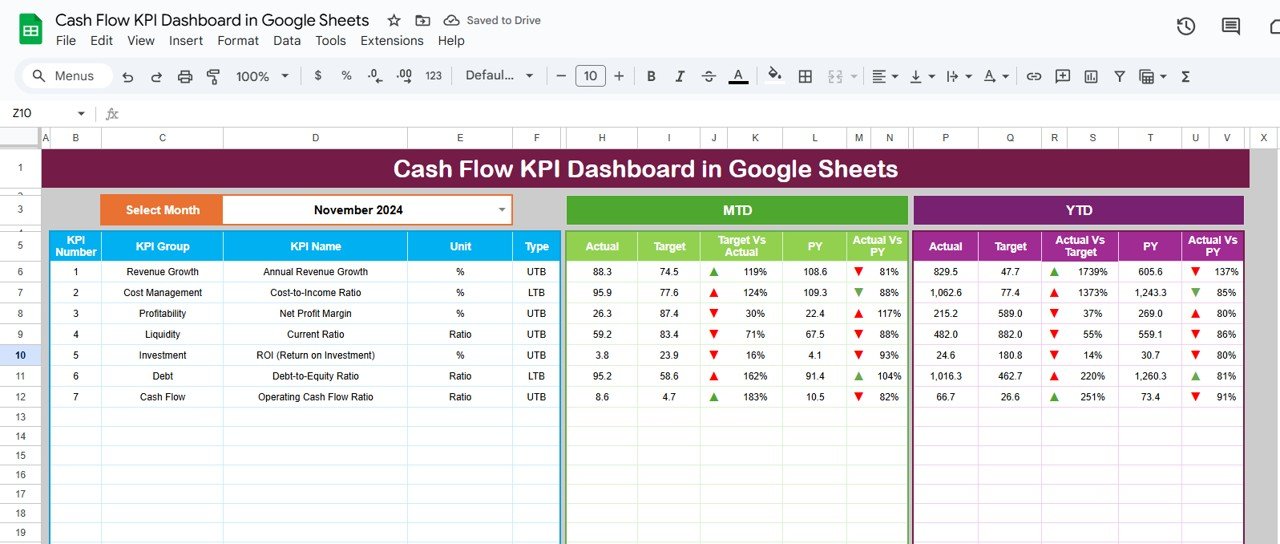
What it is: The cloud version of #3 for teams that want the cash conversion cycle live in Google Sheets.
Who it is for: Distributed teams monitoring liquidity together.
What is inside: CCC, cash-flow trend, inflow/outflow view and runway signals with live collaboration.
Use cases: Keep a shared cash dashboard on a wall display; update actuals daily; tie DSO and DPO changes to cash impact instantly.
Price: $9.99. View the Google Sheets Cash Flow Dashboard →
Best for: Live, collaborative cash-cycle monitoring.
8. Accounts Payable & Receivable Calendar in Excel
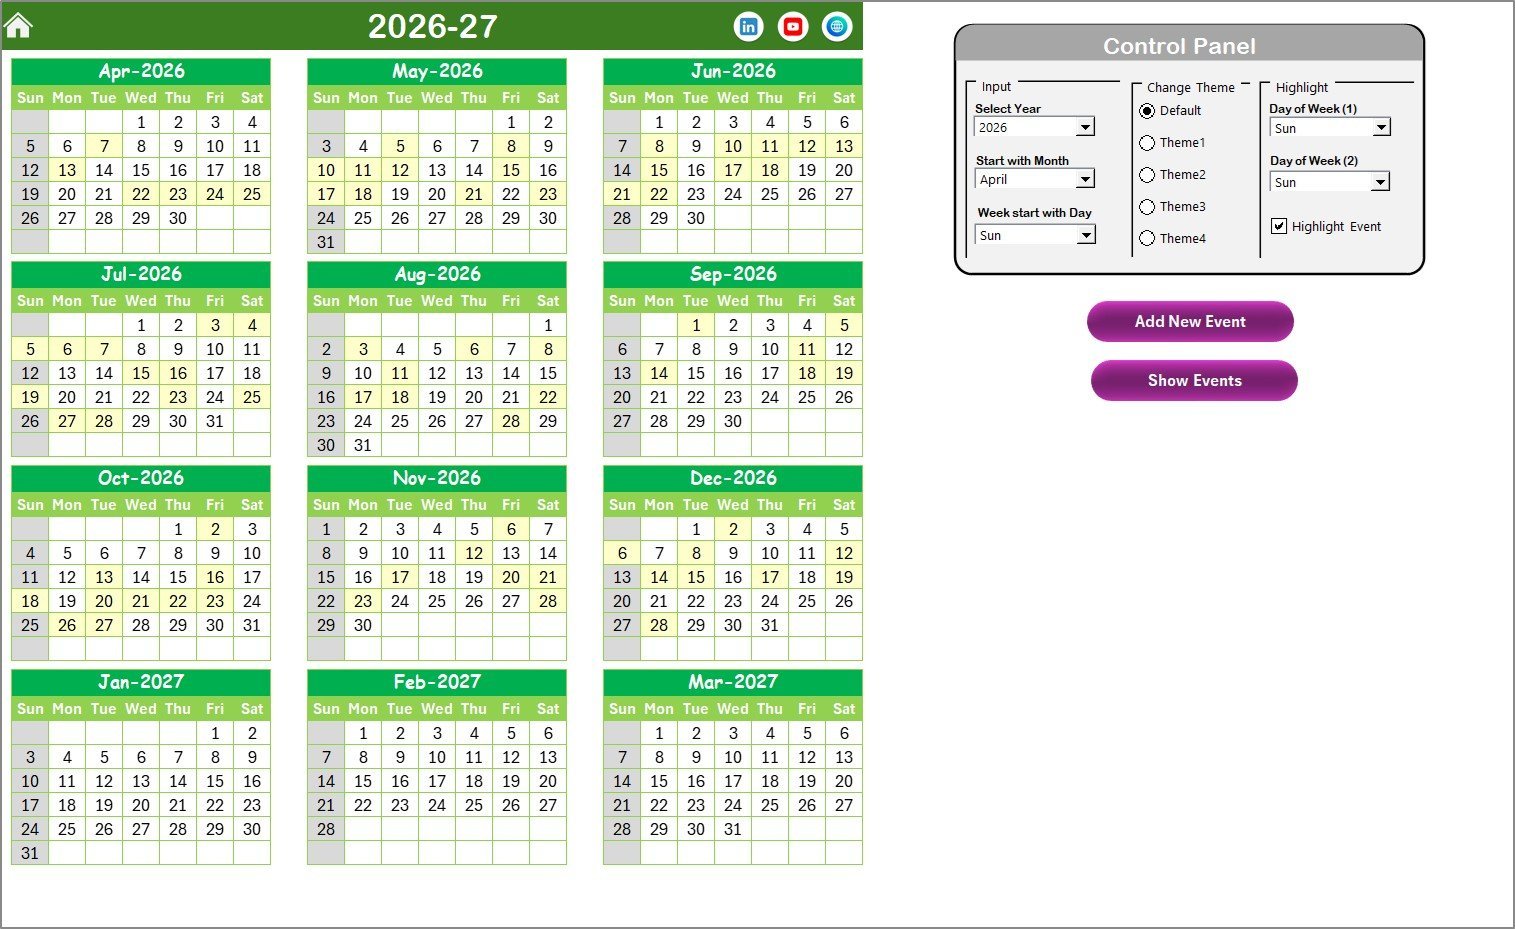
What it is: A due-date calendar that plots when receivables land and payables fall due so you never miss a collection or payment.
Who it is for: Micro-businesses and freelancers who want scheduling before full dashboards.
What is inside: Monthly AR/AP calendar view, due-date reminders and a running balance of expected cash timing.
Use cases: See a week where three big invoices are due against one supplier payment; time collections calls; smooth cash across the month.
Price: $4.99. View the AR/AP Calendar →
Best for: The cheapest way to schedule AR and AP due dates.
How to choose between them
Match the tool to your platform and your bottleneck:
- You bill on credit and collections are slow → start with the Accounts Receivable KPI Dashboard.
- Your cash is tight because you pay suppliers too fast → the Accounts Payable KPI Dashboard.
- You need the whole working-capital picture → the Cash Flow KPI Dashboard for the cash conversion cycle.
- Your team works in Google Workspace → pick the Google Sheets edition of any of the above.
- You want everything at once → the Finance & Accounting Command Center bundle is the best per-template value.
When a template is NOT the right answer
These dashboards are report-and-decide tools, not systems of record. If you invoice hundreds of customers a day, you need proper AR automation or an ERP that captures every transaction at source — a spreadsheet re-keyed monthly will always lag reality. If your collections require automated dunning emails, customer portals or payment-gateway reconciliation, buy dedicated software instead. And if you cannot yet export clean credit-sales and AR/AP balances from your accounting system, fix that data first — every metric here is only as accurate as the ledger you paste in. For growing but still lean finance teams, though, a $12.99 template beats a $50/month subscription every time.
Frequently asked questions
How do you calculate days sales outstanding in Excel?
Divide accounts receivable by total credit sales, then multiply by the number of days in the period. In Excel that is =(AR_cell / Credit_Sales_cell) * 365 for an annual figure, or use 30 or 90 for a month or quarter. Always use credit sales, not total sales, in the denominator.
What is a good DSO benchmark?
Under 45 days suits most businesses, and a DSO no higher than about 1.25 times your payment terms is healthy — roughly 37 days on net-30 terms. Benchmarks vary sharply by industry, so the most useful comparison is your own DSO trend month over month.
What is the difference between DSO and DPO?
DSO (days sales outstanding) measures how fast you collect cash from customers, while DPO (days payable outstanding) measures how long you take to pay suppliers. You generally want lower DSO and moderately higher DPO, because collecting sooner and paying later frees up working capital.
What is the cash conversion cycle formula?
Cash Conversion Cycle = DSO + Days Inventory Outstanding − DPO. It shows how many days cash is tied up between paying for inputs and collecting from customers. Lower is better; the best companies reach zero or a negative cycle by collecting before their bills fall due.
How is the Collection Effectiveness Index different from DSO?
DSO measures the speed of collections; CEI measures their effectiveness as a percentage of what was collectable. A fast-growing company can have a rising DSO yet a strong CEI above 90%, because the higher DSO is driven by sales growth rather than by poor collection performance.
Can I track AR and AP metrics in Google Sheets instead of Excel?
Yes. The Accounts Receivable and Accounts Payable KPI dashboards in Google Sheets calculate the same DSO, DPO, turnover and aging metrics, with the advantage of real-time collaboration and no desktop software cost.
What is Average Days Delinquent (ADD)?
ADD is the average number of days invoices are paid past their due date, calculated as DSO minus Best Possible DSO. It isolates pure lateness from your standard payment terms, making it a sharper early-warning signal than DSO alone when customer behaviour starts slipping.
What is a healthy AR aging ratio?
Keep receivables more than 90 days past due below 5–10% of total AR. The probability of collecting an invoice drops steeply after 90 days, so a rising 90-plus bucket — even when total AR looks stable — is one of the clearest warning signs of future bad debt.
Which metric matters most for cash flow?
No single metric wins. DSO, DPO and the cash conversion cycle move together, so watching only one can mislead you. The most reliable approach is a dashboard that shows receivables, payables and the resulting cash cycle side by side, so you see the trade-offs in real time.
Are these dashboard templates a one-time purchase?
Yes. Every template listed here is a one-time purchase from $4.99 to $12.99, or $64.99 for the full bundle — with no subscription. You download the file, paste in your ledger data, and own it permanently.
Get more AR & AP templates
Want every metric on this page in one purchase? The Finance & Accounting Command Center bundle ($64.99) packs 8 premium templates across Excel, Power BI and Google Sheets — receivables, payables, cash flow and more — for less than buying them separately. It is the best-value way to run days sales outstanding Excel tracking plus DPO, CCC and CEI from day one. Get the Finance & Accounting bundle →
Prefer to see them in action first? Watch build walkthroughs and dashboard tutorials on the NextGenTemplates YouTube channel.
More finance and operations reading: the best sales dashboard templates for 2026, 10 CRM metrics to track in 2026, 12 sales pipeline metrics, Coupa procurement alternatives in Excel, how to run a CRM in Excel, and Domo BI dashboard alternatives.