

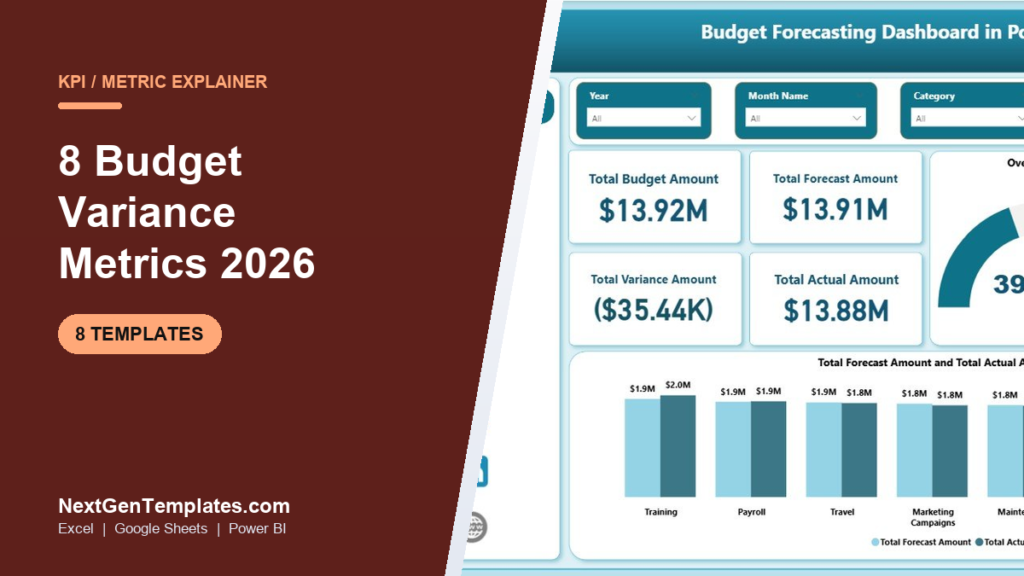
Budget variance analysis is the practice of measuring the gap between what you budgeted and what actually happened, then explaining why. The eight metrics that matter in 2026 are budget variance in dollars and percent, favorable vs unfavorable variance, revenue variance, cost variance, forecast accuracy, run-rate variance and year-to-date variance.
Last updated: September 2026
Key takeaways
- Sound budget variance analysis tracks eight metrics, not one: dollar variance, percent variance, favorable/unfavorable, revenue variance, cost variance, forecast accuracy, run-rate variance and YTD variance.
- A widely used control threshold is a +/-5% percentage variance for controllable line items; anything past +/-10% almost always needs a written explanation.
- Forecast accuracy above 90% (MAPE under 10%) is considered strong for a monthly financial forecast.
- The most common mistake is reading a large favorable variance as good news when it usually signals under-delivery, timing shifts or a budget that was set too loosely.
- The Budget Forecasting Dashboard in Excel ($17.99) calculates all eight metrics automatically; a Google Sheets edition starts at $9.99.
Budget variance analysis templates compared
| Template | Format | Best for | Price |
|---|---|---|---|
| Budget Forecasting Dashboard (Best overall) | Excel | Full monthly budget vs actual vs forecast in one file | $17.99 |
| Budget Forecasting Dashboard | Power BI | Refreshable, board-ready variance reporting | $17.99 |
| Budget Forecasting Dashboard (Best value) | Google Sheets | Shared, cloud budget variance analysis for teams | $9.99 |
| Manufacturing Production Variance Analysis Dashboard | Excel | Cost, volume and efficiency variance for operations | $17.99 |
| Financial Planning KPI Dashboard | Power BI | Executive KPI view with variance built in | $11.99 |
| Forecast Vs Actual Chart with Safe Zone Range | Excel | Visualising variance against a tolerance band | $4.99 |
| Budget Planning Calendar | Excel | Timing the budget cycle and review dates | $4.99 |
| Budget Planning Calendar | Google Sheets | Shared planning calendar for the finance team | $4.99 |
How we picked these
We searched the full NextGenTemplates catalogue of 900+ paid spreadsheet and dashboard products and shortlisted every template that actually calculates a budget-versus-actual gap rather than just storing numbers. Each pick had to compute at least one of the eight variance metrics below, ship with realistic sample data, and be usable by a finance team without VBA rebuilding. We excluded generic budget trackers with no variance logic and single-purpose personal budgets, because this guide is about business budget variance analysis, not household budgeting.
What is budget variance analysis?
Budget variance analysis compares your planned figures against actual results for a period, quantifies the difference, and attributes it to a cause: price, volume, timing, or a bad assumption. It is the feedback loop that turns a static budget into a management tool. Done monthly, it tells you whether you are on plan, which lines are drifting, and whether next quarter’s forecast needs to move.
The mechanics are simple arithmetic; the value is in tracking the right set of metrics consistently. Below are the eight that a 2026 finance function should report every close. For a broader look at the underlying spreadsheets, see our Excel and Google Sheets budget template comparison.
The 8 budget variance metrics to track in 2026
1. Budget variance ($)
Definition: The absolute dollar difference between actual and budgeted amounts for a line, department or the whole P&L.
Formula: Budget Variance ($) = Actual – Budget
Benchmark: Context-dependent, but most teams set an escalation threshold at an absolute value that represents 1-2% of total departmental budget.
Common mistake: Reporting only the dollar figure. A $50,000 variance is trivial on a $10M line and a crisis on a $200K line, which is why you always pair it with the percentage below.
2. Budget variance (%)
Definition: The dollar variance expressed as a percentage of budget, so lines of different sizes can be compared on one scale.
Formula: Budget Variance (%) = (Actual – Budget) / Budget x 100
Benchmark: +/-5% is a common “within tolerance” band for controllable costs; +/-10% or more is usually the point at which a written explanation is required.
Common mistake: Dividing by actual instead of budget. The denominator is always the budget (the plan you are measuring against), otherwise your percentages drift every time actuals move.
3. Favorable vs unfavorable variance
Definition: A directional label that says whether a variance helped or hurt profit, which depends on whether the line is revenue or cost.
Formula: Favorable when Actual Revenue > Budget, or Actual Cost < Budget; Unfavorable when the reverse is true.
Benchmark: No numeric range – this is a sign convention. The goal is that 80%+ of your lines sit inside tolerance in either direction.
Common mistake: Treating every favorable variance as good. A large favorable cost variance often means work did not get done, a hire slipped, or spend was simply deferred to next month.
4. Revenue variance
Definition: The gap between actual and budgeted revenue, ideally split into price variance and volume variance.
Formula: Revenue Variance = Actual Revenue – Budgeted Revenue; Volume component = (Actual Units – Budget Units) x Budget Price.
Benchmark: Mature FP&A teams aim to keep total revenue variance inside +/-3-5% of plan at the company level.
Common mistake: Leaving revenue variance as a single number. Without the price-versus-volume split you cannot tell whether you discounted too hard or simply sold fewer units. Our revenue analysis dashboard guide covers the split in depth.
5. Cost (spending) variance
Definition: The difference between actual and budgeted costs, the core of expense control and the most-watched half of budget variance analysis.
Formula: Cost Variance = Actual Cost – Budgeted Cost (a negative result is favorable for costs).
Benchmark: Controllable operating costs are typically held to +/-5%; direct materials and labour in manufacturing are often held to +/-2-3%.
Common mistake: Not separating fixed from variable costs. A cost that rose because volume rose is not overspending – it needs a flexible (flexed) budget to judge fairly. See our procurement cost analysis walkthrough for the flexing method.
6. Forecast accuracy (forecast variance)
Definition: How close your latest forecast came to actuals, the quality check on the forecasting process itself.
Formula: Forecast Accuracy = (1 – |Actual – Forecast| / Actual) x 100; equivalently, MAPE = mean of |Actual – Forecast| / Actual.
Benchmark: 90%+ accuracy (MAPE below 10%) is strong for a monthly financial forecast; below 80% signals the forecast model needs work.
Common mistake: Measuring forecast accuracy against the original annual budget rather than the most recent re-forecast. They answer different questions – budget variance measures the plan, forecast accuracy measures your prediction.
7. Run-rate variance
Definition: The gap between your annualised current spending pace (run rate) and the annual budget, a forward-looking early-warning metric.
Formula: Run-Rate Variance = (Actual to date / Months elapsed x 12) – Annual Budget.
Benchmark: A run rate more than 5-8% above annual budget by mid-year is a reliable signal you will overshoot without action.
Common mistake: Applying a flat run rate to seasonal businesses. If 40% of revenue lands in Q4, a straight-line annualisation of Q1 numbers will badly misstate the year – weight the run rate by your seasonality curve.
8. Year-to-date (YTD) variance
Definition: The cumulative variance from the start of the fiscal year to the current period, smoothing out one-off monthly timing noise.
Formula: YTD Variance = Cumulative Actual (Jan-current) – Cumulative Budget (Jan-current).
Benchmark: Most teams want YTD variance inside +/-3% of the YTD budget at the total-company level, even when individual months swing wider.
Common mistake: Reacting to a single bad month while ignoring the YTD trend. A month can miss on timing alone; a YTD variance that keeps widening for three periods is a real, structural problem.
Budget variance metrics at a glance
| Metric | Formula | Benchmark | Where to see it |
|---|---|---|---|
| Budget variance ($) | Actual – Budget | Escalate above 1-2% of dept budget | Budget Forecasting Dashboard |
| Budget variance (%) | (Actual – Budget) / Budget x 100 | +/-5% tolerance, +/-10% explain | Budget Forecasting Dashboard |
| Favorable / unfavorable | Sign of variance by line type | 80%+ of lines in tolerance | Forecast Vs Actual Chart |
| Revenue variance | Actual Rev – Budget Rev (split price/volume) | +/-3-5% of plan | Financial Planning KPI Dashboard |
| Cost variance | Actual Cost – Budget Cost | +/-2-5% by cost type | Manufacturing Variance Dashboard |
| Forecast accuracy | (1 – |Actual – Forecast| / Actual) x 100 | 90%+ (MAPE <10%) | Budget Forecasting Dashboard |
| Run-rate variance | (Actual / months x 12) – Annual Budget | Act above +5-8% by mid-year | Financial Planning KPI Dashboard |
| YTD variance | Cumulative Actual – Cumulative Budget | +/-3% of YTD budget | Budget Forecasting Dashboard |
For the definitions above we follow standard managerial-accounting conventions; Investopedia’s budget variance reference is a good neutral primer if you need to brief a non-finance stakeholder.
The 8 best budget variance analysis templates for 2026
1. Budget Forecasting Dashboard in Excel – best overall
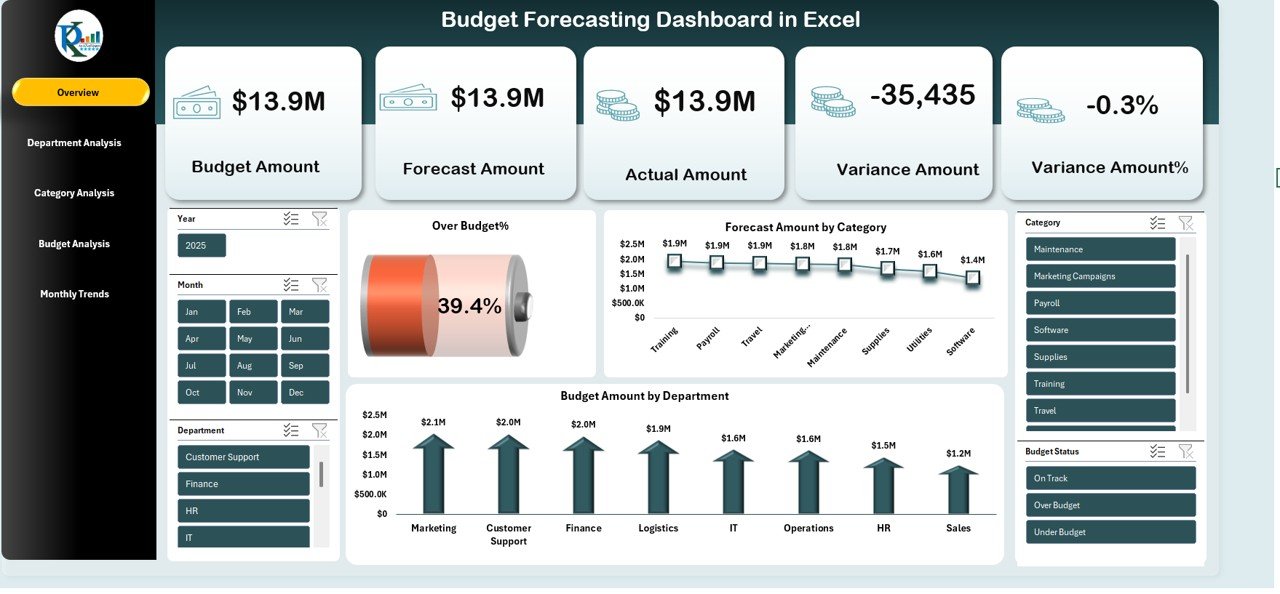
What it is: A complete monthly budget-versus-actual-versus-forecast workbook that computes dollar variance, percent variance, favorable/unfavorable flags and YTD variance out of the box.
Who it is for: FP&A analysts and finance managers who live in Excel and want variance reporting without building formulas from scratch.
What is inside:
- Budget, forecast and actual inputs by category and month
- Automatic dollar and percentage variance with conditional formatting
- Overall accuracy gauge and category variance bar charts
- Slicers for year, month and category
It is the number-one pick because it is the only template here that reports six of the eight metrics on a single screen, so a monthly close review needs one file, not five. A department running a $2M annual budget can flag any line drifting past 5% in seconds, and the YTD roll-up catches the slow, three-month drifts that monthly numbers hide.
Price: $17.99. Get the Budget Forecasting Dashboard in Excel.
Best for: Teams that want the whole of budget variance analysis in one Excel file.
2. Budget Forecasting Dashboard in Power BI
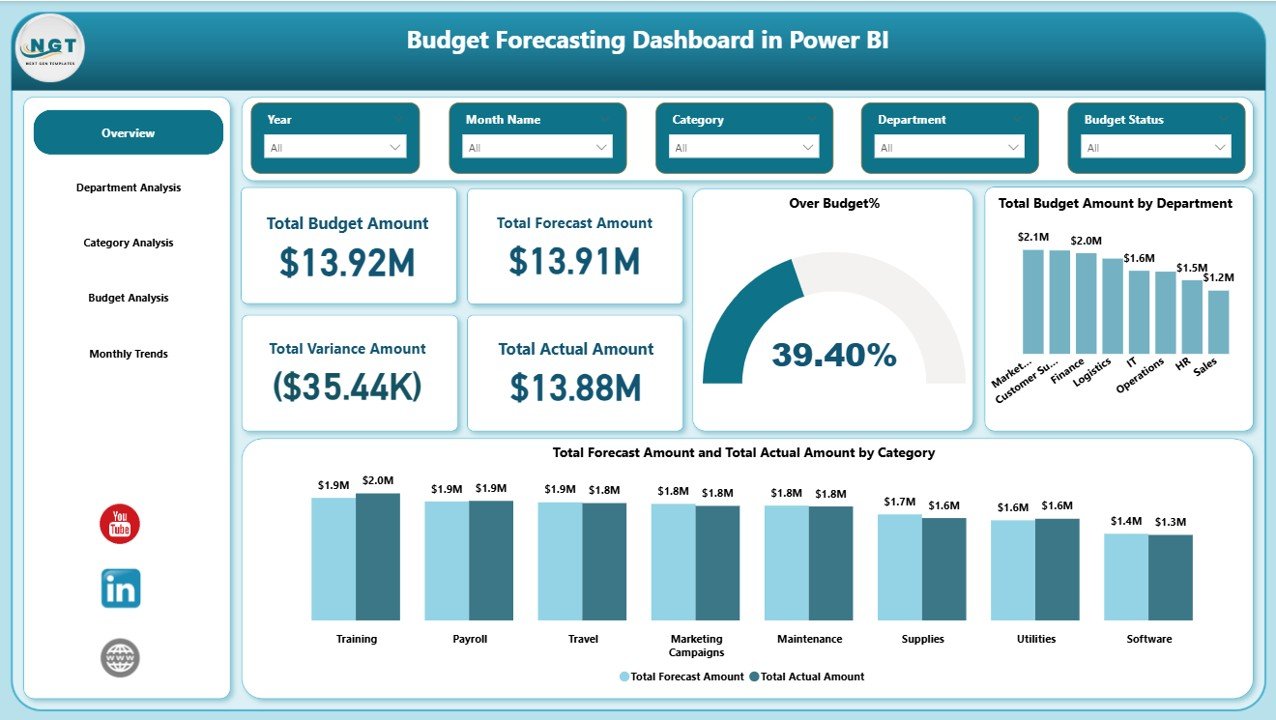
What it is: The refreshable, board-ready version of the flagship dashboard, driven by Power BI’s data model so variance recalculates the moment new actuals land.
Who it is for: Finance teams that report to executives and need a clickable, filterable variance view rather than a static sheet.
What is inside:
- Budget vs forecast vs actual KPI cards
- Total variance amount and overall accuracy gauge
- Category-level forecast-versus-actual bars
- Year, month and category slicers
Price: $17.99. Get the Power BI edition.
Best for: Monthly board packs and refreshable variance reporting.
3. Budget Forecasting Dashboard in Google Sheets – best value
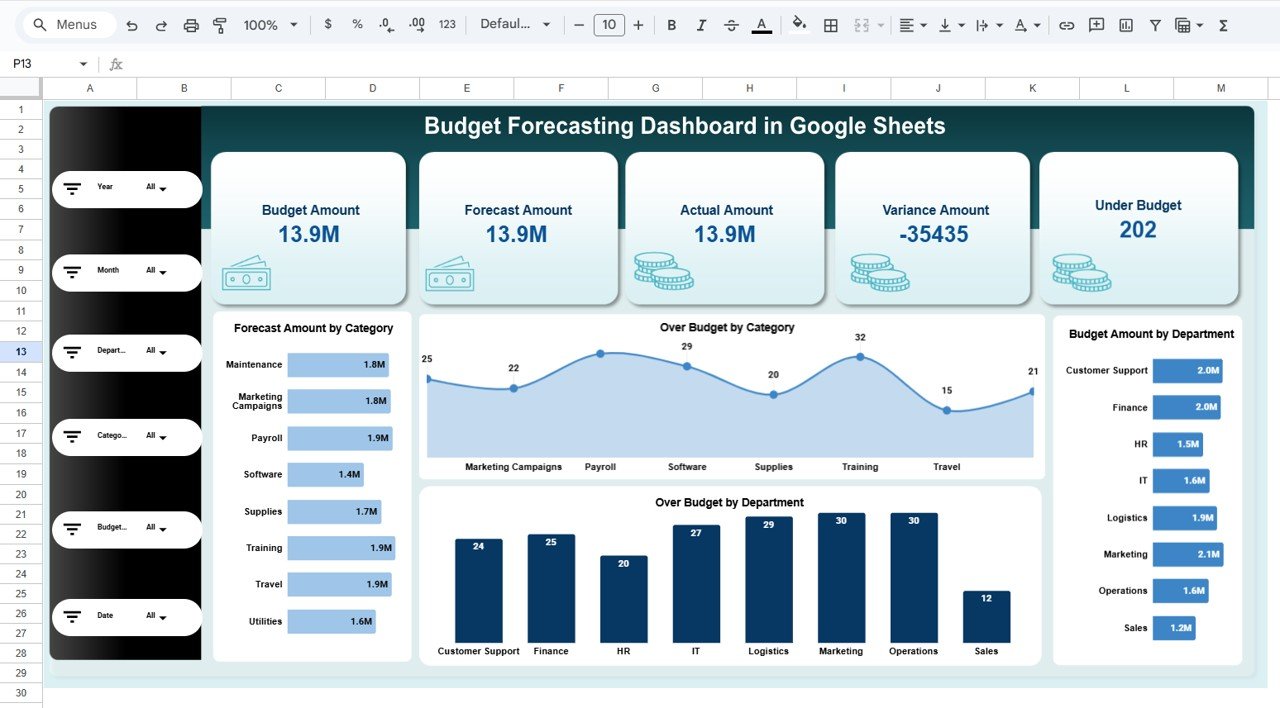
What it is: A cloud-native budget variance dashboard with the same metric set, built for shared editing by a distributed finance team.
Who it is for: Startups and teams that live in Google Workspace and want multiple people updating actuals at once.
What is inside:
- Shared budget vs actual vs forecast inputs
- Live dollar and percent variance
- Category charts and an accuracy summary
- No software install, works in any browser
Price: $9.99 – the cheapest full-featured variance dashboard here. Get the Google Sheets edition.
Best for: Collaborative, cloud-first budget variance analysis on a budget.
4. Manufacturing Production Variance Analysis Dashboard in Excel

What it is: A specialised dashboard for operations that decomposes cost variance into price, quantity and efficiency components across production lines.
Who it is for: Cost accountants and plant controllers who need standard-cost variance, not just P&L variance.
What is inside:
- Material price and usage variance
- Labour rate and efficiency variance
- Volume variance by product
- Actual-versus-standard cost visuals
Price: $17.99. Get the Manufacturing Variance Dashboard.
Best for: Manufacturing and standard-cost cost variance analysis.
5. Financial Planning KPI Dashboard in Power BI
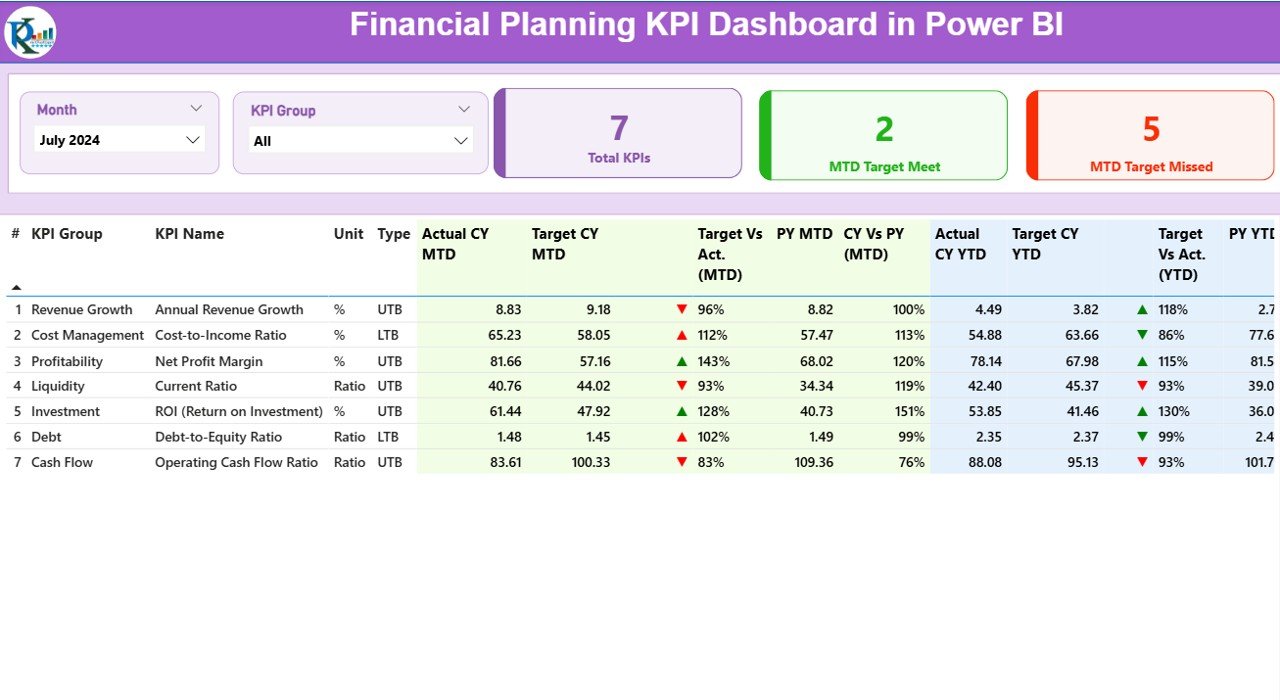
What it is: An executive KPI scorecard where revenue variance, cost variance and run-rate sit alongside the wider financial KPIs leadership cares about.
Who it is for: CFOs and heads of finance who want variance in the context of margin, cash and growth on one page.
What is inside:
- Revenue and cost variance KPI tiles
- Run-rate and trend visuals
- Traffic-light status against targets
- Drill-through to detail
Price: $11.99. Get the Financial Planning KPI Dashboard.
Best for: Executive-level variance in a full KPI context.
6. Forecast Vs Actual Chart with Safe Zone Range in Excel
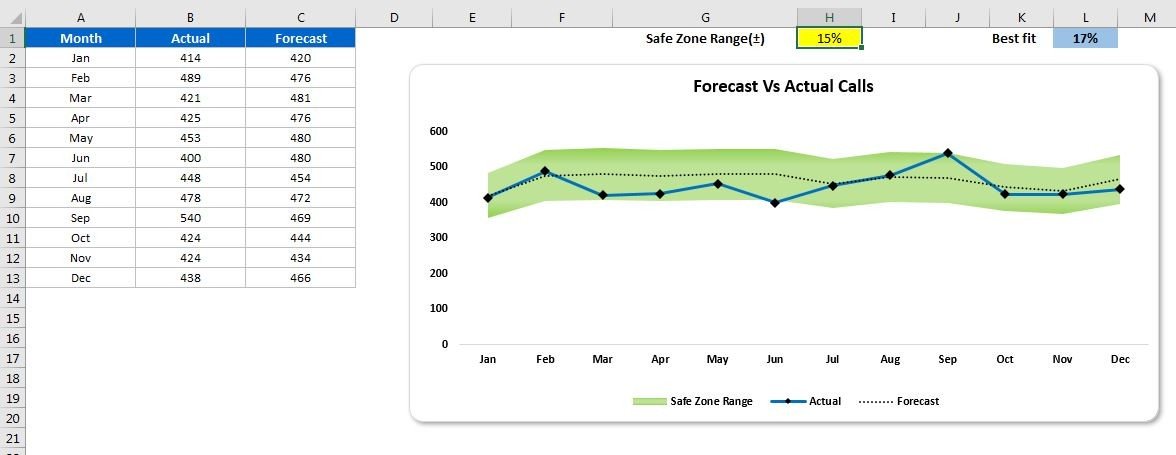
What it is: A focused chart component that plots actuals against forecast with a shaded tolerance band, so any breach of the +/-5% safe zone is visible instantly.
Who it is for: Anyone who wants to drop a professional variance-versus-tolerance visual into an existing report.
What is inside:
- Forecast line with upper/lower safe-zone bands
- Actual series that highlights out-of-band points
- Editable tolerance percentage
Price: $4.99. Get the Forecast Vs Actual Chart.
Best for: Visualising favorable/unfavorable variance against a tolerance band.
7. Budget Planning Calendar in Excel
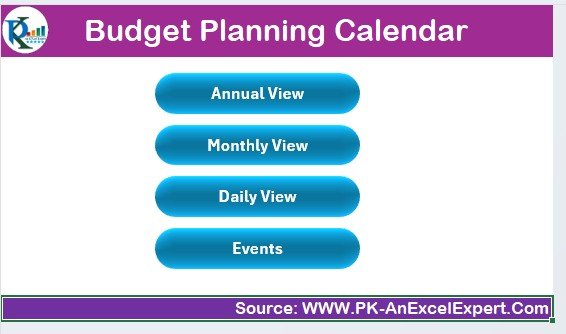
What it is: A calendar that schedules the budget cycle – draft dates, review meetings and the monthly variance close – so the analysis actually happens on time.
Who it is for: Finance leads who need to run a disciplined, repeatable budget and variance-review cadence.
What is inside:
- Annual, monthly and daily budget-cycle views
- Colour-coded review milestones
- Editable event list
Price: $4.99. Get the Budget Planning Calendar in Excel.
Best for: Timing the variance-review cadence.
8. Budget Planning Calendar in Google Sheets
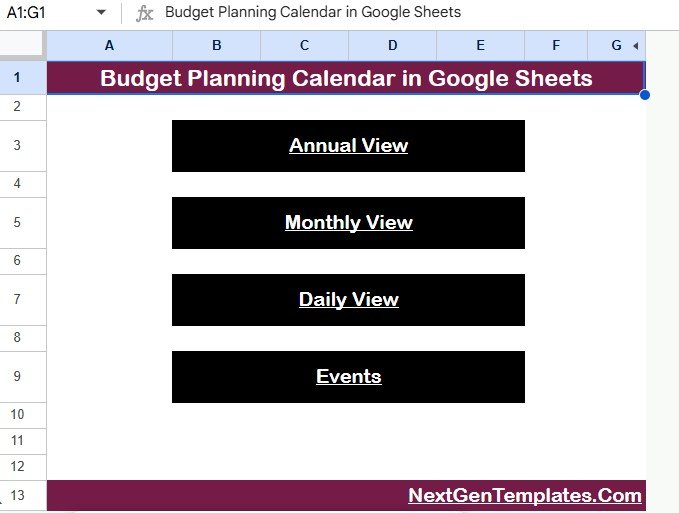
What it is: The shared, cloud version of the planning calendar, so the whole finance team sees the same review dates and deadlines.
Who it is for: Distributed teams coordinating the budget cycle in Google Workspace.
What is inside:
- Shared annual and monthly cycle views
- Milestone colour coding
- Browser-based, no install
Price: $4.99. Get the Google Sheets calendar.
Best for: Shared scheduling of the budget and variance cycle.
Ready to automate your budget variance analysis? The Budget Forecasting Dashboard in Excel computes six of the eight metrics above automatically for $17.99 – or start with the Google Sheets edition at $9.99.
How to choose between them
- You want everything in one file and live in Excel: Budget Forecasting Dashboard in Excel ($17.99).
- You report to a board and need refreshable visuals: Budget Forecasting Dashboard in Power BI ($17.99).
- Your team collaborates in the cloud: Budget Forecasting Dashboard in Google Sheets ($9.99).
- You run a factory and need standard-cost variance: Manufacturing Production Variance Analysis Dashboard ($17.99).
- You just need one variance-versus-tolerance chart: Forecast Vs Actual Chart with Safe Zone Range ($4.99).
For a wider stack that pairs these with reporting and planning files, see our startup reporting stack guide and the training budget dashboards roundup.
When a template is NOT the right answer
A spreadsheet dashboard is the right tool for a single team or company running monthly budget variance analysis. It is the wrong tool in three situations. First, if you have dozens of entities consolidating in multiple currencies with intercompany eliminations, you need a dedicated FP&A or corporate performance management platform, not Excel. Second, if variance data must feed real-time operational decisions across hundreds of cost centres, a data-warehouse-backed BI deployment will scale where a workbook will not. Third, if compliance requires a full audit trail on every number, a controlled financial system beats a shareable sheet. Templates are ideal up to the mid-market; past that, treat them as the prototype you outgrow.
Frequently asked questions
What is budget variance analysis?
Budget variance analysis is the process of comparing budgeted figures to actual results, calculating the difference in dollars and percent, and explaining the cause. It turns a static budget into a management feedback loop that shows whether you are on plan and which lines need attention each period.
What are the main budget variance metrics?
The core metrics are budget variance in dollars, budget variance in percent, favorable versus unfavorable variance, revenue variance, cost variance, forecast accuracy, run-rate variance and year-to-date variance. Together they cover both the size and the direction of every gap between your plan and your actual results.
How do you calculate budget variance percentage?
Budget variance percentage equals (Actual minus Budget) divided by Budget, multiplied by 100. Always divide by the budget, not the actual, because the budget is the fixed baseline you are measuring performance against. A positive result on revenue is favorable; a positive result on cost is unfavorable.
What is a good budget variance percentage?
Most finance teams treat plus or minus 5% as an acceptable tolerance for controllable line items, with anything beyond plus or minus 10% requiring a written explanation. Direct materials and labour in manufacturing are often held tighter, to 2-3%, because they are more directly controllable.
What is the difference between favorable and unfavorable variance?
A favorable variance increases profit – higher-than-budgeted revenue or lower-than-budgeted cost. An unfavorable variance reduces profit – lower revenue or higher cost than planned. The label depends entirely on whether the line is revenue or cost, so the same positive number can be favorable or unfavorable.
How is forecast accuracy measured?
Forecast accuracy is calculated as one minus the absolute difference between actual and forecast divided by actual, expressed as a percentage. The related metric, MAPE, averages that error across periods. Above 90% accuracy (MAPE under 10%) is considered strong for a monthly financial forecast.
Can I do budget variance analysis in Excel or Google Sheets?
Yes. Both handle budget variance analysis well for a single company. A pre-built template like the Budget Forecasting Dashboard ($17.99 in Excel, $9.99 in Google Sheets) saves days of formula work by calculating dollar variance, percent variance, favorable/unfavorable flags and YTD variance automatically.
How often should you run budget variance analysis?
Monthly is the standard cadence, aligned to your financial close, with a formal review of any line breaching tolerance. Fast-moving or cash-tight businesses add a lighter weekly run-rate check. A budget planning calendar helps enforce the cadence so the analysis actually happens on schedule.
Why is a large favorable variance sometimes a problem?
A big favorable cost variance usually means planned work did not happen – a delayed hire, a slipped project, or spend deferred to a later month – rather than genuine efficiency. It can also reveal a budget set too loosely. Investigate large favorable variances as carefully as unfavorable ones.
What is run-rate variance?
Run-rate variance compares your annualised current spending pace to the annual budget. You take actual spend to date, divide by months elapsed, multiply by twelve, and subtract the annual budget. It is a forward-looking early warning that you will overshoot, useful well before year-end.
Get more budget variance analysis templates
Track all eight metrics without building a single formula. The Budget Forecasting Dashboard in Excel ($17.99) and its Google Sheets edition ($9.99) give you dollar variance, percent variance, favorable/unfavorable flags, forecast accuracy and YTD variance on one screen. For operations, add the Manufacturing Production Variance Analysis Dashboard ($17.99).
Browse more finance dashboards and see them in action on the NextGenTemplates YouTube channel.