

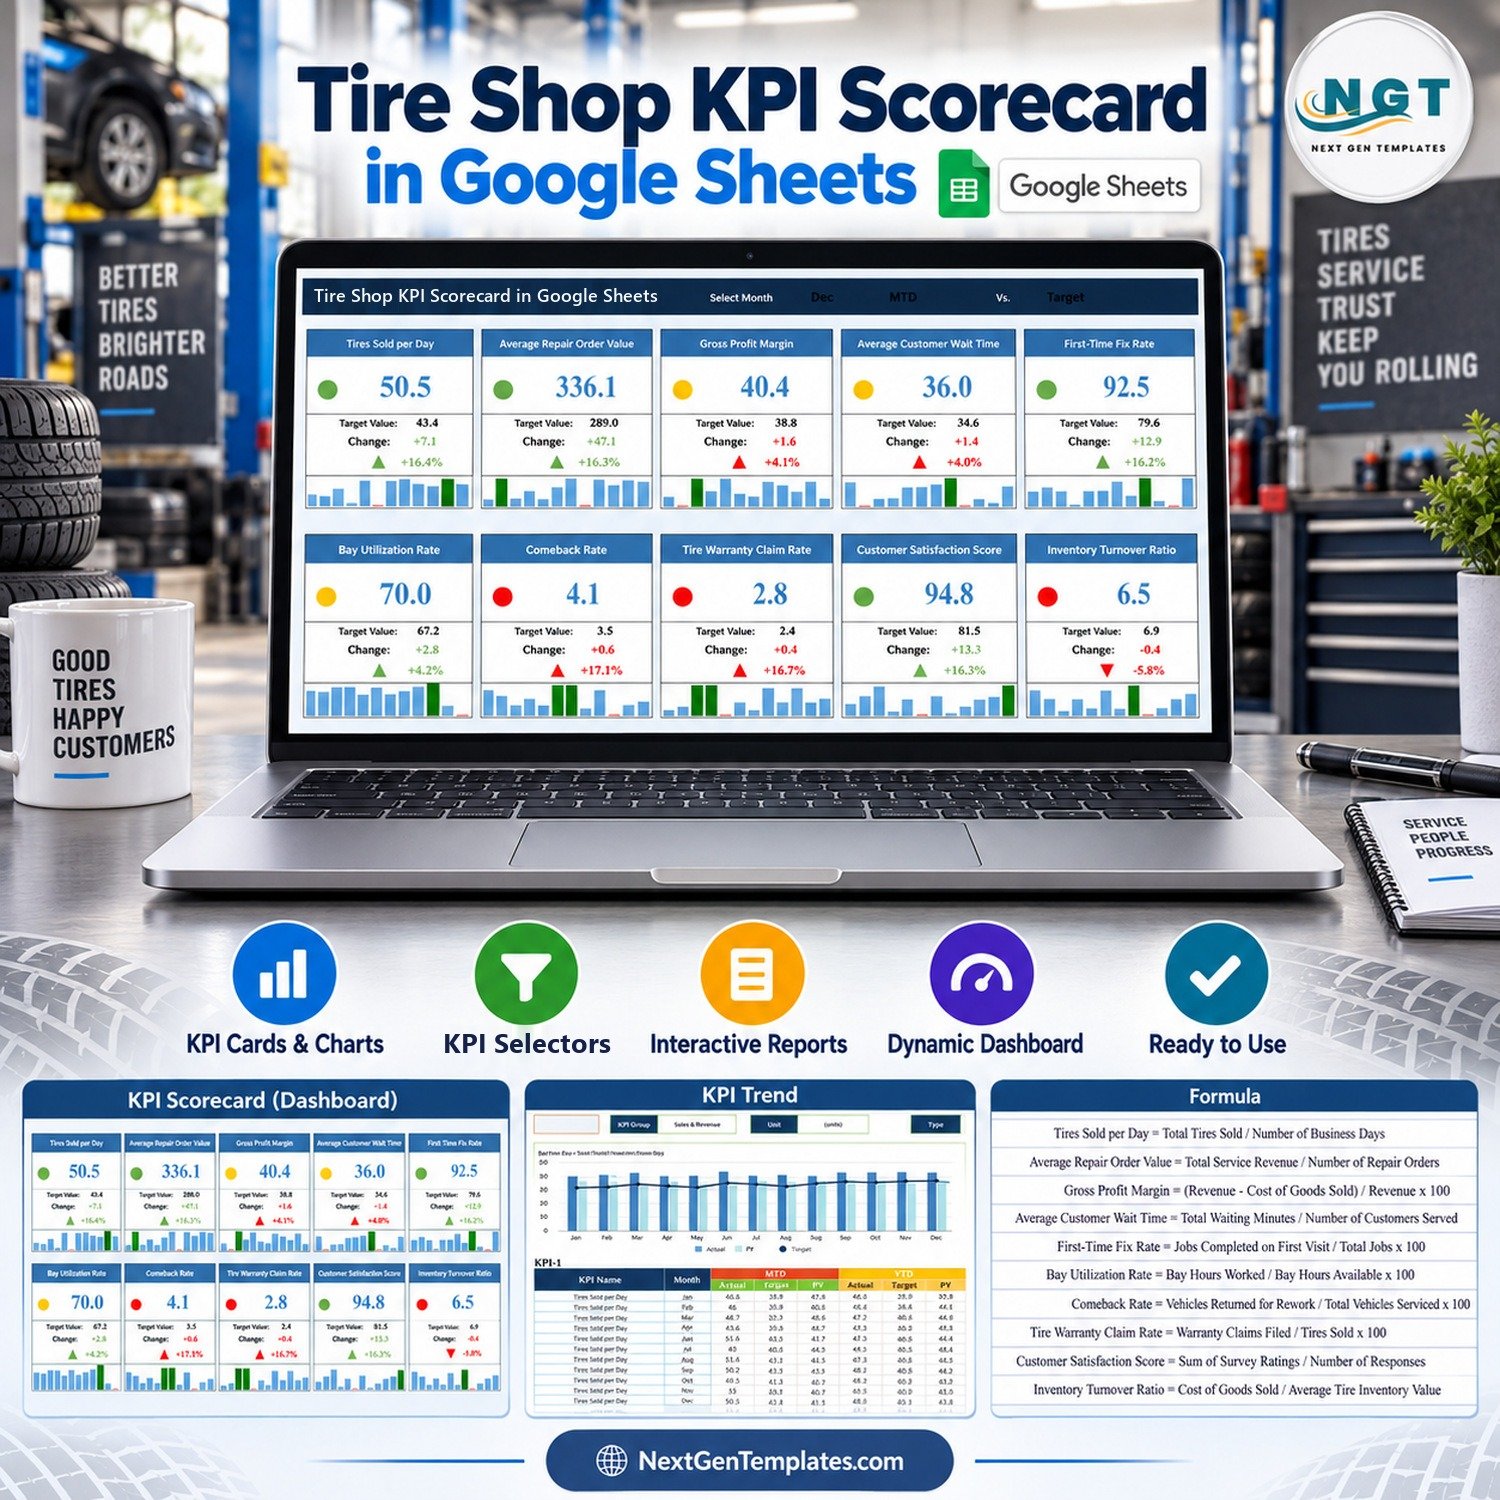
10 tire shop KPIs, 5 KPI groups, 12 months of sample data and MTD plus YTD comparisons sit inside the Tire Shop KPI Scorecard in Google Sheets. It turns the monthly Actual, Target and prior-year (PY) figures you already collect into ten KPI cards with traffic lights, change arrows and twelve-month mini charts, plus a KPI Trend page for one metric at a time. You make your own editable copy in Google Drive from the PDF link, and it needs no add-on, macro or subscription.
Which product this is. This is a KPI scorecard: a one-page monthly review fed by aggregate numbers you type. It is not a transaction-level analytical dashboard and it is not a point-of-sale, booking or inventory system.
✅ Instant download – One-time payment – No subscription – Works in any browser
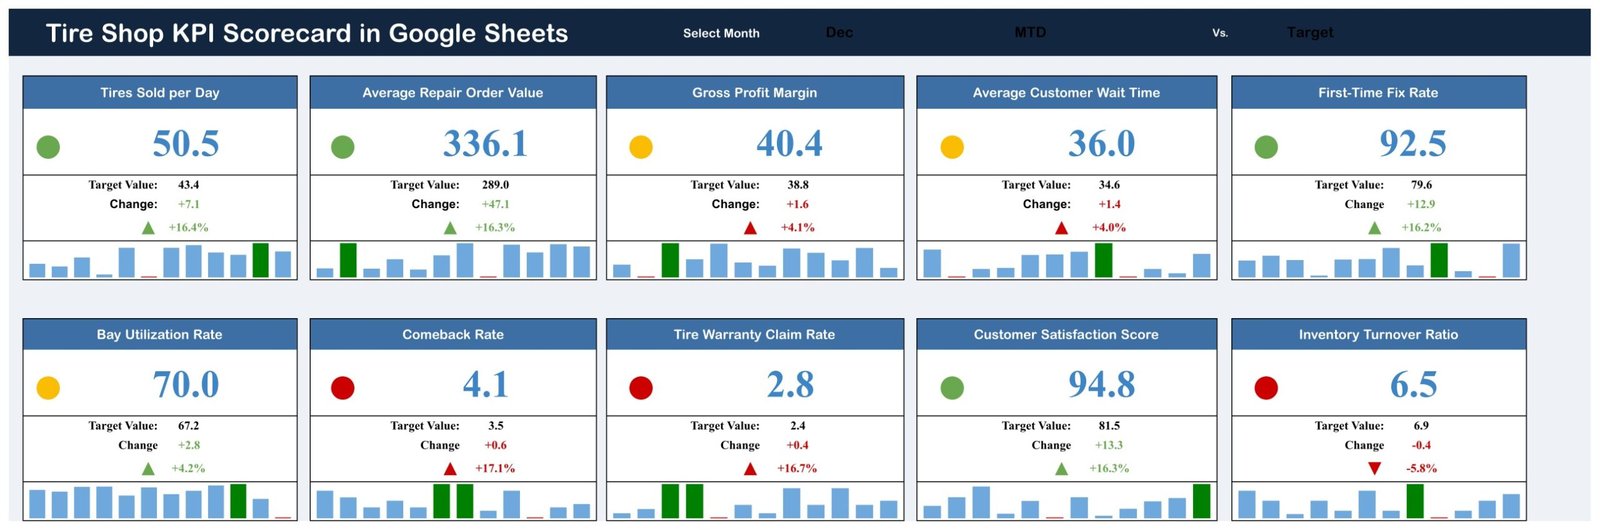
🔑 Key Features of the Tire Shop KPI Scorecard in Google Sheets
- 🚙 10 KPI cards on one page: Tires Sold per Day, Average Repair Order Value, Gross Profit Margin, Average Customer Wait Time, First-Time Fix Rate, Bay Utilization Rate, Comeback Rate, Tire Warranty Claim Rate, Customer Satisfaction Score and Inventory Turnover Ratio.
- 📅 Select Month dropdown: review any month from January to December on the same page.
- 🔄 MTD or YTD switch: flip every card between month-to-date and year-to-date figures.
- ⚖️ Vs. Target or Vs. PY: choose whether each card compares the actual value with the target or with the same period last year.
- 🚦 Direction-aware traffic lights: 7 upper-the-better (UTB) and 3 lower-the-better (LTB) KPIs, so a falling Comeback Rate counts as good news, not bad.
- 📊 Twelve-month mini chart on every card: the selected month is highlighted so a single weak month stands out.
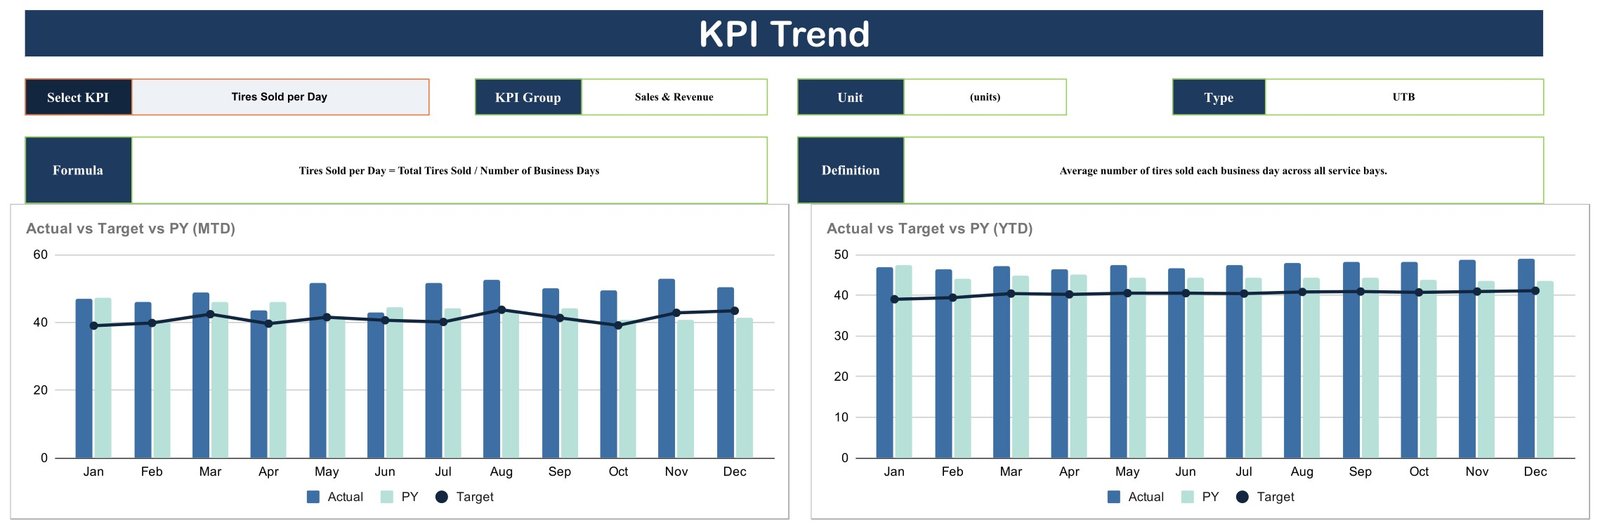
- 📈 KPI Trend page: pick one KPI from a dropdown and see its group, unit, type, formula and definition beside MTD and YTD charts of Actual vs Target vs PY.
- 📝 Editable KPI Definition table: group, name, unit, written formula, plain-language definition and UTB/LTB type for all ten KPIs.
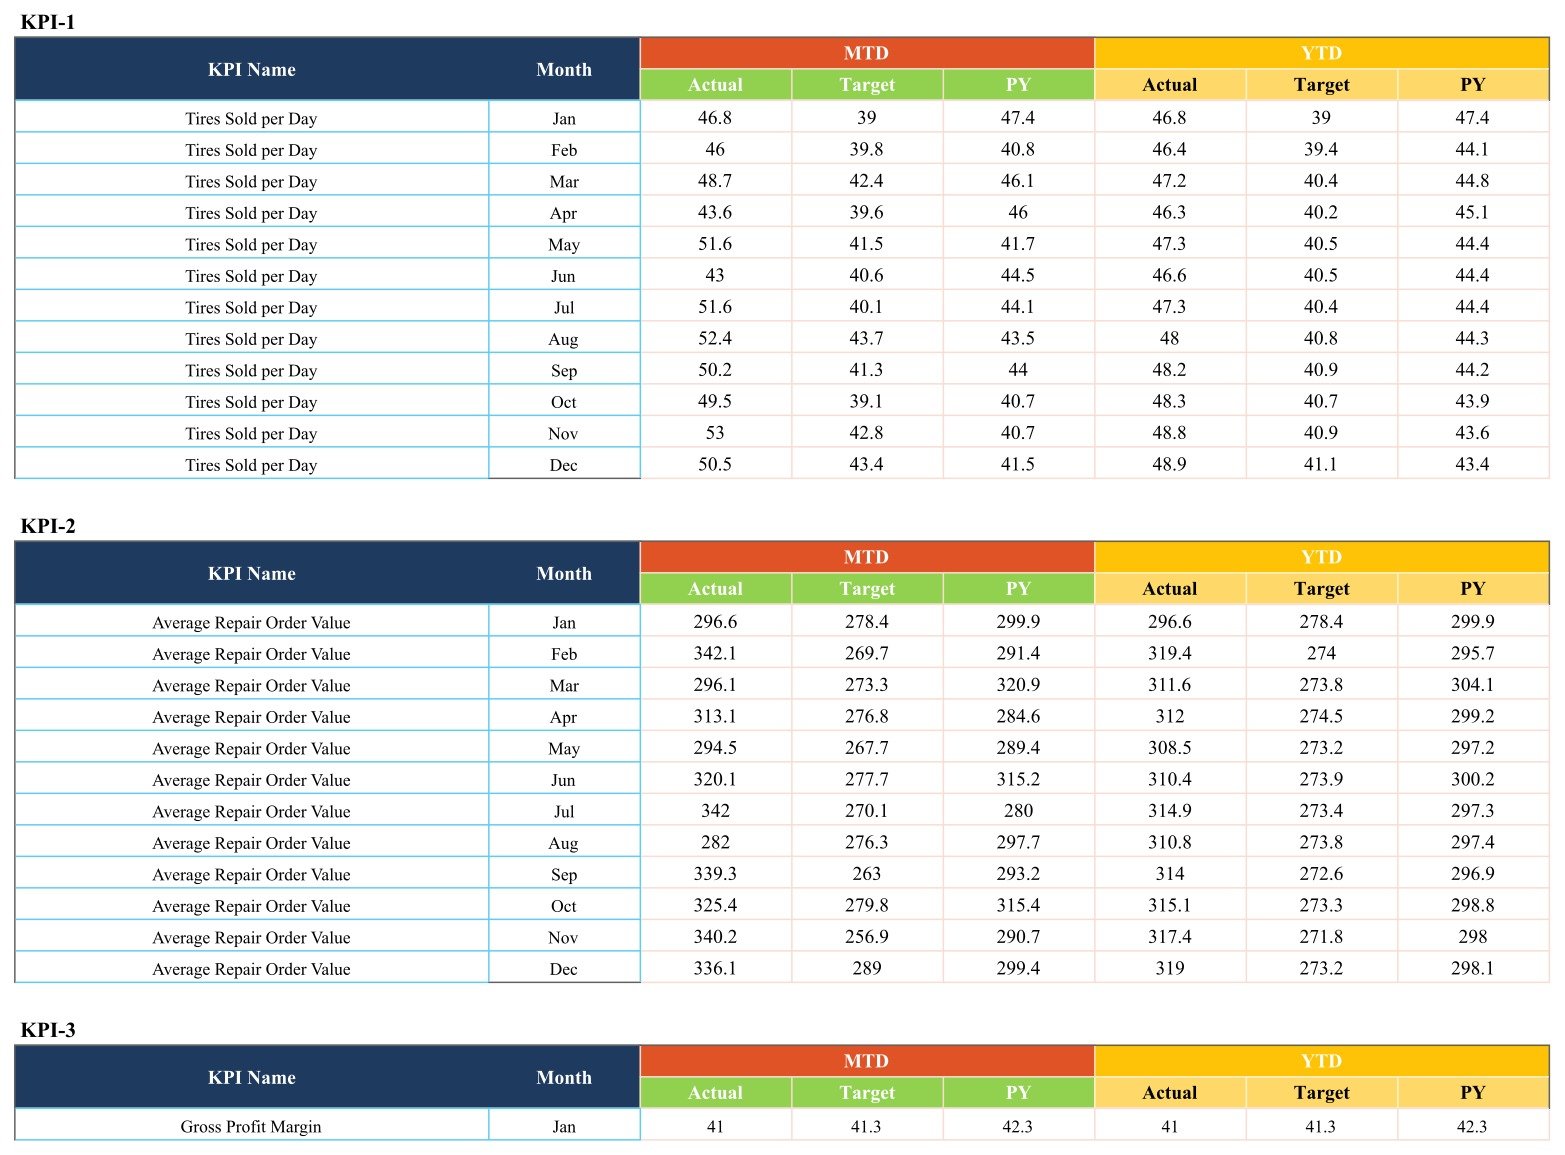
- ✎️ Structured Input Data tab: one block per KPI with 12 monthly rows of MTD and YTD Actual, Target and PY.
- 👥 Google Drive sharing: give the owner, service manager and bookkeeper the same live copy with normal Drive permissions.
📦 What’s Inside the Scorecard Template
Scorecard
Ten cards show the selected value, the target (or PY) value, the absolute change, the percentage change, an arrow, a status light and a twelve-month mini chart. The header holds the Select Month, MTD/YTD and Vs. controls. In the supplied December MTD vs Target example, 4 KPIs are green, 3 amber and 3 red: Tires Sold per Day reads 50.5 against a 43.4 target, while Tire Warranty Claim Rate reads 2.8 against 2.4 and shows red because lower is better. These are fictional demonstration figures, not industry benchmarks.
KPI Trend
Choose a KPI and inspect it across the year: KPI group, unit, type, formula and definition at the top, then two charts – Actual vs Target vs PY for MTD and for YTD.
KPI Definition
The master list of all ten KPIs with group, unit, formula, definition and direction. Review it first and adjust wording to match how your shop measures each figure.

Input Data
Each KPI has its own numbered block with twelve monthly rows and separate MTD and YTD columns for Actual, Target and PY. You type the finished YTD figure yourself, because the correct roll-up differs by KPI – an average for a rate, a running figure for a volume.
Color Settings and helper tabs
Color Settings documents the red / amber / green bands. By default an upper-the-better KPI shows green only when it beats its comparison by more than 10%, amber when it is up to 10% better, and red when it is level or worse; lower-the-better KPIs mirror this. The calculation itself reads its band table on the Support tab, so if you change a band, change it in both places. Support and Trend_Support are helper tabs that feed the cards and charts.
🚗 The 10 Tire Shop KPIs
| KPI group | KPIs | Direction |
|---|---|---|
| Sales & Revenue | Tires Sold per Day (units); Average Repair Order Value ($); Gross Profit Margin (%) | All UTB |
| Service Operations | Average Customer Wait Time (min); First-Time Fix Rate (%); Bay Utilization Rate (%) | Wait Time is LTB; the other two are UTB |
| Quality | Comeback Rate (%); Tire Warranty Claim Rate (%) | Both LTB |
| Customer | Customer Satisfaction Score (score out of 100) | UTB |
| Inventory | Inventory Turnover Ratio (turns) | UTB |
📊 Tire Shop KPI Scorecard in Google Sheets vs. Excel vs. Shop Management Software
| Area | This Google Sheets KPI scorecard | Excel edition | Tire / auto shop software |
|---|---|---|---|
| Price model | ✅ One-time purchase | One-time purchase | Monthly subscription |
| Where it runs | ✅ Any browser, Google account | Desktop Excel | Vendor app |
| Real-time collaboration | ✅ Built in through Drive sharing | Through OneDrive / SharePoint | Seat-based |
| KPI list | 10 KPIs incl. First-Time Fix Rate and Tire Warranty Claim Rate | A different 10-KPI list | Vendor reports |
| Automatic data capture | No – you type monthly totals | No | ✅ Yes |
| Invoicing, booking or stock control | No | No | ✅ Usually |
For tire shop owners who want one monthly performance review without another subscription, this tire shop KPI template sits beside the shop system rather than replacing it.
👥 Who This Template Is For – and Who It’s Not For
✅ Built for:
- Independent tire and wheel shop owners who review tire shop performance metrics once a month
- Service managers who report bay, wait-time and comeback results to an owner
- Bookkeepers and consultants preparing a monthly KPI pack for tire dealers
❌ Not for:
- Shops that want figures pulled automatically from a POS – this scorecard is fed by typed monthly totals
- Invoicing, appointment booking, tire storage or stock control – it reports on those areas, it does not run them
- Multi-site chains wanting store-by-store drill-down inside one file
⚙️ How to Use the Tire Shop KPI Scorecard in Google Sheets
- Open the downloaded PDF, click the Google Sheets link and choose File > Make a copy.
- Review the ten KPIs, formulas and UTB/LTB types on KPI Definition.
- Replace the fictional values on Input Data with your monthly MTD and YTD Actual, Target and PY figures.
- On Scorecard, choose a month, MTD or YTD, and Target or PY.
- Open KPI Trend for any red or amber KPI to see how it moved across the year.
⚠️ Known Issues in the Current Copy – and the Fixes
- June and July in the month dropdown: the Select Month list spells these months “June” and “July”, while the data rows use “Jun” and “Jul”, so choosing either month blanks the cards. In your copy, select the month cell, open Data > Data validation and change the two entries to Jun and Jul. It takes about a minute.
- Read Me tab: the Read Me tab is currently empty. The setup steps are in the PDF and on this page.
- Gross Profit Margin change colour: on that one card the change figure displays in red even when the margin beats its comparison. The status light and arrow are correct; only the text colour is affected, and you can fix it under Format > Conditional formatting.
💼 Real-World Use Cases
A two-bay tire and alignment shop owner types last month’s totals on the first Monday of the month and sees Tire Warranty Claim Rate in red, then checks KPI Trend to see whether it is one bad month or a rising pattern.
A service manager reads Average Customer Wait Time, Bay Utilization Rate and First-Time Fix Rate together to tell a staffing problem from a workflow problem.
A bookkeeper for several tire dealers keeps one copy of the scorecard per client and shares it with each owner through Google Drive.
❓ Frequently Asked Questions
What KPIs does the Tire Shop KPI Scorecard in Google Sheets track?
Ten: Tires Sold per Day, Average Repair Order Value, Gross Profit Margin, Average Customer Wait Time, First-Time Fix Rate, Bay Utilization Rate, Comeback Rate, Tire Warranty Claim Rate, Customer Satisfaction Score and Inventory Turnover Ratio.
Which KPIs are lower-the-better?
Average Customer Wait Time, Comeback Rate and Tire Warranty Claim Rate. The other seven are upper-the-better.
Does it connect to my POS or shop software?
No. You type or paste monthly totals on Input Data. There is no live connection to any other system.
Is it the same as the Excel edition?
No. The Tire Shop KPI Scorecard in Excel is a separate product with its own KPI list and layout – it tracks Alignment Attach Rate, Tire Install Time and Appointment No-Show, which this edition does not, while this edition tracks First-Time Fix Rate, Average Customer Wait Time and Tire Warranty Claim Rate.
Do I need an add-on or macros?
No. The scorecard is formula-driven and runs in Google Sheets in any browser.
Are the sample figures benchmarks?
No. They are fictional values that show the cards, lights and charts working before you enter your own numbers.
What is in the download?
A two-page PDF with the link to the scorecard and step-by-step instructions for making your own editable copy in Google Drive.
👤 About the Author
Built by PK – Microsoft Certified Professional with 15+ years of Excel, Google Sheets and Power BI experience. Founder of NextGenTemplates, reaching 300K+ subscribers across YouTube channels. Every template is hand-built and tested before release.
🔗 Explore Related Templates
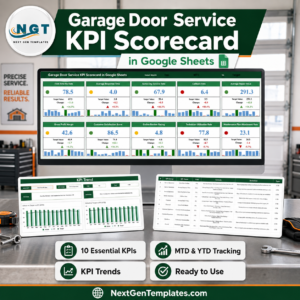
- Garage Door Service KPI Scorecard in Google Sheets – the same scorecard format for garage door service businesses.
- Appliance Repair Business KPI Scorecard in Google Sheets – service-trade KPIs in a monthly scorecard.
- Handyman Services KPI Scorecard in Google Sheets – another Google Sheets KPI scorecard for service businesses.
- Tyre Shop Stock Data Entry System in Excel – record tyre stock movements with an entry form.
- Fleet Maintenance Calendar in Google Sheets – plan vehicle service dates across the year.
Also available as: Tire Shop KPI Scorecard in Excel (different KPI list).
📖 Click here to read the Detailed Blog Post
🎥 Visit our YouTube channel for step-by-step video tutorials
👉 YouTube.com/@NextGenTemplates
Watch the step-by-step video Demo:
📅 Last updated: September 2026



















Reviews
There are no reviews yet.