

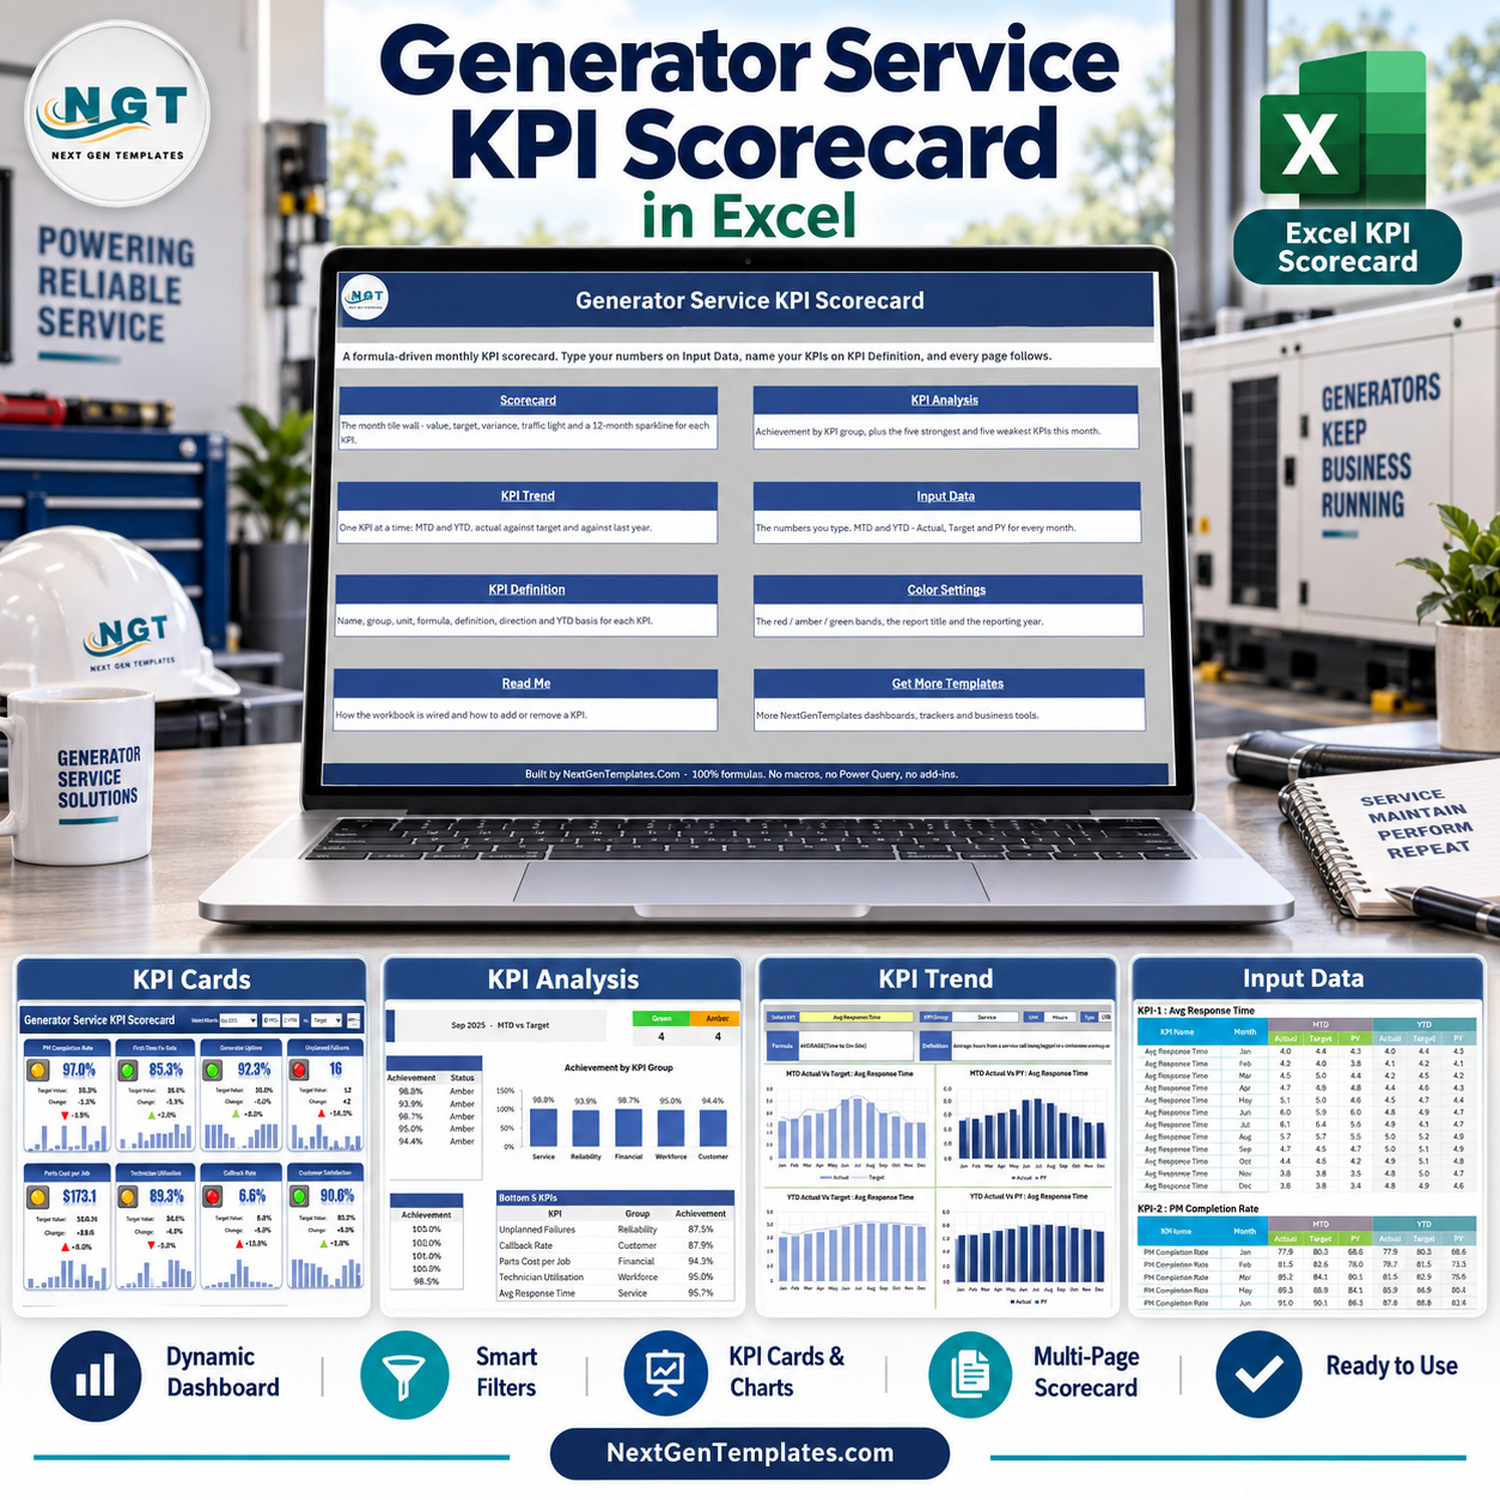

Generator Service KPI Scorecard in Excel gives generator service managers a focused monthly scorecard for 10 supplied KPIs, with room to expand to 20. It separates definitions, typed figures, analysis, and visual outputs so teams can review performance without macros, Power Query, add-ins, or an internet connection. Use the included sample data to understand the flow, then replace it with your own MTD and YTD actual, target, and prior-year figures. The workbook displays traffic lights, change indicators, 12-month sparklines, group achievement, and top/bottom performers. Download once, keep a clean master copy, and use it in Excel 2016 or later.
This is an Excel KPI Scorecard, not an Excel KPI Dashboard. It is designed for concise monthly performance review rather than transaction-level analysis. Teams searching for an Excel generator service scorecard, a generator maintenance KPI template, a service operations KPI scorecard, or a monthly KPI scorecard in Excel can adapt the supplied KPI names, definitions, targets, and thresholds to their own operation.
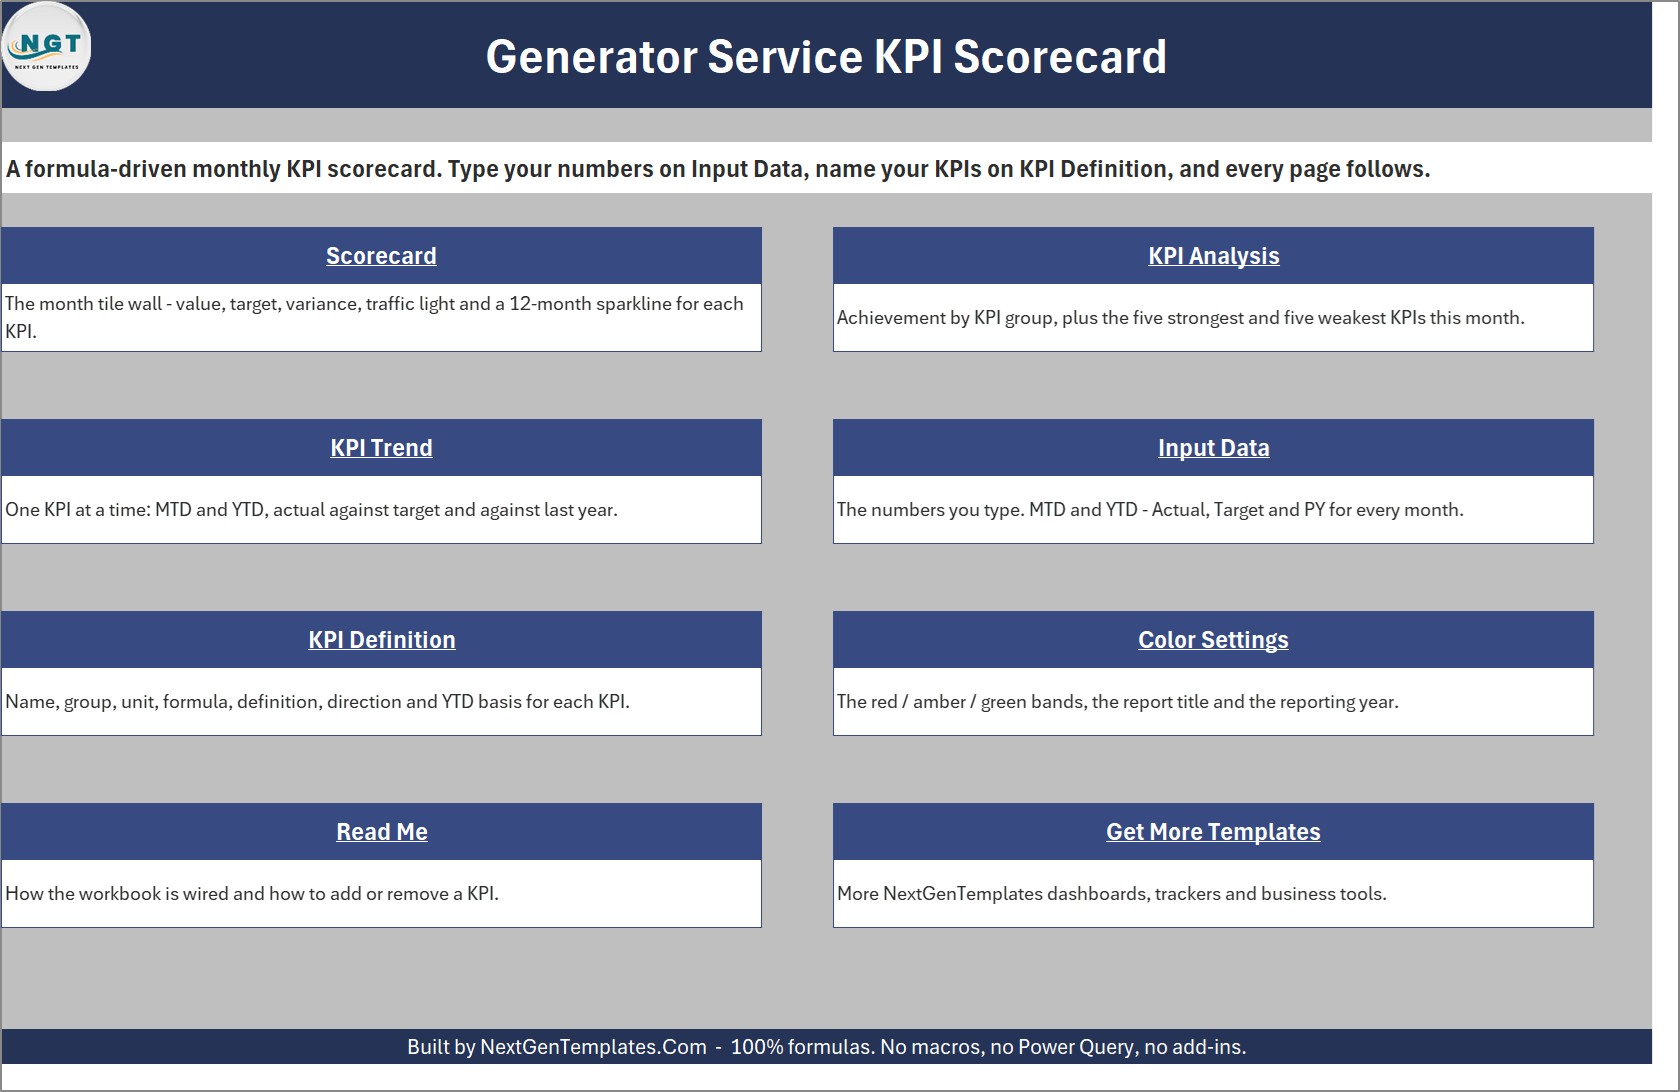
Home sheet with links to the scorecard, analysis, trend, input, definition, settings, and reference pages.
Key Features of Generator Service KPI Scorecard in Excel
- 10 ready-to-review generator service KPIs: average response time, preventive maintenance completion rate, first-time fix rate, generator uptime, unplanned failures, service revenue, parts cost per job, technician utilisation, callback rate, and customer satisfaction.
- Capacity for 20 KPIs: the scorecard shows KPI 1-10 or KPI 11-20 from a header selector.
- MTD and YTD views: switch the complete scorecard between month-to-date and year-to-date figures.
- Flexible comparisons: compare actual results with target, prior year, or prior month.
- Direction-aware traffic lights: UTB and LTB settings ensure higher-is-better and lower-is-better metrics are evaluated correctly.
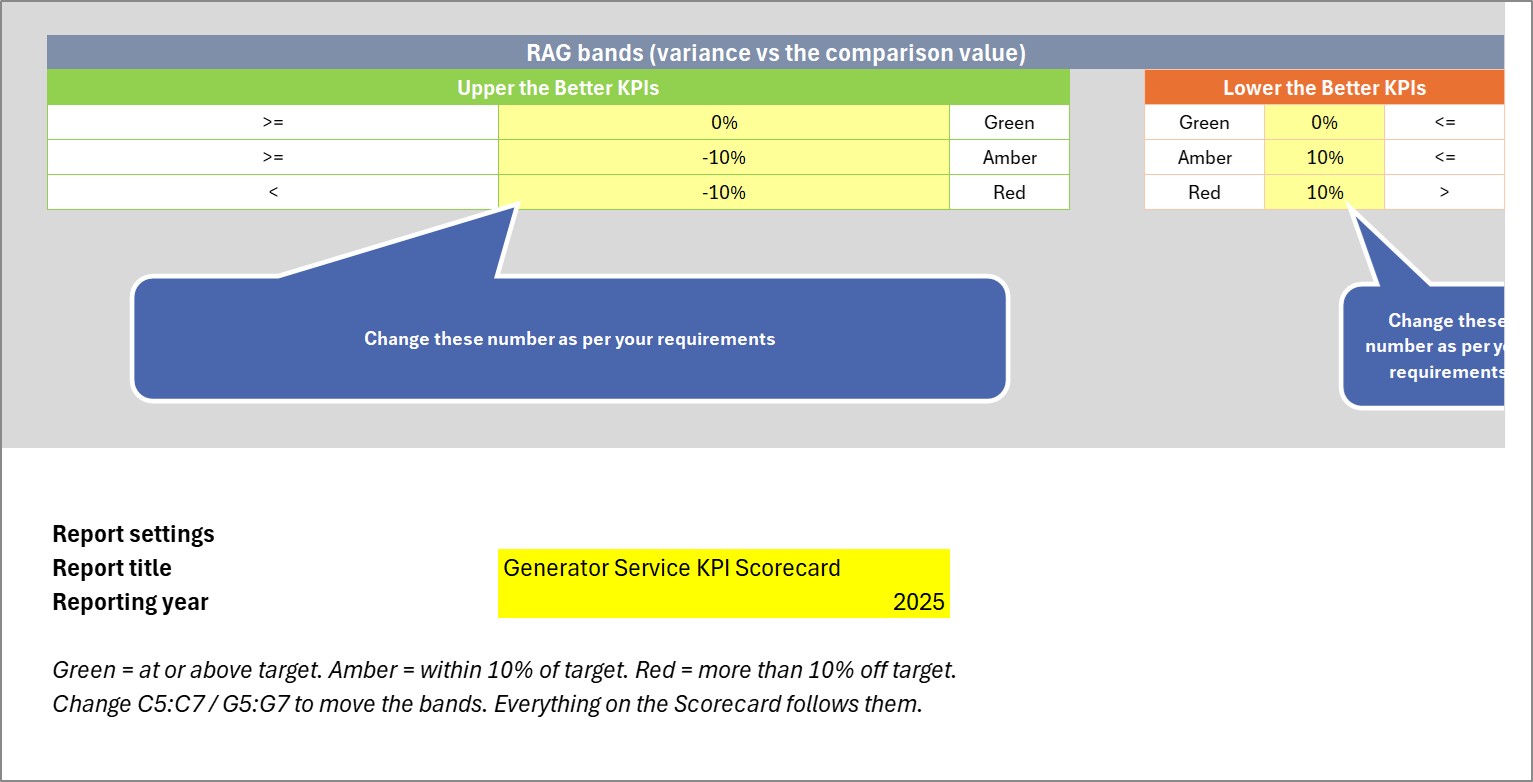
- Editable RAG bands: change green, amber, and red thresholds from the Color Settings sheet.
- Formula-driven workbook: no macros, Power Query, add-ins, or online connection required.
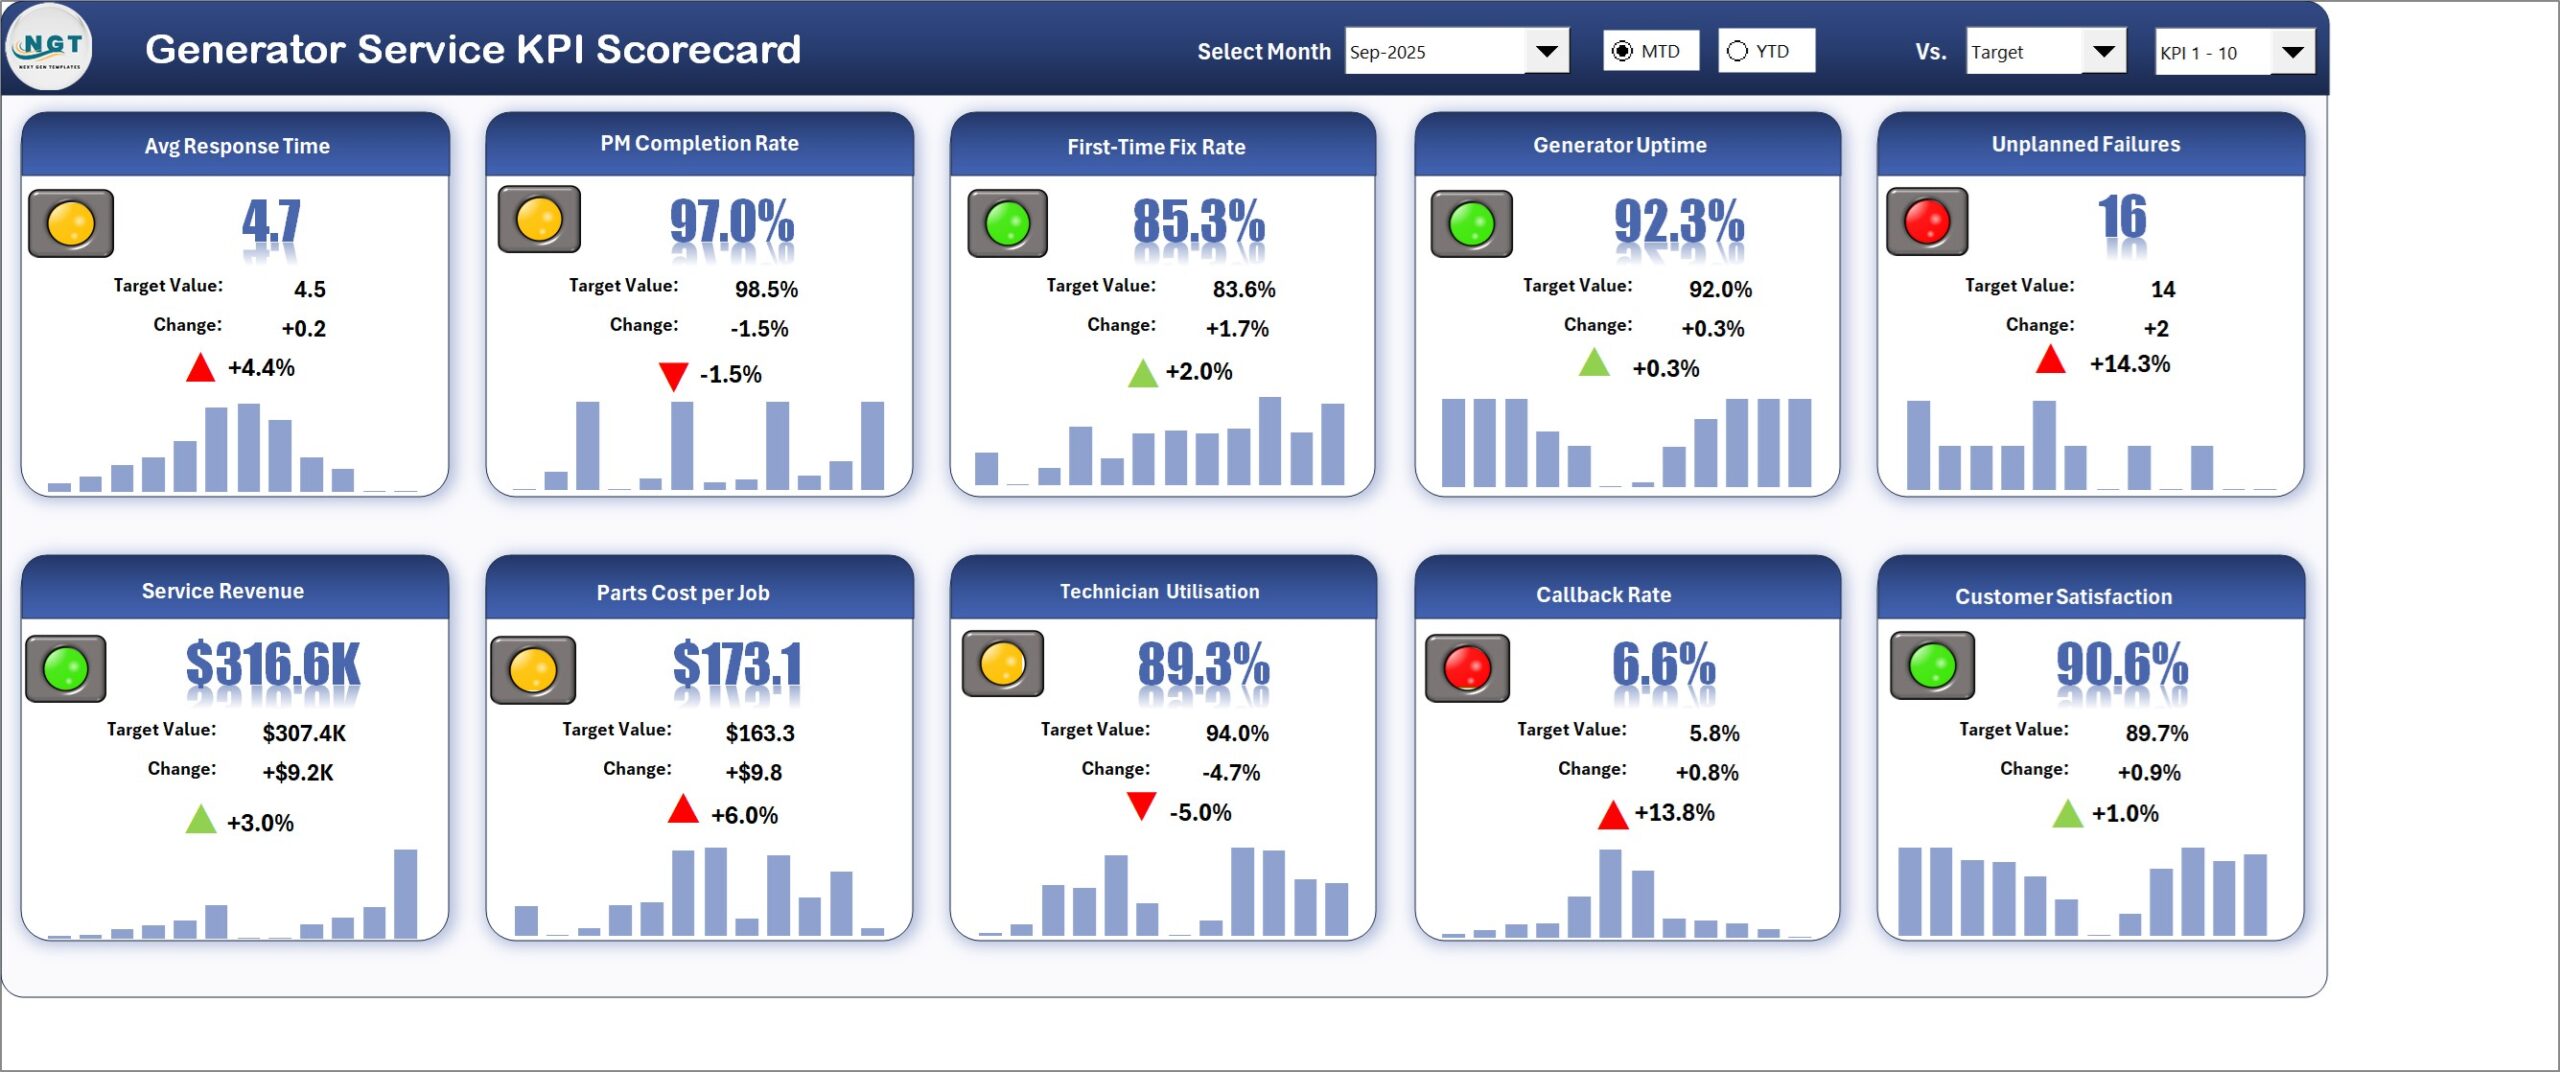
The Scorecard page displays ten KPI cards with values, comparisons, traffic lights, arrows, and 12-month sparklines.
What’s Inside the Generator Service KPI Scorecard in Excel
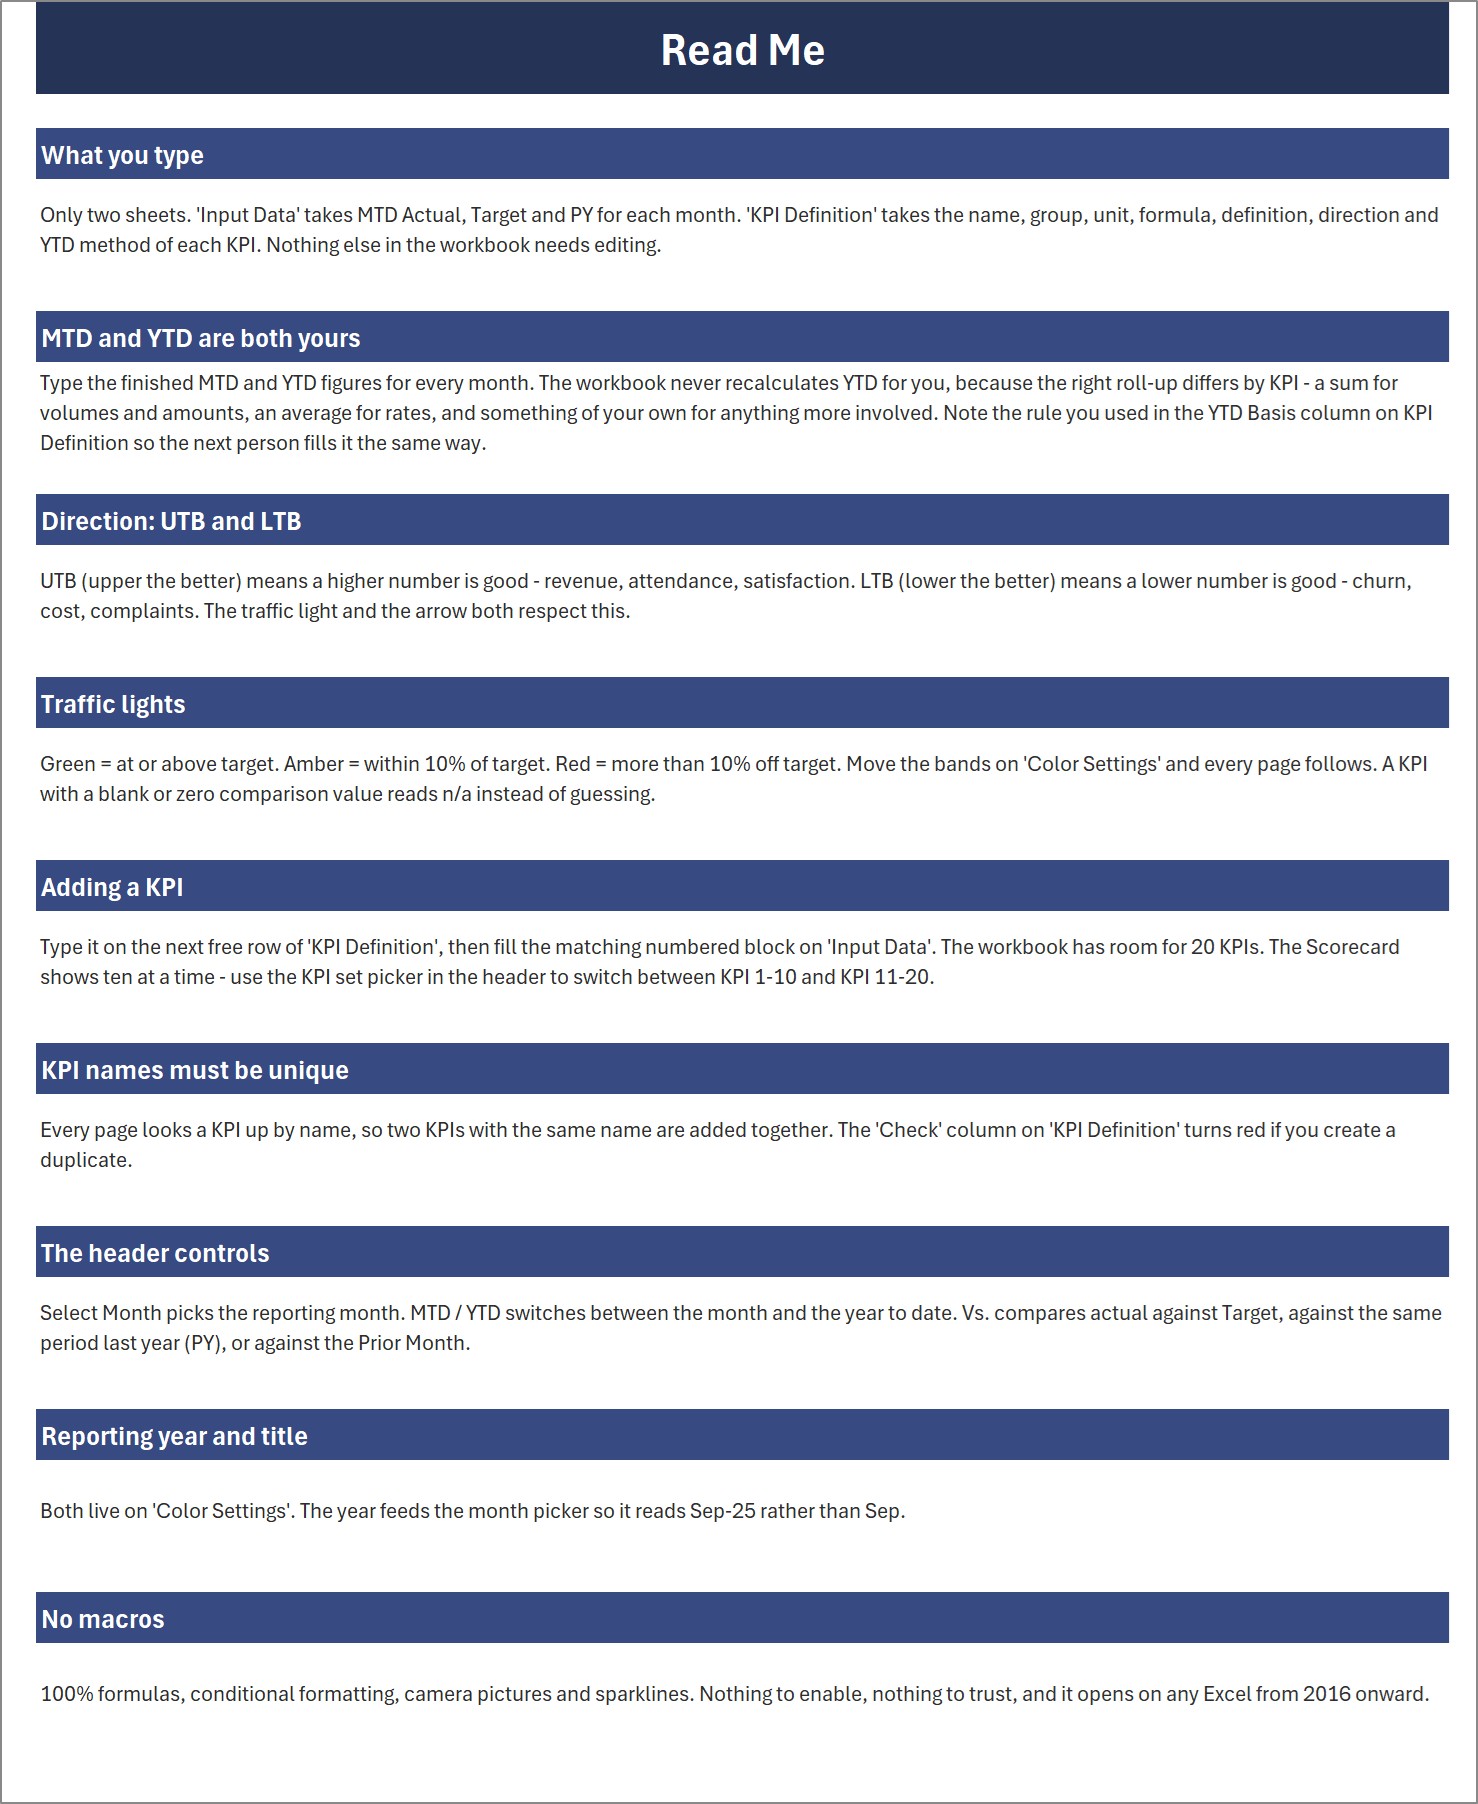
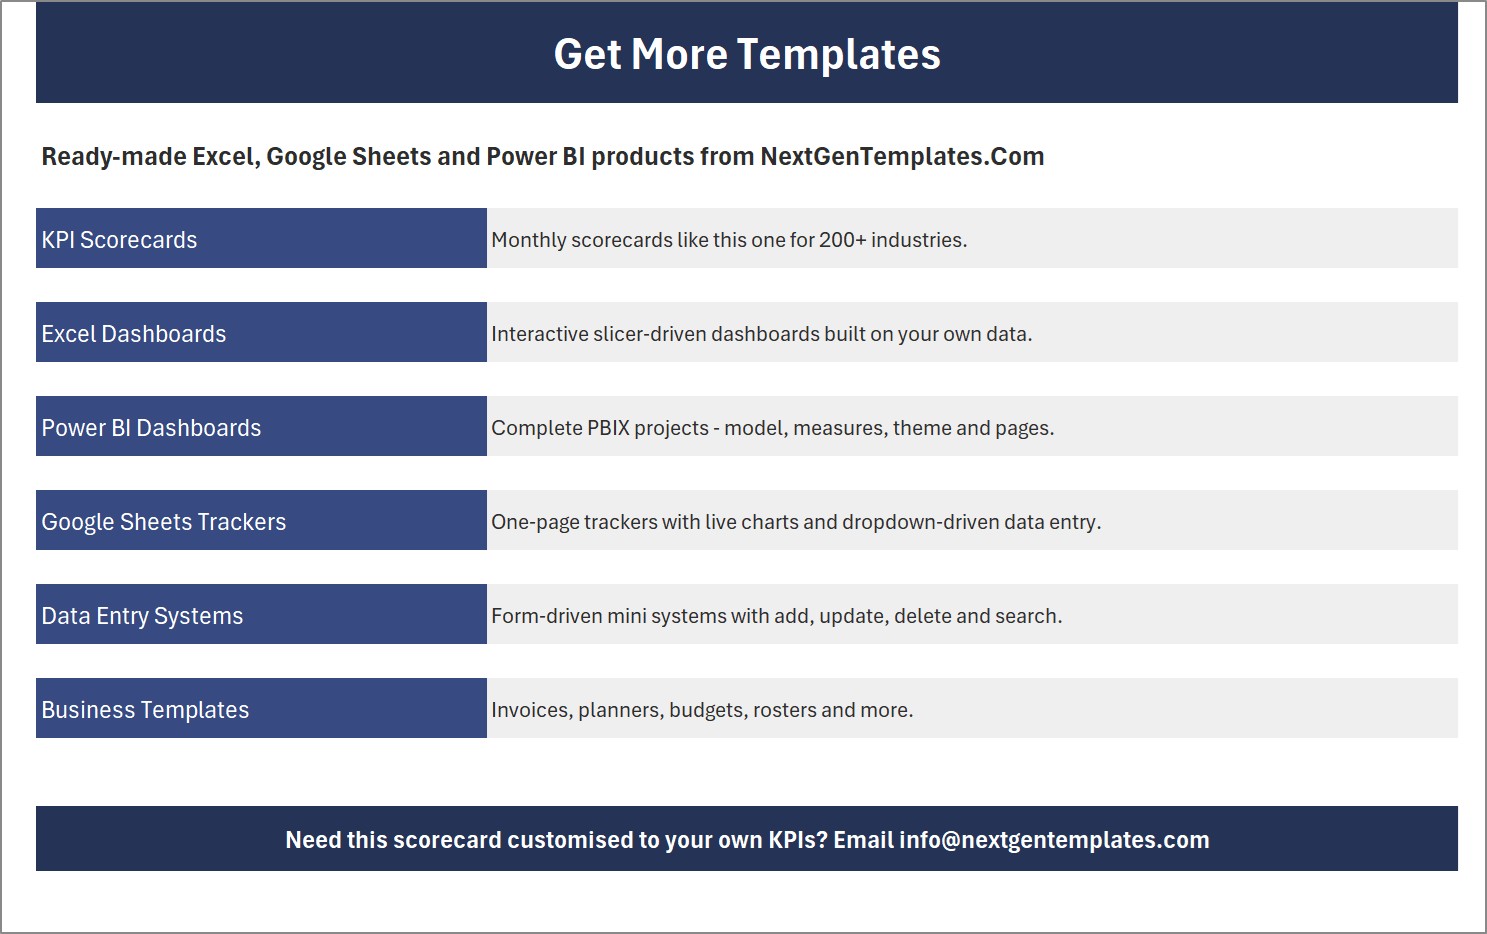
The customer ZIP contains the Excel workbook and a six-page PDF user manual. The workbook has nine visible pages plus two hidden support sheets. Home provides navigation. Scorecard is the monthly tile wall. KPI Analysis rolls performance up by group and shows green/amber/red counts plus the five strongest and weakest KPIs. KPI Trend shows four charts for a selected KPI. Input Data holds six typed values per month: MTD Actual, Target, and PY plus YTD Actual, Target, and PY. KPI Definition stores each KPI’s group, name, unit, formula description, definition, direction, and YTD basis. Color Settings controls the report title, year, and RAG bands. Read Me and Get More Templates provide guidance.
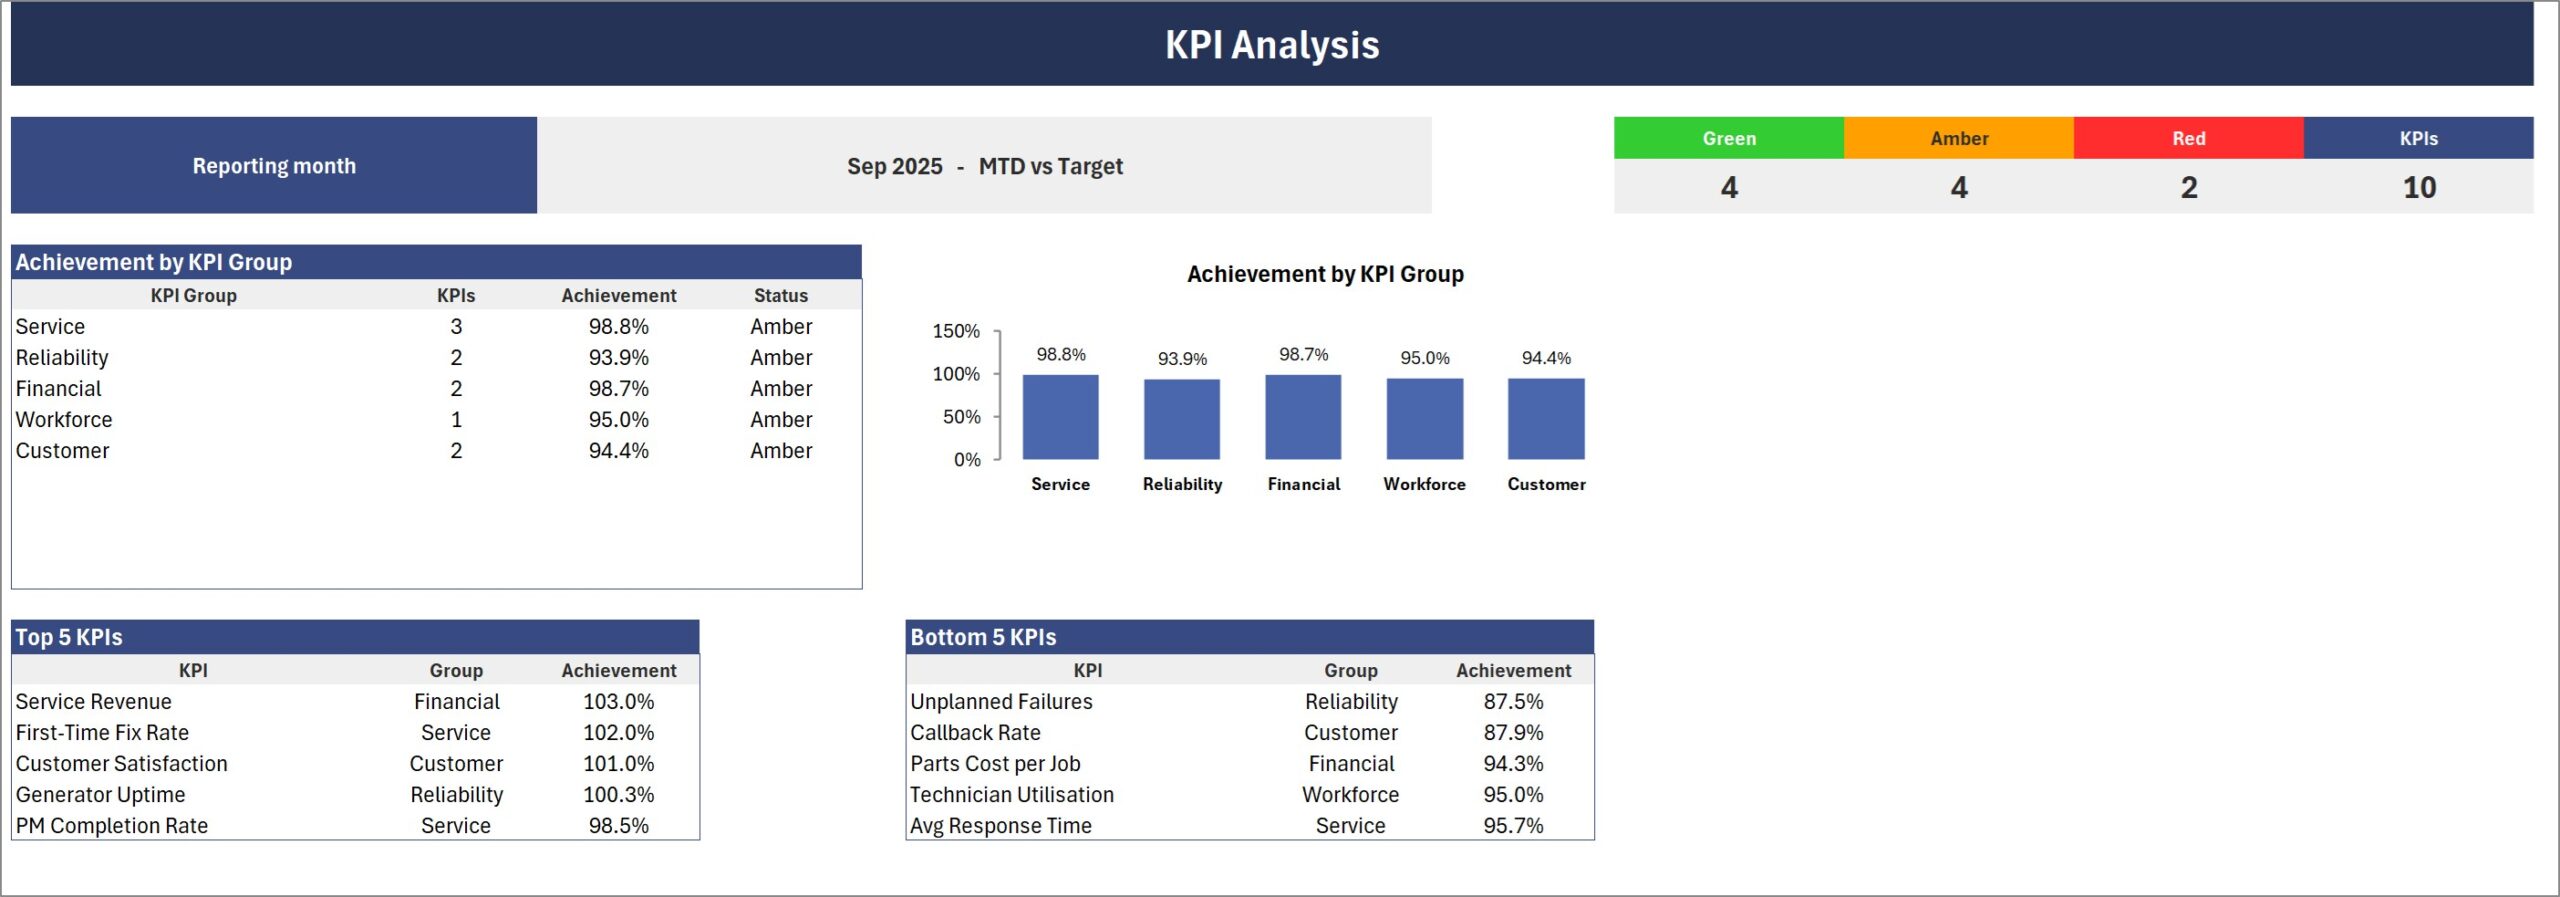
KPI Analysis summarises group achievement and ranks the top and bottom five KPIs.
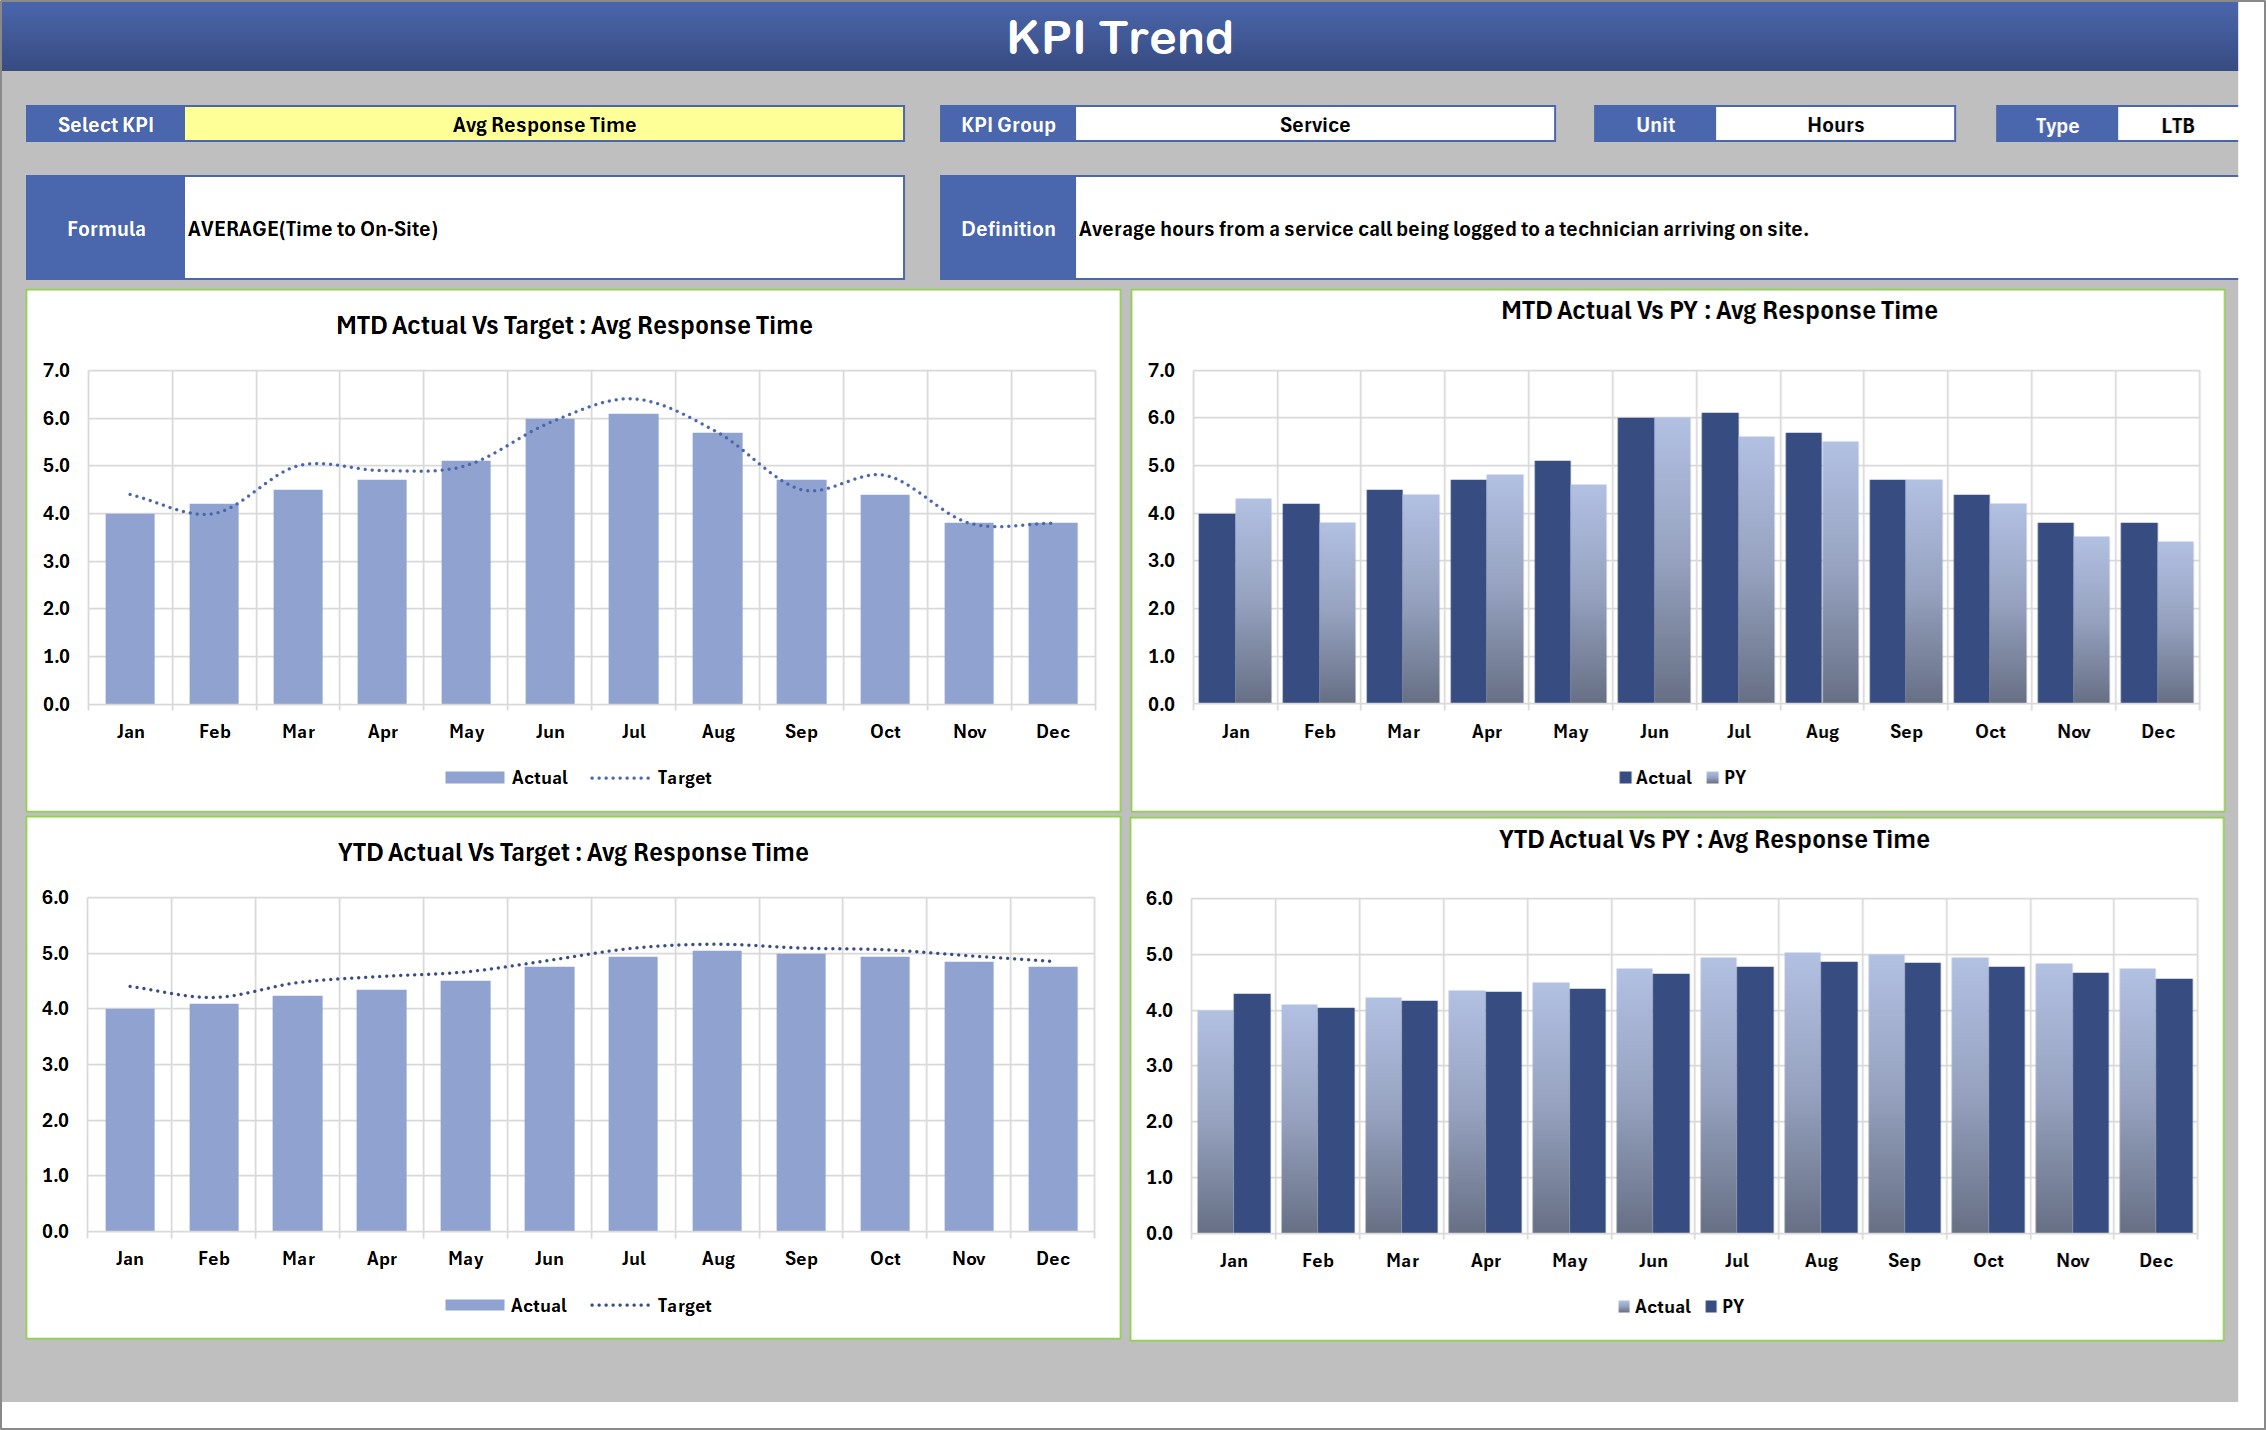
KPI Trend compares MTD and YTD actuals with target and prior-year values.
Generator Service KPI Scorecard in Excel vs. Google Sheets vs. Paid Field Service Software – Where This Fits
| Consideration | This Excel KPI Scorecard | Google Sheets alternative | Paid field service software |
|---|---|---|---|
| Cost | One-time template purchase | Template or manual build | Recurring subscription |
| Platform | Excel 2016 or later | Web browser | Vendor web/mobile app |
| Setup | Replace sample definitions and typed monthly figures | Configure sharing and formulas | Configure accounts, workflows, and integrations |
| Team collaboration | Share through your normal file process | Native simultaneous editing | Usually included by plan |
| Custom KPI definitions | Editable names, groups, units, formulas, and directions | Editable if built into the sheet | Depends on the vendor |
| Transaction records | Not included | Possible with additional design | Often included |
| Monthly executive review | Purpose-built scorecard and trends | Depends on design | Usually broader operational reporting |
Who This Template Is For – and Who It’s Not For
This template suits generator servicing businesses, maintenance contractors, operations managers, service coordinators, workshop managers, and owners who already calculate their monthly KPIs and want a consistent review pack. It is especially useful when each KPI needs a clear owner, definition, target, direction, and year-to-date method.
It is not a job-ticket system, maintenance scheduler, asset register, accounting package, live telemetry tool, or replacement for specialist field service software. It does not calculate KPIs from transaction-level records. Users enter finished KPI results, including the correct YTD value for each metric.
How to Use the Generator Service KPI Scorecard in Excel
- Extract the ZIP and save a clean copy of the workbook.
- Open KPI Definition and confirm each KPI name, group, unit, formula description, definition, UTB/LTB direction, and YTD basis.
- Enter finished monthly MTD and YTD Actual, Target, and PY values in the matching Input Data block.
- Use Color Settings to change the report title, reporting year, and RAG thresholds.
- Open Scorecard, choose the month, MTD or YTD, the comparison basis, and KPI set.
- Use KPI Analysis and KPI Trend during monthly reviews. Keep KPI names unique and leave the hidden Support sheets unchanged.
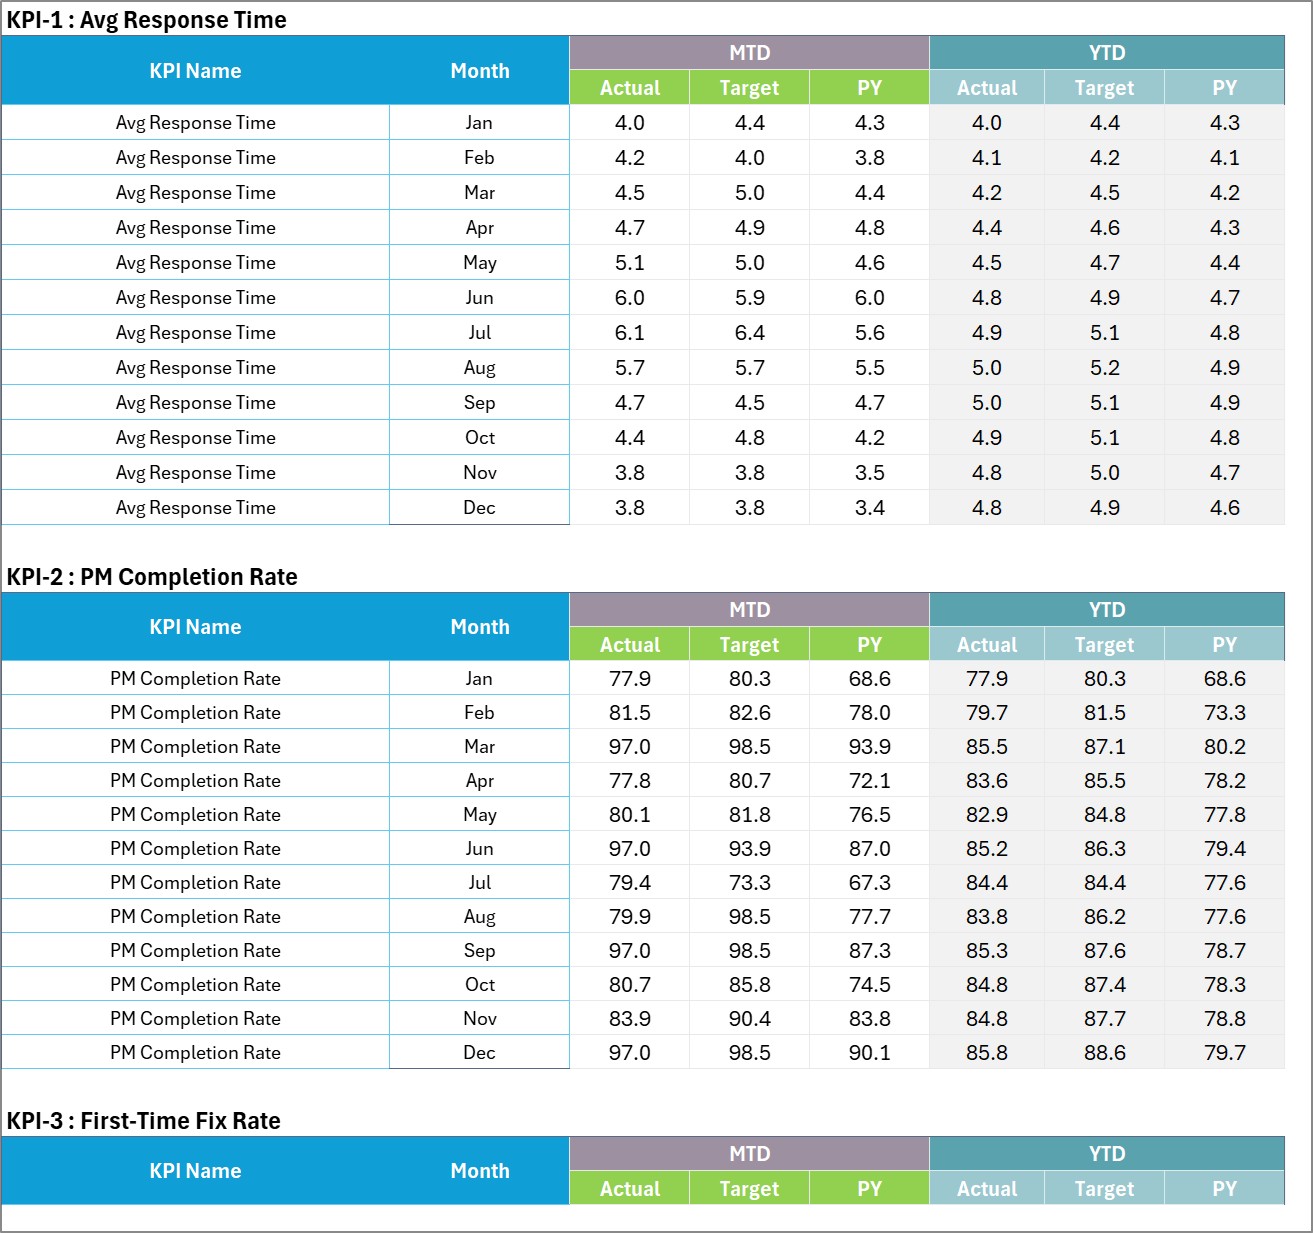
Input Data provides a numbered 12-month block for each KPI.
Real-World Use Cases
Monthly service operations meeting
A service manager can review response time, first-time fix rate, callbacks, and customer satisfaction in one consistent format.
Reliability review
An operations lead can track generator uptime and unplanned failures while using lower-the-better logic where appropriate.
Commercial and workforce review
An owner can place service revenue, parts cost per job, and technician utilisation beside operational KPIs without mixing transaction data into the scorecard.
Frequently Asked Questions
Is this a KPI Scorecard or Dashboard?
It is a KPI Scorecard. It presents a focused monthly tile wall, KPI analysis, and trend pages; it is not the separate Excel KPI Dashboard product line.
Does it use macros?
No. The workbook uses formulas, conditional formatting, camera pictures, and sparklines.
How many KPIs can I use?
The workbook has room for 20 KPIs and displays ten at a time.
Does it calculate my KPIs from raw jobs?
No. Calculate each KPI in your working system, then type or paste the finished MTD and YTD figures as values.
Can I change KPI names and thresholds?
Yes. KPI Definition controls names and logic; Color Settings controls the RAG bands, report title, and year.
Which Excel version is required?
Use Microsoft Excel 2016 or later.
About the Author
Built by PK – Microsoft Certified Professional with 15+ years of Excel, Google Sheets, and Power BI experience. Founder of NextGenTemplates, reaching 300K+ subscribers across YouTube channels. Every template is hand-built and tested before release.
Explore Related Templates
Compare this scorecard with the Garage Door Service KPI Scorecard in Excel, Elevator Maintenance KPI Scorecard in Excel, and Septic Tank Service KPI Scorecard in Excel. Browse the Excel KPI templates category and Microsoft Excel templates for related formats.
Download the Generator Service KPI Scorecard in Excel to standardise monthly KPI reviews without building a scorecard from scratch.
Last updated: September 2026.





























Reviews
There are no reviews yet.