

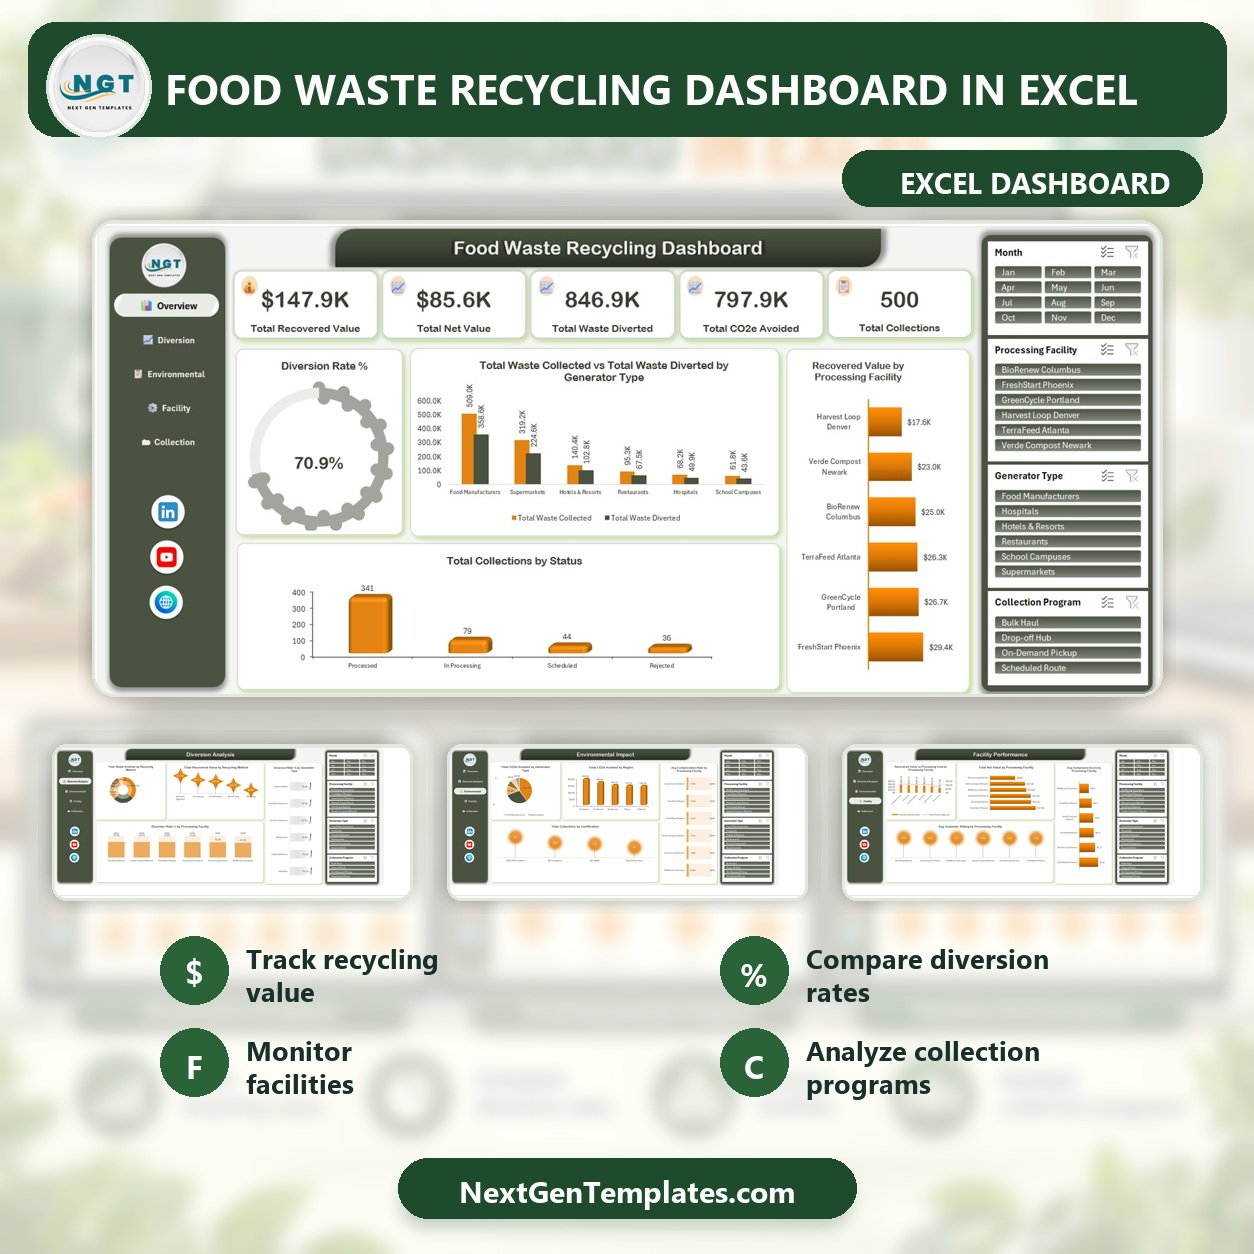
Turn 500 sample collection records into an actionable recycling view without a recurring software subscription. The Food Waste Recycling Dashboard in Excel summarizes recovered value, net value, waste diverted, CO2e avoided, collection volume, and a 70.9% sample diversion rate across five focused pages. Built for Microsoft Excel, it gives recycling teams a ready-to-use analysis structure while keeping the underlying workbook editable. Download the file, review the sample data, replace it with records shaped like your operation, and validate the results before using them for decisions. Your purchase is a one-time digital download backed by a practical user manual.
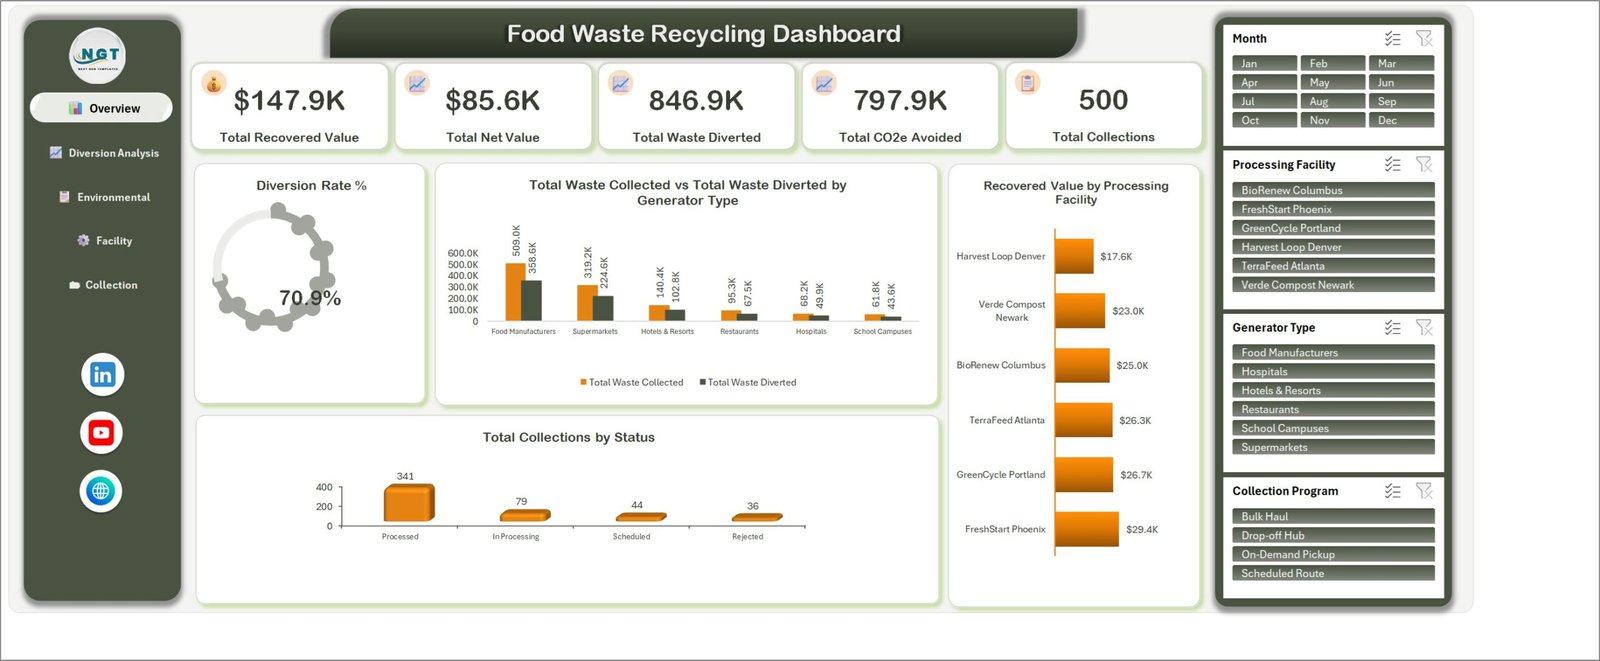
Overview page with five headline KPIs and four interactive slicers.
Key Features of Food Waste Recycling Dashboard in Excel
- Five decision pages: move between Overview, Diversion Analysis, Environmental Impact, Facility Performance, and Collection Programs.
- Five overview KPIs: compare total recovered value, total net value, waste diverted, CO2e avoided, and collections.
- Four reusable filters: slice by month, processing facility, generator type, and collection program where provided.
- Operational status analysis: see processed, in-processing, scheduled, and rejected collections.
- Diversion and value analysis: compare recycling methods, generator types, and processing facilities.
- Environmental reporting support: review avoided emissions, contamination rates, certification counts, and regional patterns.
- Facility comparison: examine recovered value, processing cost, net value, compliance score, and customer rating.
- Collection program analysis: compare scheduled routes, bulk haul, on-demand pickup, and drop-off hubs.
This food waste recycling Excel dashboard is designed for structured review and presentation; it does not replace audited sustainability reporting, route software, or a regulated environmental information system.
What’s Inside the Food Waste Recycling Dashboard in Excel
Overview
The opening page combines headline KPIs with diversion rate, generator comparisons, recovered value by facility, and collection status. It is the fastest page for a management meeting or monthly review.
Diversion Analysis
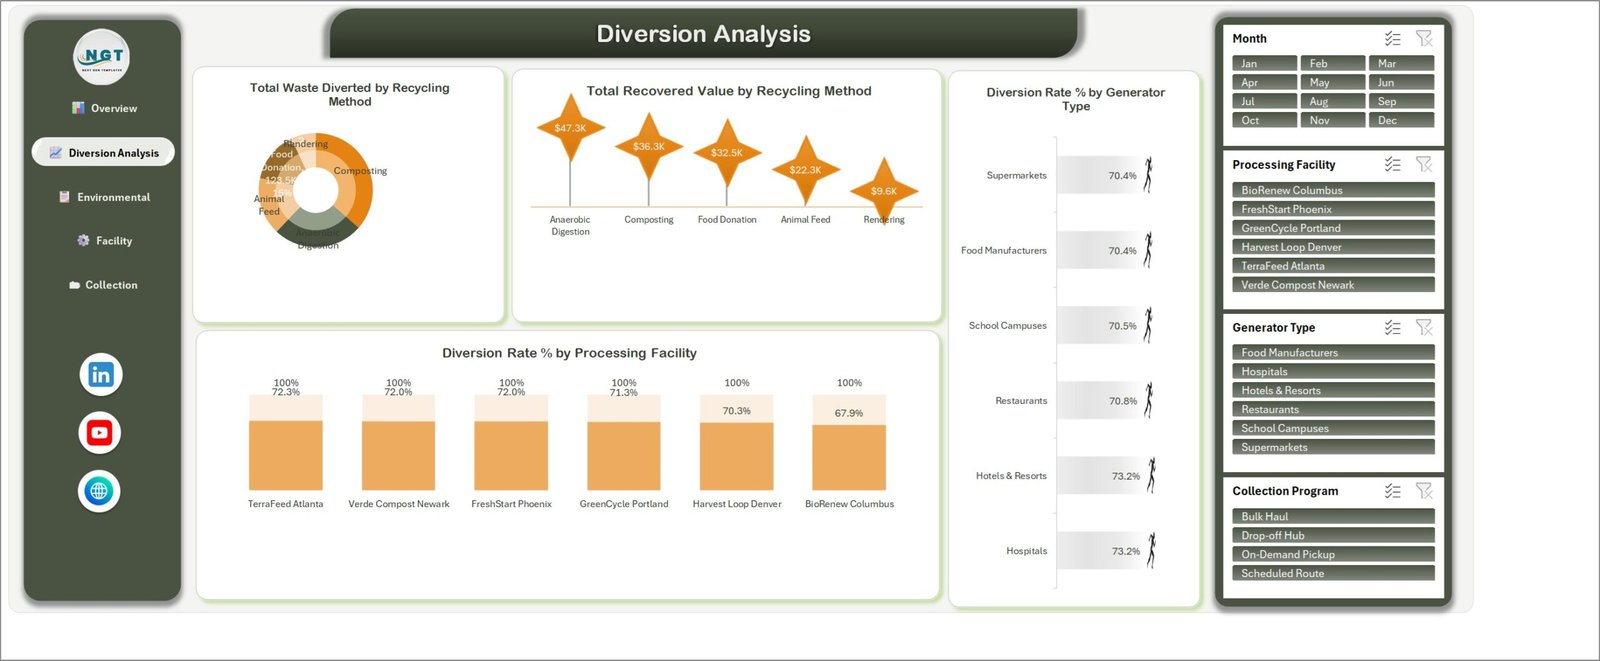
Diversion analysis by recycling method, generator type, and facility.
Compare waste diverted across anaerobic digestion, composting, food donation, animal feed, and rendering. The page also shows recovered value by method and diversion rate by generator and processing facility.
Environmental Impact
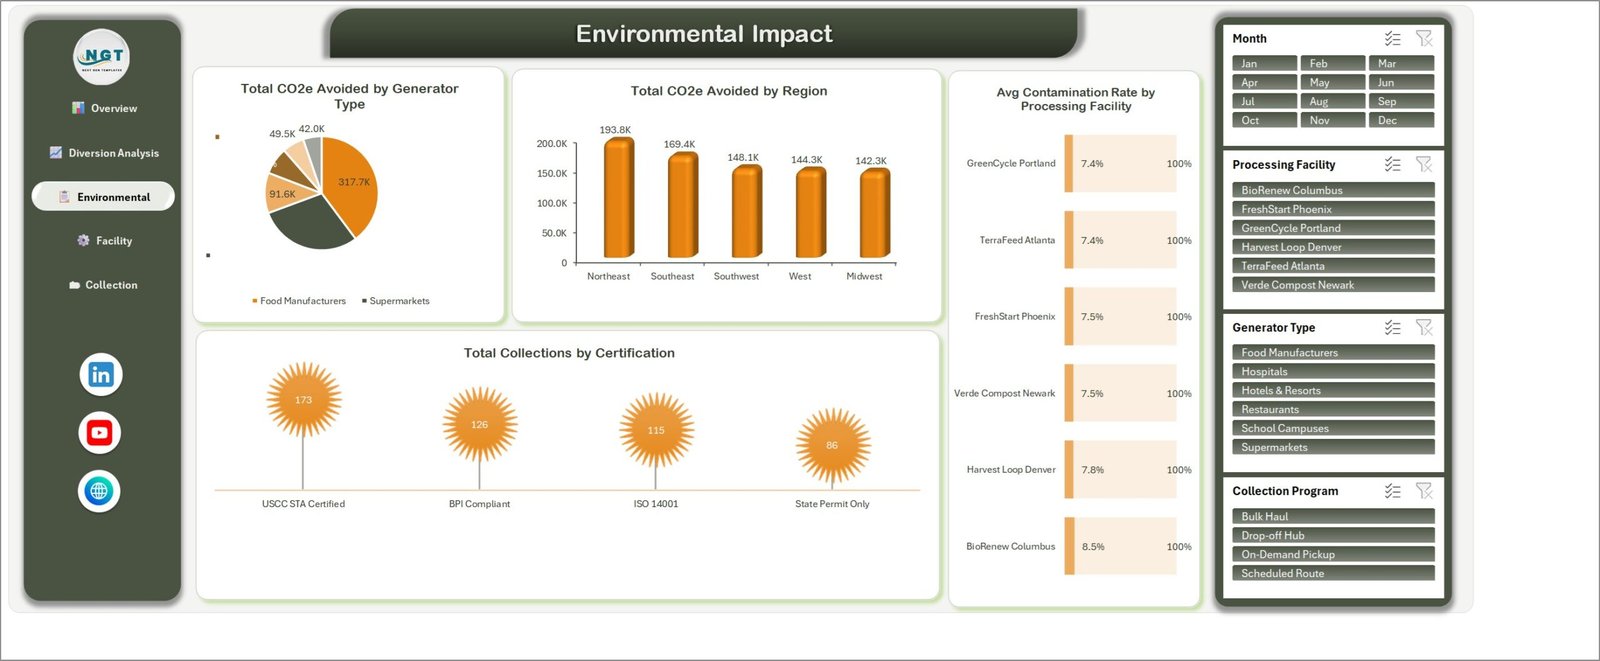
Environmental indicators for avoided emissions, contamination, and certification.
This food waste management dashboard page breaks down CO2e avoided by generator type and region, average contamination rate by facility, and collections by certification.
Facility Performance
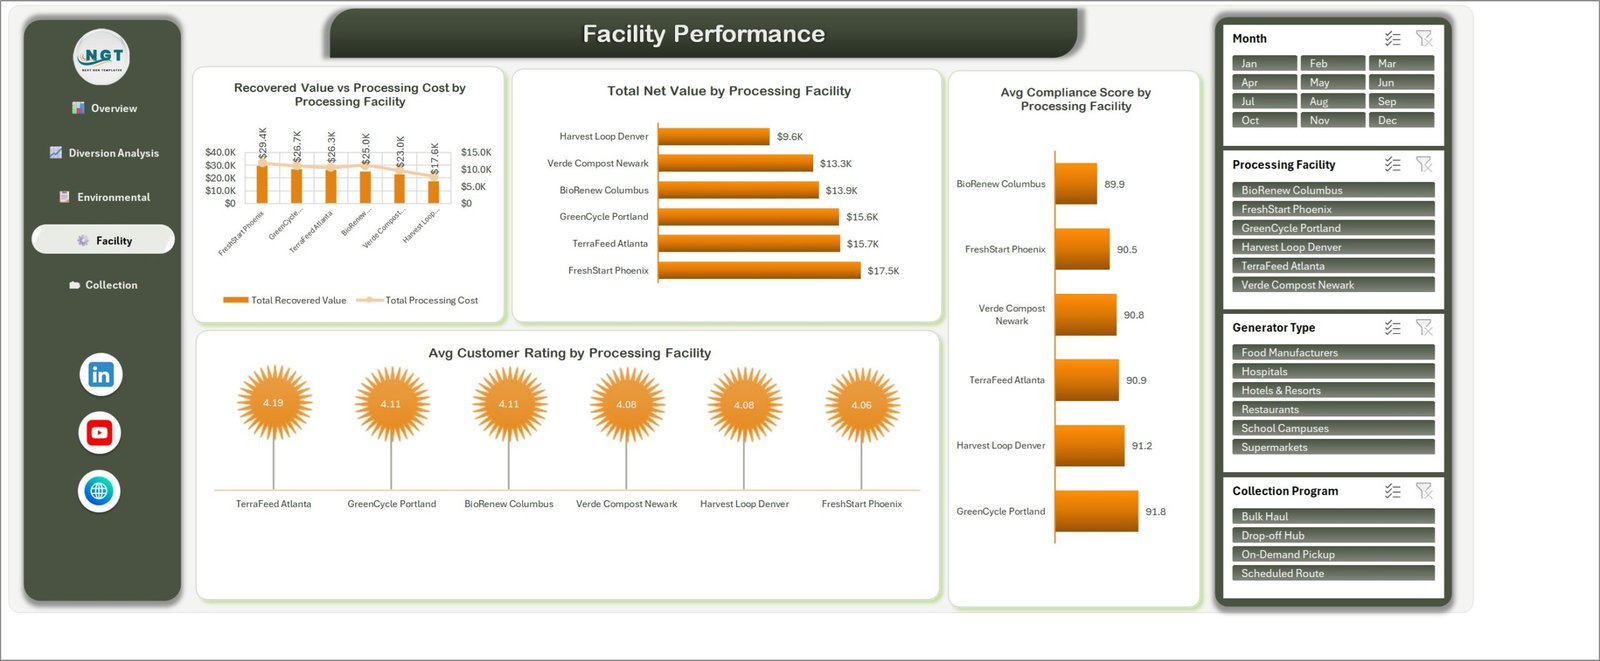
Facility-level value, cost, net value, compliance, and rating comparisons.
Use the page to compare recovered value against processing cost, net value, compliance score, and average customer rating for six sample facilities.
Collection Programs
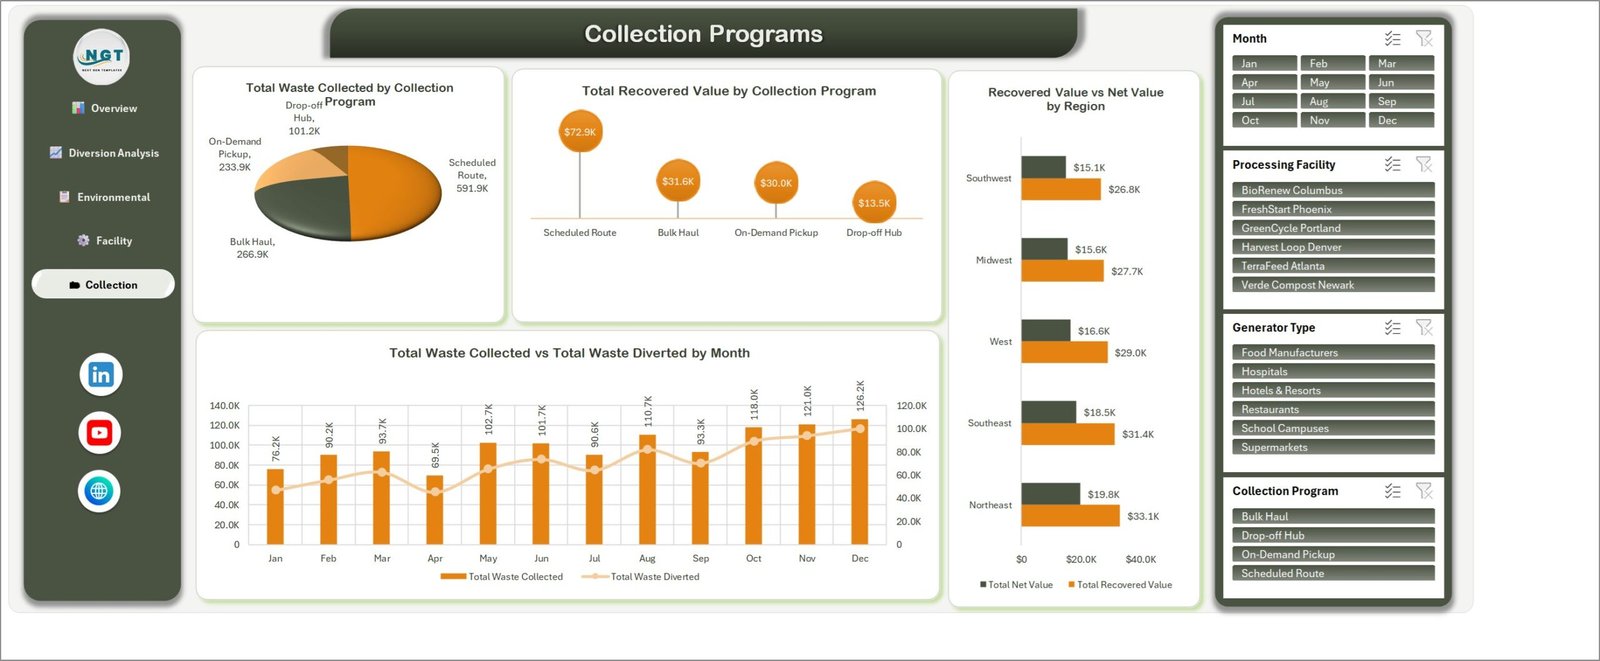
Collection program mix, monthly volume, and regional value comparisons.
The final food diversion dashboard page compares collection volume and recovered value by program, regional recovered versus net value, and monthly collected versus diverted waste.
Food Waste Recycling Dashboard in Excel vs. Google Sheets vs. Paid Waste SaaS – Where This Fits
| Consideration | This Excel template | Google Sheets alternative | Paid waste SaaS |
|---|---|---|---|
| Cost | One-time purchase | Template plus Google account | Usually recurring subscription |
| Platform | Microsoft Excel desktop | Web browser | Vendor platform |
| Setup | Replace structured sample data | Copy and configure a sheet | Implementation and onboarding |
| Collaboration | File sharing or Microsoft 365 | Native live collaboration | Role-based collaboration |
| Customization | Editable workbook | Editable sheet | Vendor-controlled options |
| Facility and diversion views | Included across five pages | Depends on build | Often configurable |
| Route execution or compliance filing | Not included | Not included by default | May be included |
Who This Template Is For – and Who It’s Not For
It suits food recovery programs, composting operators, sustainability coordinators, facilities teams, hospitality groups, supermarkets, manufacturers, schools, and consultants who already collect structured monthly data and want a clear Excel reporting layer. It is not a dispatch system, customer portal, live IoT integration, carbon-accounting certification tool, or regulatory filing application. Teams needing automatic data feeds, permissions, audit trails, or route optimization should evaluate dedicated software.
How to Use the Food Waste Recycling Dashboard in Excel
- Download and unzip the customer package.
- Open the workbook in Microsoft Excel and keep an untouched backup.
- Review the included sample records and the user manual.
- Map your fields to the workbook’s expected structure before replacing sample data.
- Refresh calculations and test each month, facility, generator, and program filter.
- Reconcile totals against the source system before sharing results.
Real-World Use Cases
Maya, a sustainability manager, uses the overview and environmental pages in a monthly waste review. Daniel, a composting operations lead, compares net value and contamination across facilities. Priya, a hospitality analyst, uses the collection page to discuss program mix and diverted volume with site managers. These are reporting examples, not promises of operational or environmental outcomes.
Frequently Asked Questions
Does it include the Excel workbook?
Yes. The ZIP contains the Excel workbook and an Excel dashboard user manual.
Which pages are included?
Overview, Diversion Analysis, Environmental Impact, Facility Performance, and Collection Programs.
Can I filter the dashboard?
Yes. The screenshots show month, processing facility, generator type, and collection program slicers on relevant pages.
Does it connect automatically to my systems?
No. Automatic integrations are not included; prepare and validate data in the workbook’s expected structure.
Is this a carbon accounting or compliance tool?
No. It presents entered data and is not a substitute for audited calculations or statutory reporting.
Can I customize it?
The workbook is editable in Excel, but changes to formulas, charts, or layouts should be tested on a copy.
Is a subscription required?
No recurring template subscription is required. Microsoft Excel is needed to use the workbook.
About the Author
Built by PK – Microsoft Certified Professional with 15+ years of Excel, Google Sheets, and Power BI experience. Founder of NextGenTemplates, reaching 300K+ subscribers across YouTube channels. Every template is hand-built and tested before release.
Explore Related Templates
Compare the E-waste Recycling Dashboard in Excel, Recycling Infrastructure Dashboard in Excel, and ESG Reporting Dashboard in Excel. You can also browse the Excel dashboard collection.
Ready to organize food-recovery reporting? Download the Excel recycling dashboard template, replace the sample data carefully, verify the totals, and bring a consistent five-page view to your next review.
Last updated: September 16, 2026.































Reviews
There are no reviews yet.