

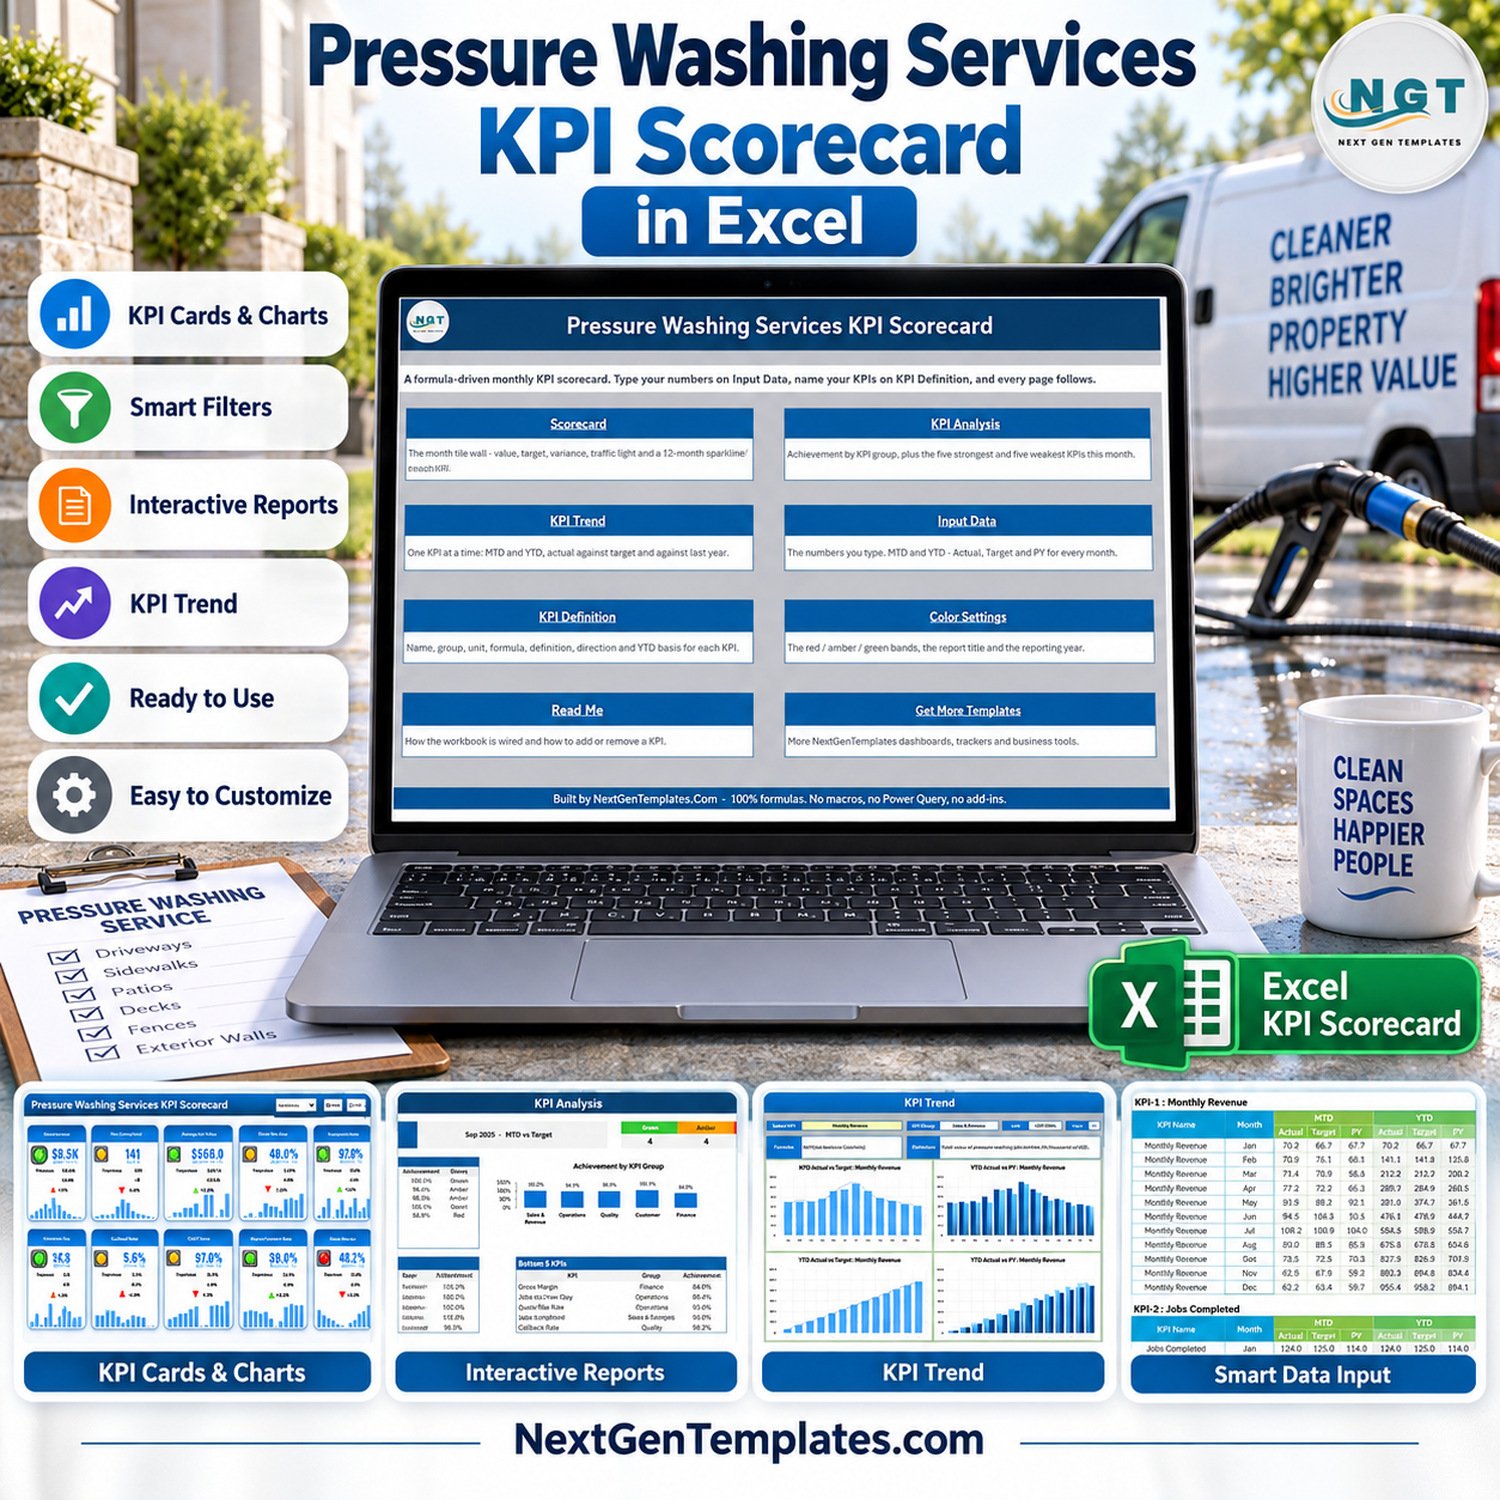
Pressure Washing Services KPI Scorecard in Excel turns 10 pressure washing KPIs into a monthly Excel review pack with 9 visible sheets, 20 KPI slots and a full 2025 sample year. The September sample shows 4 green KPIs, 4 amber KPIs and 2 red KPIs, so buyers can see immediately how the traffic-light logic works. Built by PK, a Microsoft Certified Professional with 15+ years of spreadsheet experience and 300K+ YouTube subscribers, this is a one-time download with no subscription and no macros.
Pressure washing Excel KPI scorecard
Key Features of Pressure Washing Services KPI Scorecard in Excel
- Ready-made pressure washing KPI set: Monthly Revenue, Jobs Completed, Average Job Value, Quote Win Rate, Equipment Uptime, Jobs per Crew-Day, Callback Rate, CSAT Score, Repeat Customer Rate and Gross Margin.
- Monthly scorecard tiles: each tile shows actual value, comparison value, variance, percentage change, traffic light and a 12-month sparkline.
- MTD and YTD controls: switch between month-to-date and year-to-date views from the header.
- Comparison picker: compare actuals against Target, previous year or prior month depending on the meeting question.
- Direction-aware traffic lights: UTB and LTB logic keeps Callback Rate from being misread as good when it rises.
- KPI Analysis and Trend pages: review RAG counts, achievement by KPI group, Top 5, Bottom 5 and one-KPI trend charts.
- No macros: the workbook uses formulas, conditional formatting, linked pictures, form controls and sparklines only.
What’s Inside This Excel Scorecard
The workbook contains Home, Scorecard, KPI Analysis, KPI Trend, Input Data, KPI Definition, Color Settings, Read Me and Get More Templates sheets. The Home page explains the navigation. Scorecard is the main review wall. KPI Analysis summarizes status by group and highlights the strongest and weakest KPIs. KPI Trend gives one KPI at a time with MTD and YTD charts. Input Data is where monthly values are typed. KPI Definition stores names, groups, units, formulas, definitions, KPI direction and YTD basis.
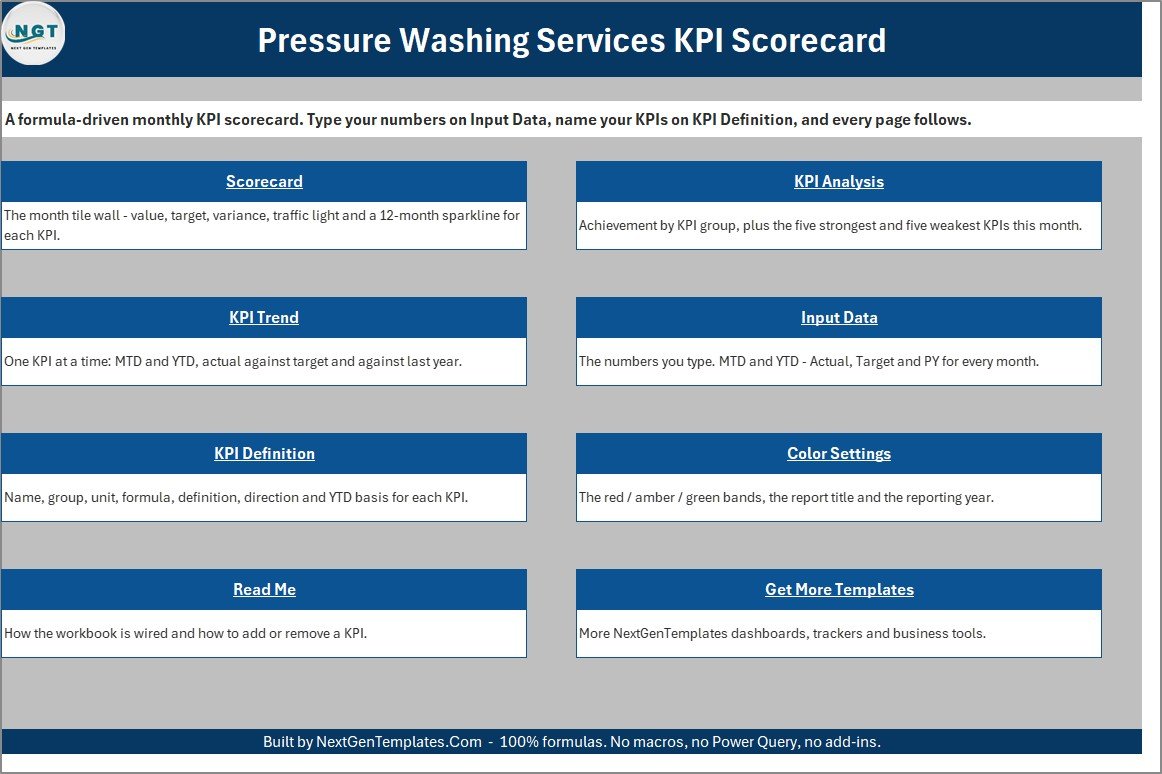
Home sheet
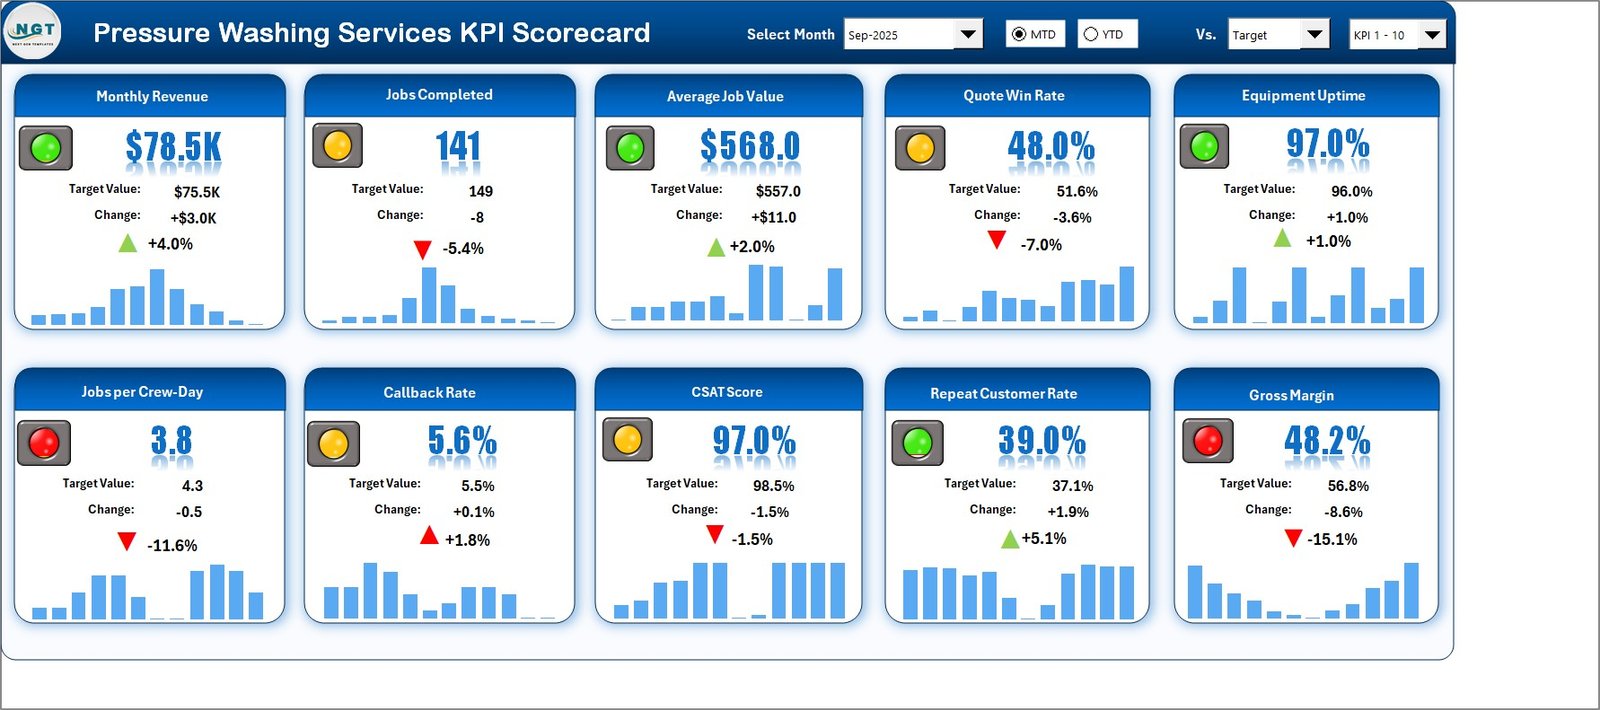
Scorecard sheet
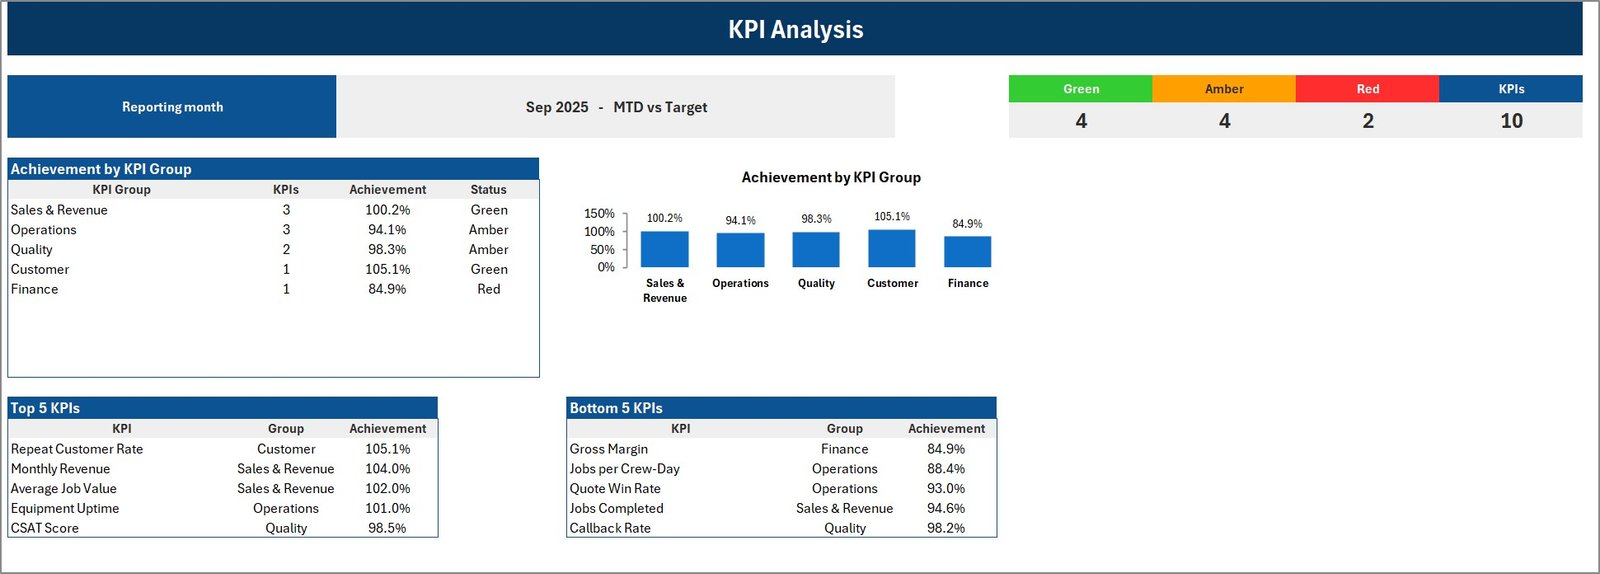
KPI Analysis sheet
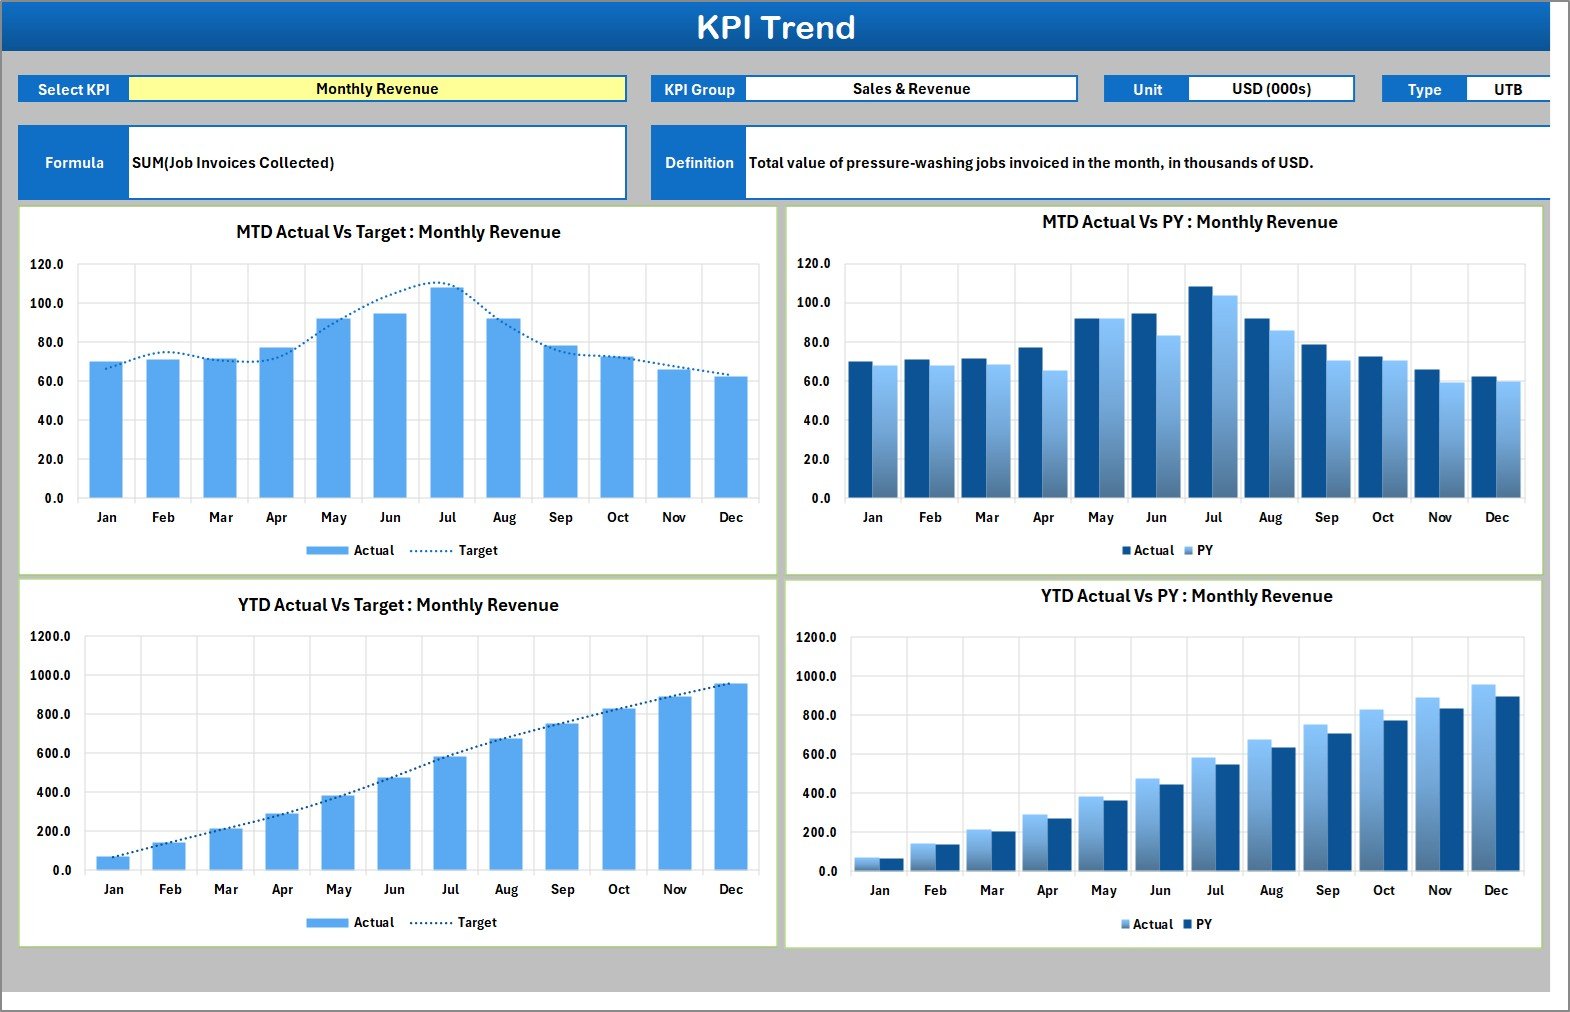
KPI Trend sheet
Excel Scorecard vs. Google Sheets vs. Paid CRM/SaaS – Where This Fits
| Area | This Excel scorecard | Google Sheets build | Field service SaaS |
|---|---|---|---|
| Cost | $9.99 sale price, one-time | Free app, build time required | Monthly subscription |
| Setup time | Minutes after download | Build formulas, charts and rules yourself | Account setup and migration |
| Custom KPIs | 20 slots with names, formulas and definitions | Fully custom if you build it | Limited by vendor reports |
| Traffic lights | Built in for UTB and LTB KPIs | Manual conditional formatting | Plan-dependent |
| Scheduling and invoices | Not included | Not included unless built | Usually included |
| Best use | Monthly owner or manager KPI review | Collaborative custom tracking | Daily field service operations |
Who This Template Is For – and Who It’s Not For
This scorecard is for owners, operations managers, office managers and bookkeepers in pressure washing, soft washing and exterior cleaning businesses who already have numbers but need a clean monthly review view. It is especially useful when revenue, job count, quote conversion, callbacks, satisfaction and margin live across different systems.
It is not a scheduling system, CRM, quote tool, invoice tool, chemical log, route planner or compliance tracker. It also does not verify stormwater, runoff, licensing, safety or environmental compliance. It reports the values you enter.
How to Use This Excel KPI Scorecard
- Unzip the download and open the Excel workbook in desktop Excel 2016 or later.
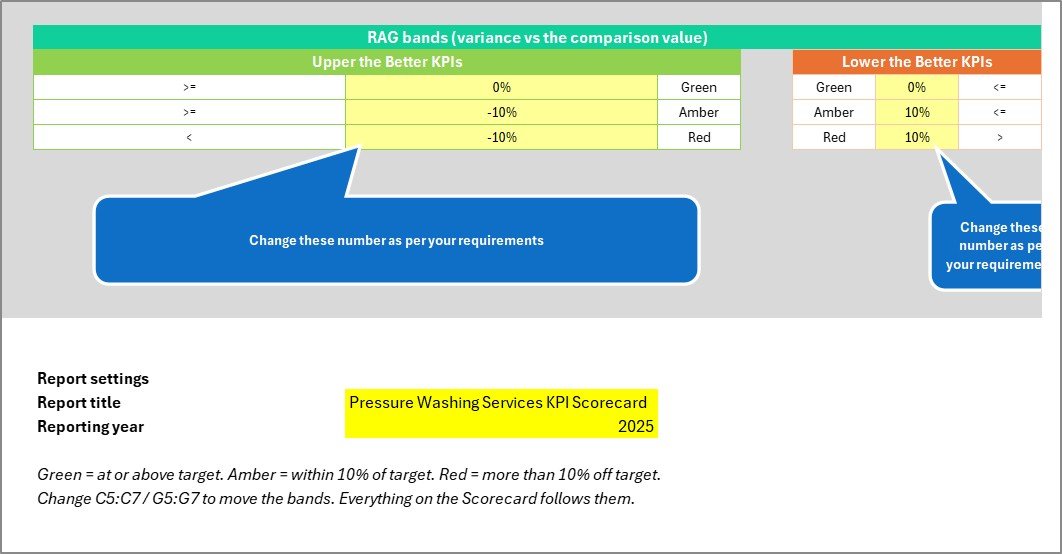
- Open Color Settings and set the report title, reporting year and green/amber/red bands.
- Review KPI Definition and adjust the KPI names, groups, units, formulas, definitions, direction and YTD basis.
- Enter monthly MTD and YTD actual, target and previous-year values on Input Data.
- Use Scorecard for the meeting wall, KPI Analysis for strongest and weakest KPIs, and KPI Trend for monthly movement. For formula basics, see Microsoft’s overview of formulas in Excel.
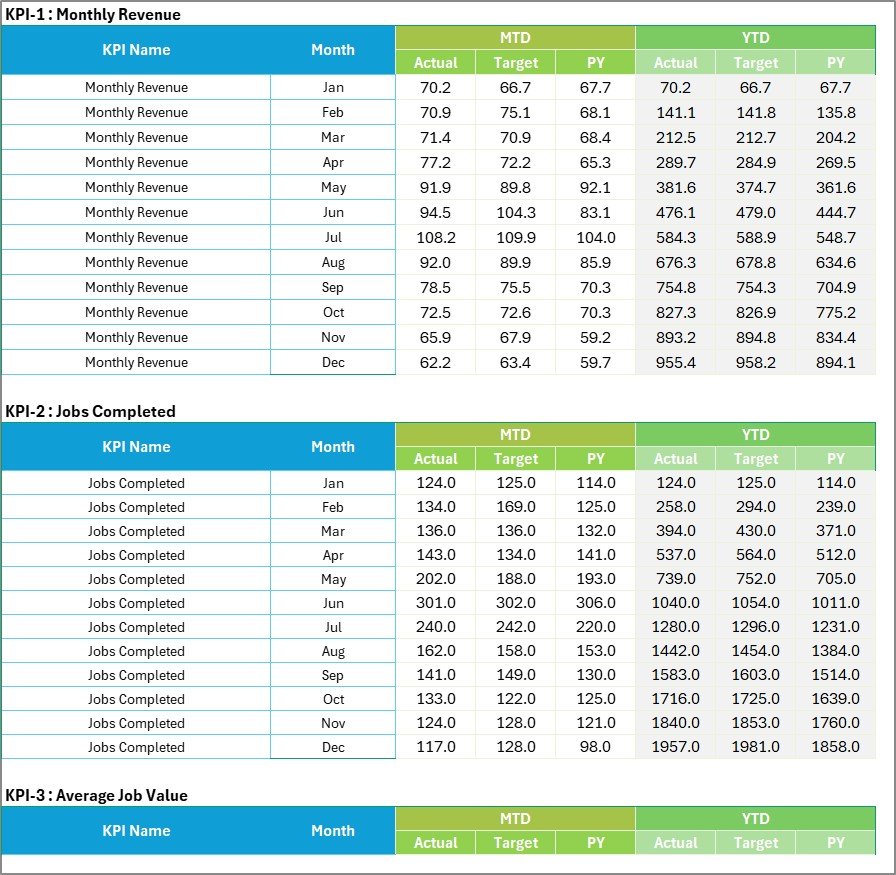
Input Data sheet

KPI Definition sheet
Real-World Use Cases
Owner review: a three-rig exterior cleaning business checks why Jobs per Crew-Day is red at 3.8 against 4.3 and then opens KPI Trend before deciding whether the issue is weather, crew routing or job mix.
Sales follow-up: an office manager sees Quote Win Rate in amber while Repeat Customer Rate is green, then shifts the next week’s follow-up time toward open quotes.
Margin check: a bookkeeper flags Gross Margin in the Bottom 5 and prepares labor, fuel and chemical cost notes for the monthly meeting.
Frequently Asked Questions
What does the download include?
The customer ZIP includes the Excel workbook and a PDF user manual. Loose workbook, manual and config files are not separate downloads.
Does this scorecard use macros?
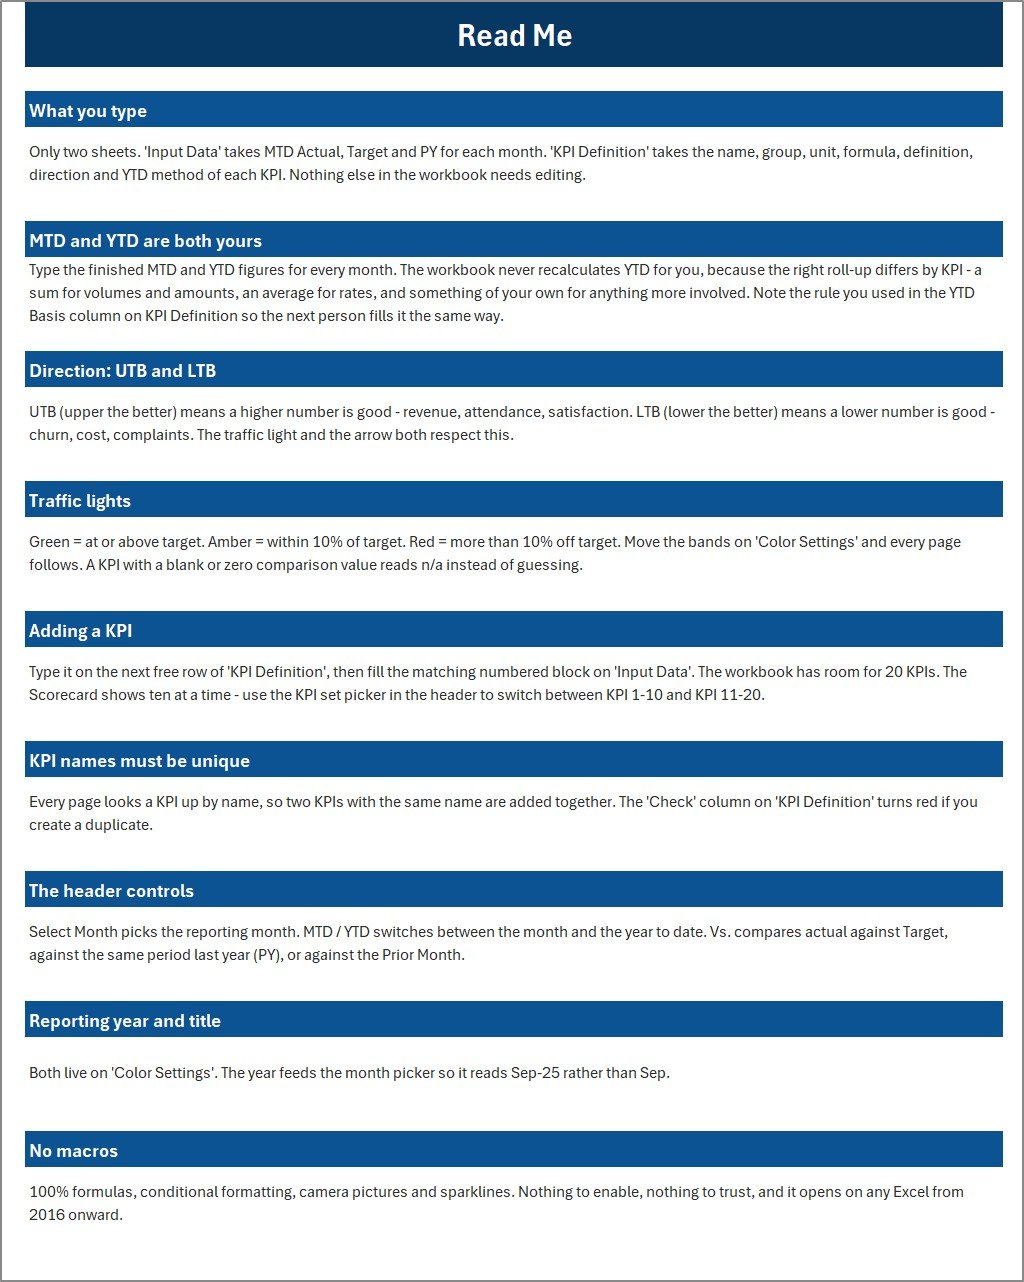
No. It uses formulas, conditional formatting, camera pictures, form controls and sparklines only.
Can I add more KPIs?
Yes. The workbook has room for 20 KPI slots. The visible scorecard can switch between KPI 1-10 and KPI 11-20.
Can I change traffic-light thresholds?
Yes. Color Settings controls the green, amber and red bands for Upper-the-Better and Lower-the-Better KPIs.
Does it work in Excel for the web?
The workbook may display online, but the interactive dropdown controls are designed for desktop Microsoft Excel.
Does it track individual customers or jobs?
No. It works with monthly KPI totals, targets and comparison values that you type into the file.
About the Author
Built by PK – Microsoft Certified Professional with 15+ years of Excel, Google Sheets, and Power BI experience. Founder of NextGenTemplates, reaching 300K+ subscribers across YouTube channels. Every template is hand-built and tested before release.
Explore Related Templates
- Plumbing Business KPI Scorecard in Excel
- Cleaning Services KPI Dashboard in Excel
- Office Cleaning Request Tracker in Excel
- Cleaning Staff Performance Dashboard in Google Sheets
- KPI Dashboard Library (Excel)
Download this Excel scorecard if you want a clean monthly pressure washing KPI review without building the workbook from scratch.
Last updated: September 2026
📖 Read the complete walkthrough of the Pressure Washing Services KPI Scorecard in Excel on our blog: Pressure Washing Services KPI Scorecard in Excel – full guide.































Reviews
There are no reviews yet.