

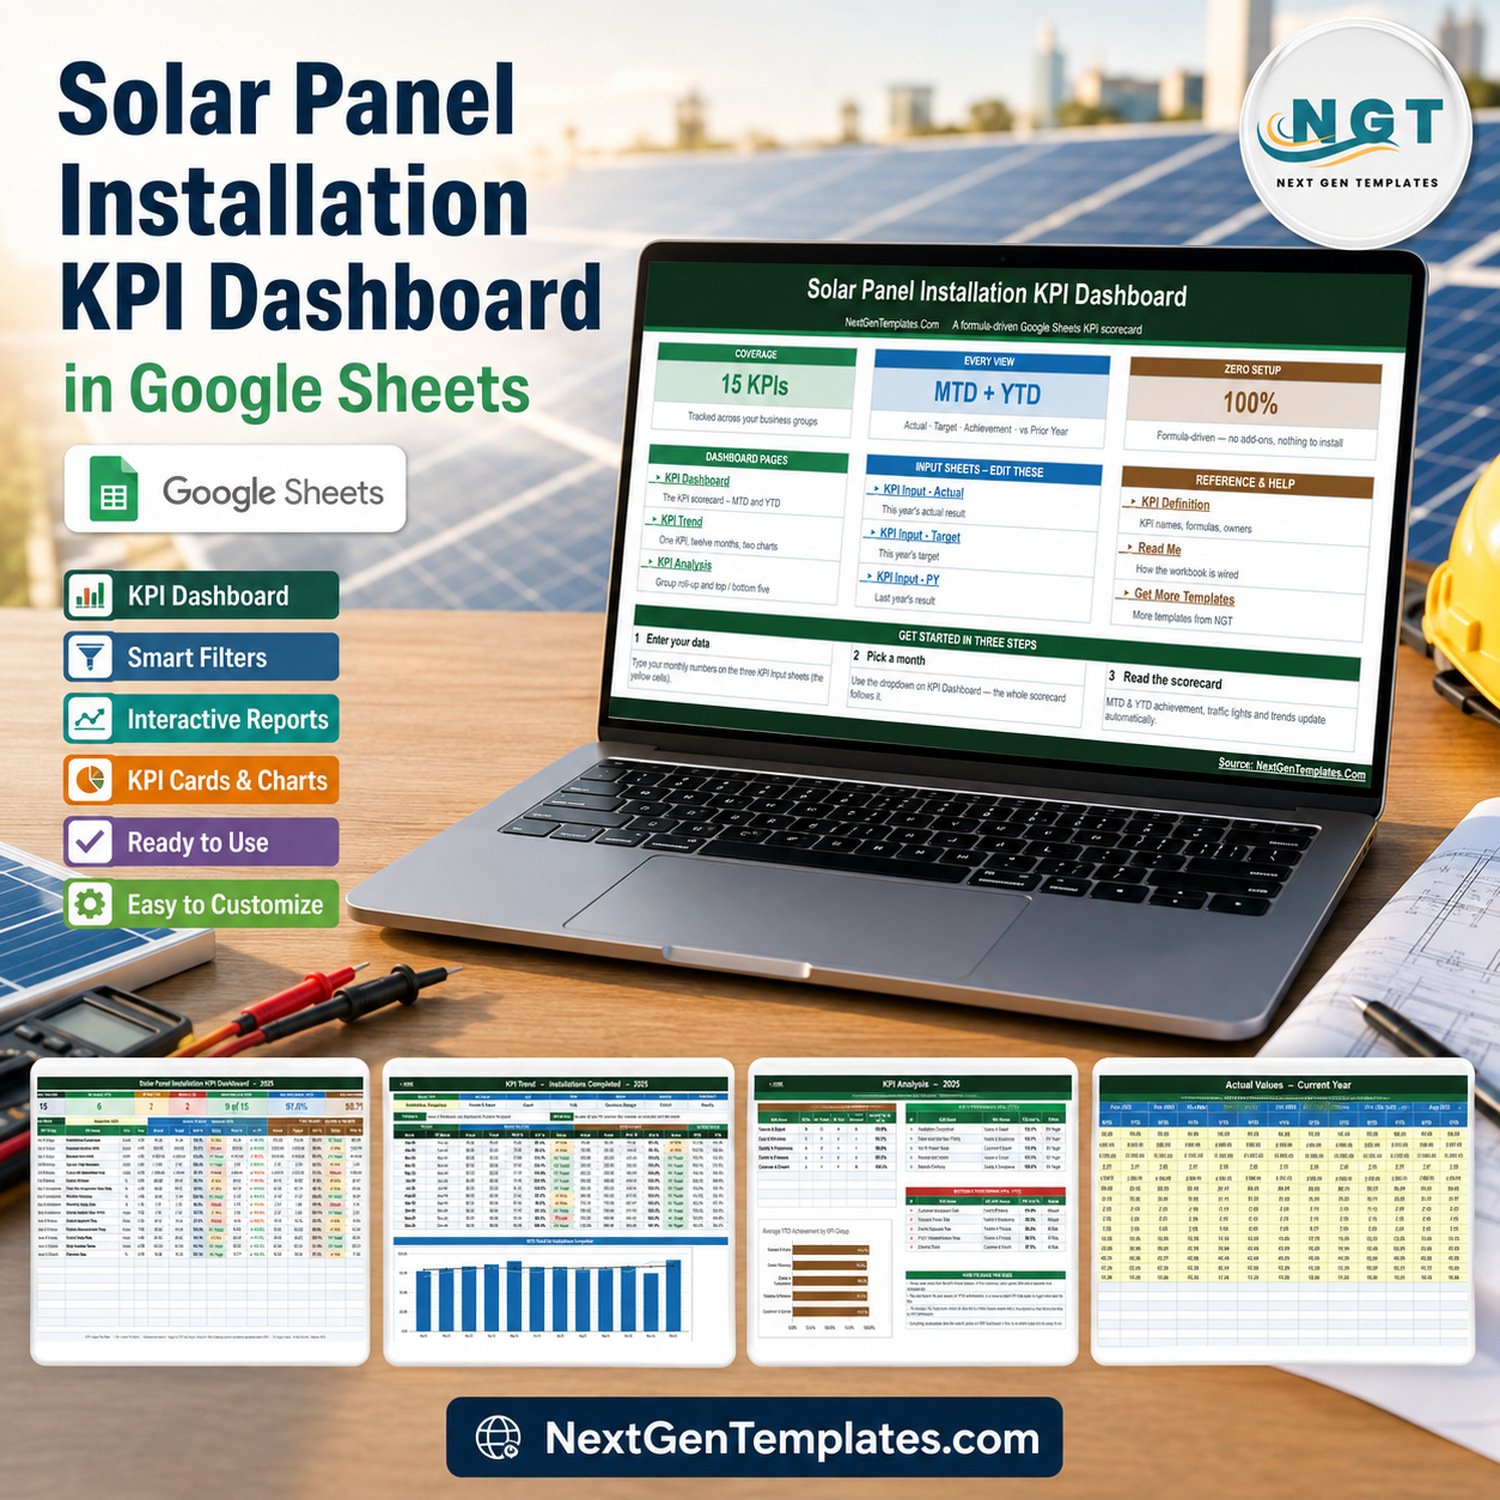

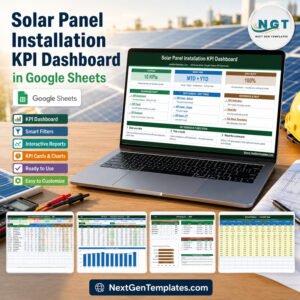
The Solar Panel Installation KPI Dashboard in Google Sheets is a ready-to-use, formula-driven scorecard for residential and commercial solar contractors. It tracks 15 installation KPIs across five business groups, shows Month-to-Date and Year-to-Date achievement side by side, colours every KPI On Target, At Risk or Missed, and compares each month against the same month last year — all from three simple input sheets. No add-ons, no scripts, no connected data source.
Pick a month from one dropdown and the entire workbook re-bases: the header cards, the 15-row scorecard, the group roll-up and the top and bottom five all follow it. The sample build ships loaded with a full 2025 dataset (January to December) so you can see exactly how it behaves before you replace a single number.
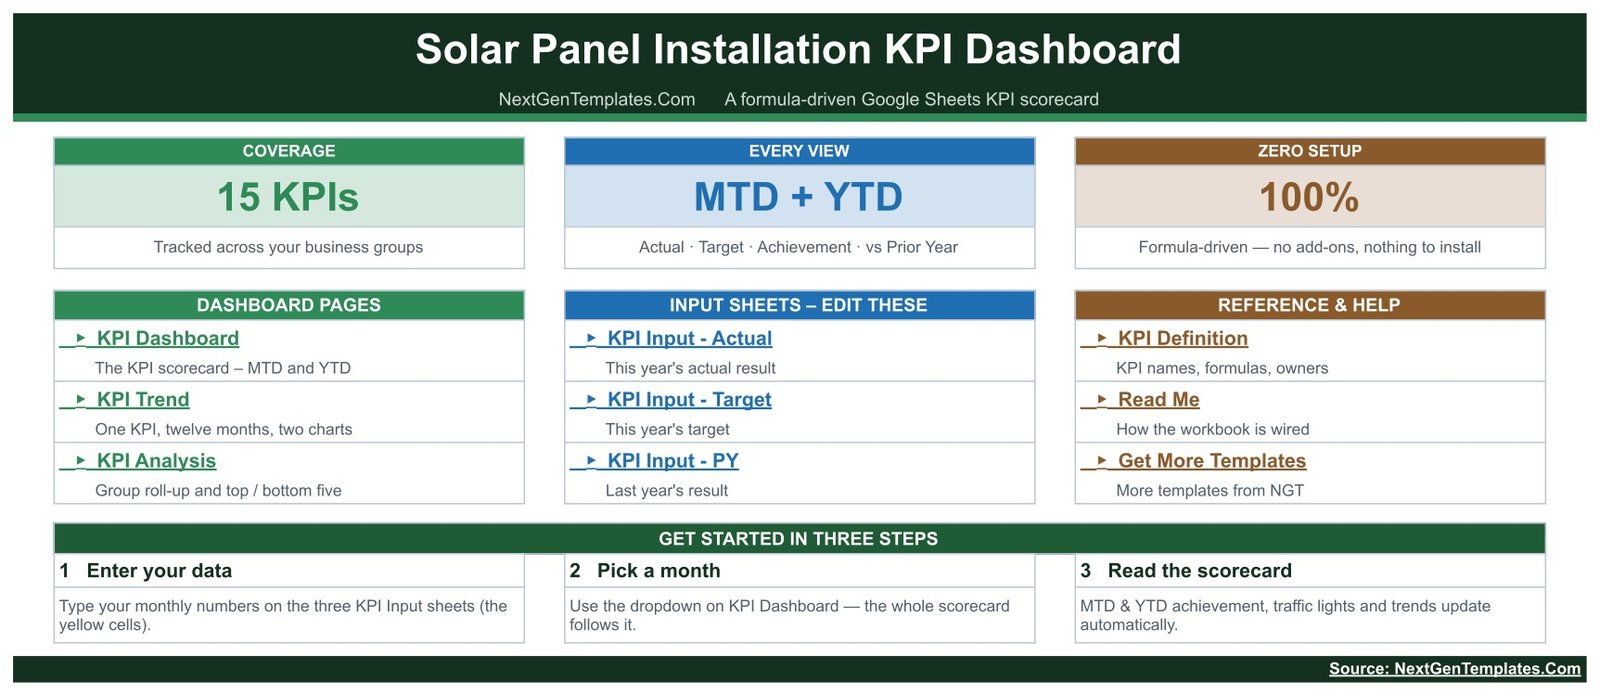
What the Solar Panel Installation KPI Dashboard Measures
Fifteen KPIs, grouped the way a solar installer actually runs the business. Each one carries a unit, a direction (UTB = upper the better, LTB = lower the better), an owner, a priority and a written formula and definition, so nobody has to guess what a number means.
| # | KPI Group | KPI | Unit | Type | Owner |
|---|---|---|---|---|---|
| 1 | Volume & Output | Installations Completed | Count | UTB | Operations Manager |
| 2 | Volume & Output | Capacity Installed (kW) | Count | UTB | Operations Manager |
| 3 | Volume & Output | Revenue per Install | USD | UTB | Sales Director |
| 4 | Cost & Efficiency | Cost per Watt Installed | USD | LTB | Finance Controller |
| 5 | Cost & Efficiency | Customer Acquisition Cost | USD | LTB | Marketing Lead |
| 6 | Cost & Efficiency | Crew Utilisation | % | UTB | Field Operations Lead |
| 7 | Quality & Compliance | First-Time Inspection Pass Rate | % | UTB | Quality Manager |
| 8 | Quality & Compliance | Module Efficiency | % | UTB | Design Engineer |
| 9 | Quality & Compliance | Warranty Claim Rate | % | LTB | Service Manager |
| 10 | Quality & Compliance | Safety Incident Rate (TRIR) | Index | LTB | EHS Officer |
| 11 | Timeline & Process | Permit Approval Time | Days | LTB | Permitting Coordinator |
| 12 | Timeline & Process | PTO / Interconnection Time | Days | LTB | Interconnection Lead |
| 13 | Timeline & Process | Install Cycle Time | Days | LTB | Project Manager |
| 14 | Customer & Growth | Net Promoter Score | Index | UTB | Customer Success Lead |
| 15 | Customer & Growth | Referral Rate | % | UTB | Marketing Lead |
Eight KPIs are upper-the-better and seven are lower-the-better. That matters: achievement is Actual divided by Target for UTB and Target divided by Actual for LTB, so beating a cost or a cycle-time target correctly scores above 100% instead of below it.
Inside the Workbook, Page by Page
KPI Dashboard — the scorecard
Seven header cards summarise the selected month at a glance: Total KPIs Tracked, On Target (YTD), At Risk (YTD), Missed (YTD), Improving vs PY (MTD), Avg Achievement (MTD) and Avg Achievement (YTD). Below them sits the 15-row table with a Month-to-Date block (Actual, Target, Achievement %, Status, Prior Yr, vs PY) and a Year-to-Date block carrying the same six columns. In the September 2025 sample the workbook reports 6 On Target, 7 At Risk and 2 Missed on a YTD basis, 9 of 15 KPIs improving against prior year, and average achievement of 97.0% MTD against 98.7% YTD.

Thresholds are stated on the page itself: On Target at 100% or above, At Risk between 95% and 99%, Missed below 95%. They live in the Status formulas, so a company that wants a tighter or a looser band can change them without rebuilding anything.
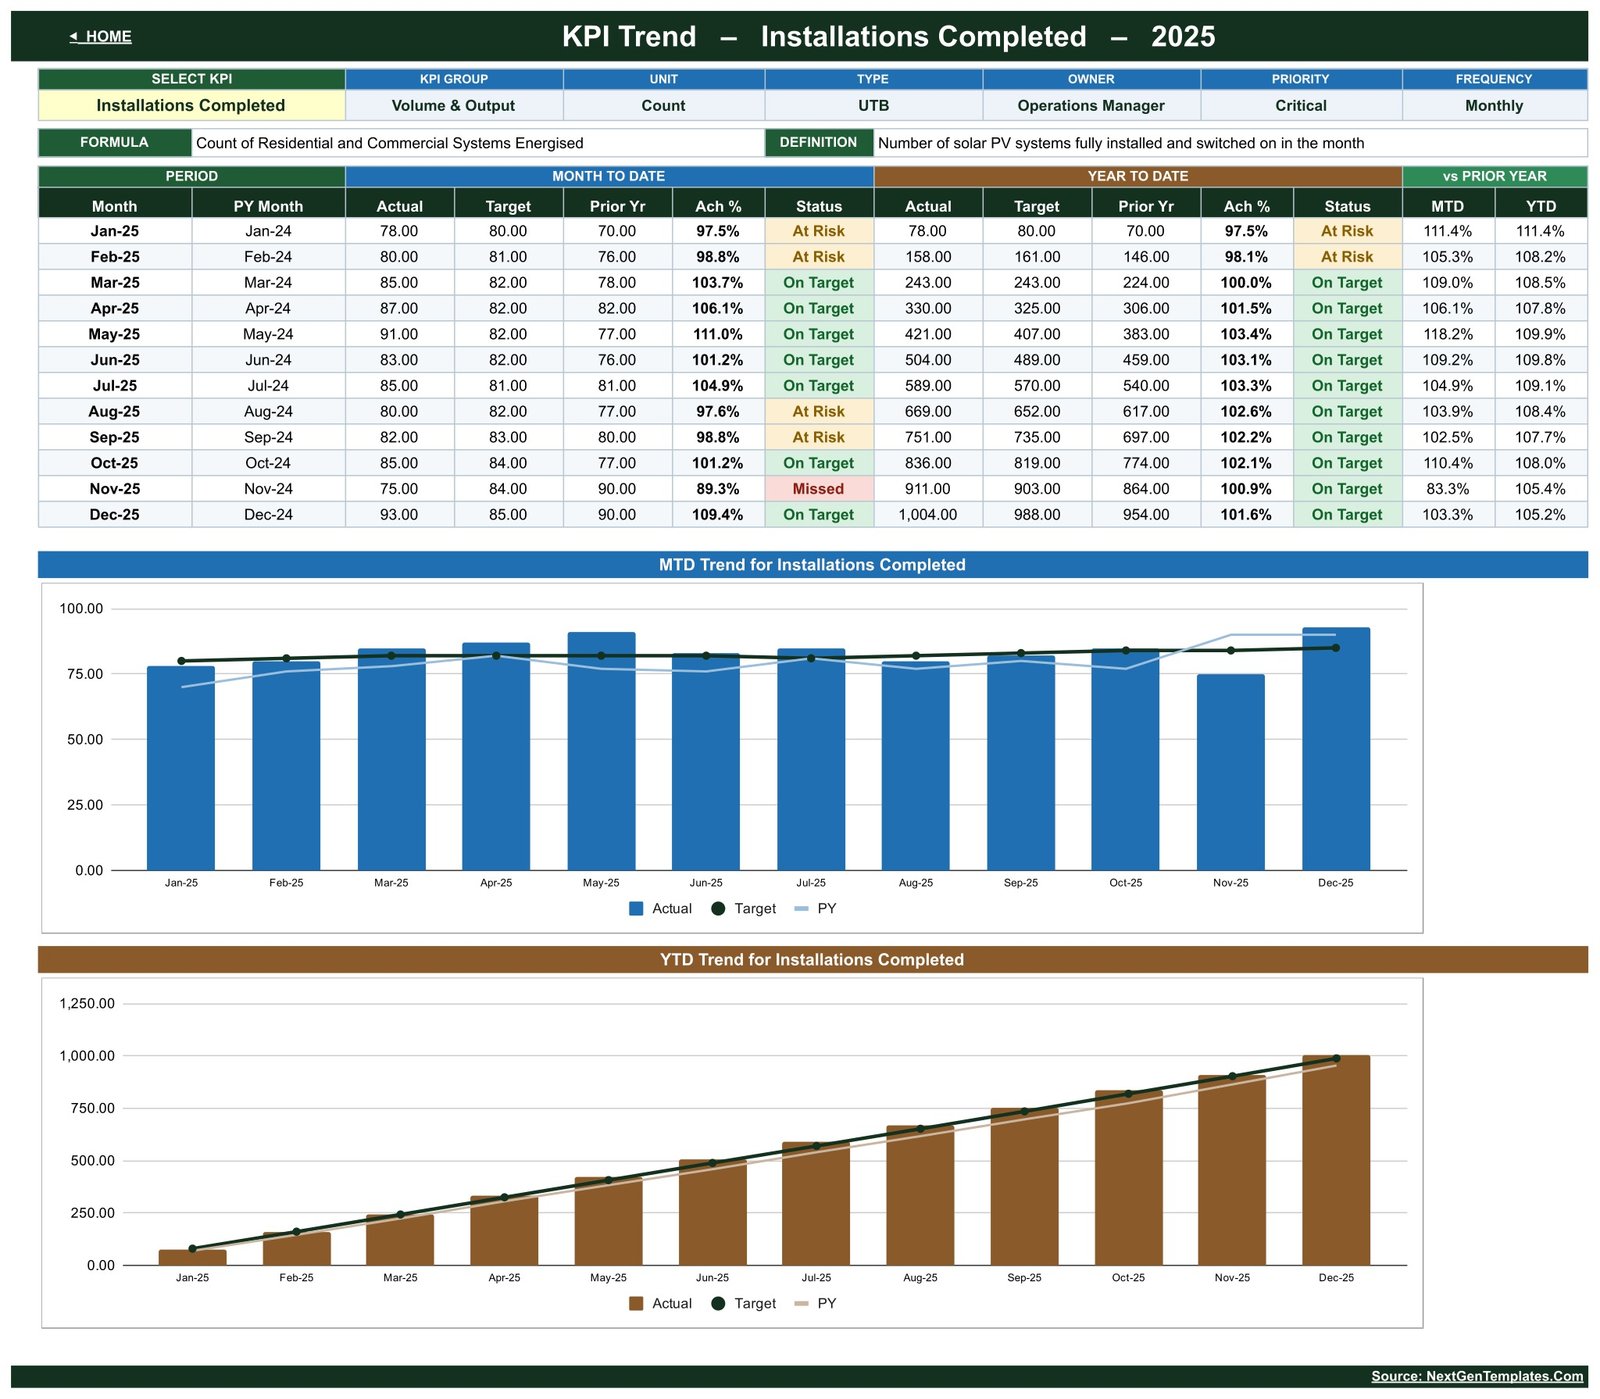
KPI Trend — one KPI, twelve months, two charts
Choose any KPI from a dropdown and this page rebuilds around it. The header strip repeats that KPI’s group, unit, type, owner, priority and frequency, then prints its formula and definition. A twelve-row table follows every month of the year with MTD Actual, Target, Prior Yr, Achievement % and Status, then the YTD equivalents, then MTD and YTD indices against prior year. Two charts sit underneath: a monthly Actual-versus-Target-versus-Prior-Year column chart, and a cumulative YTD version of the same.
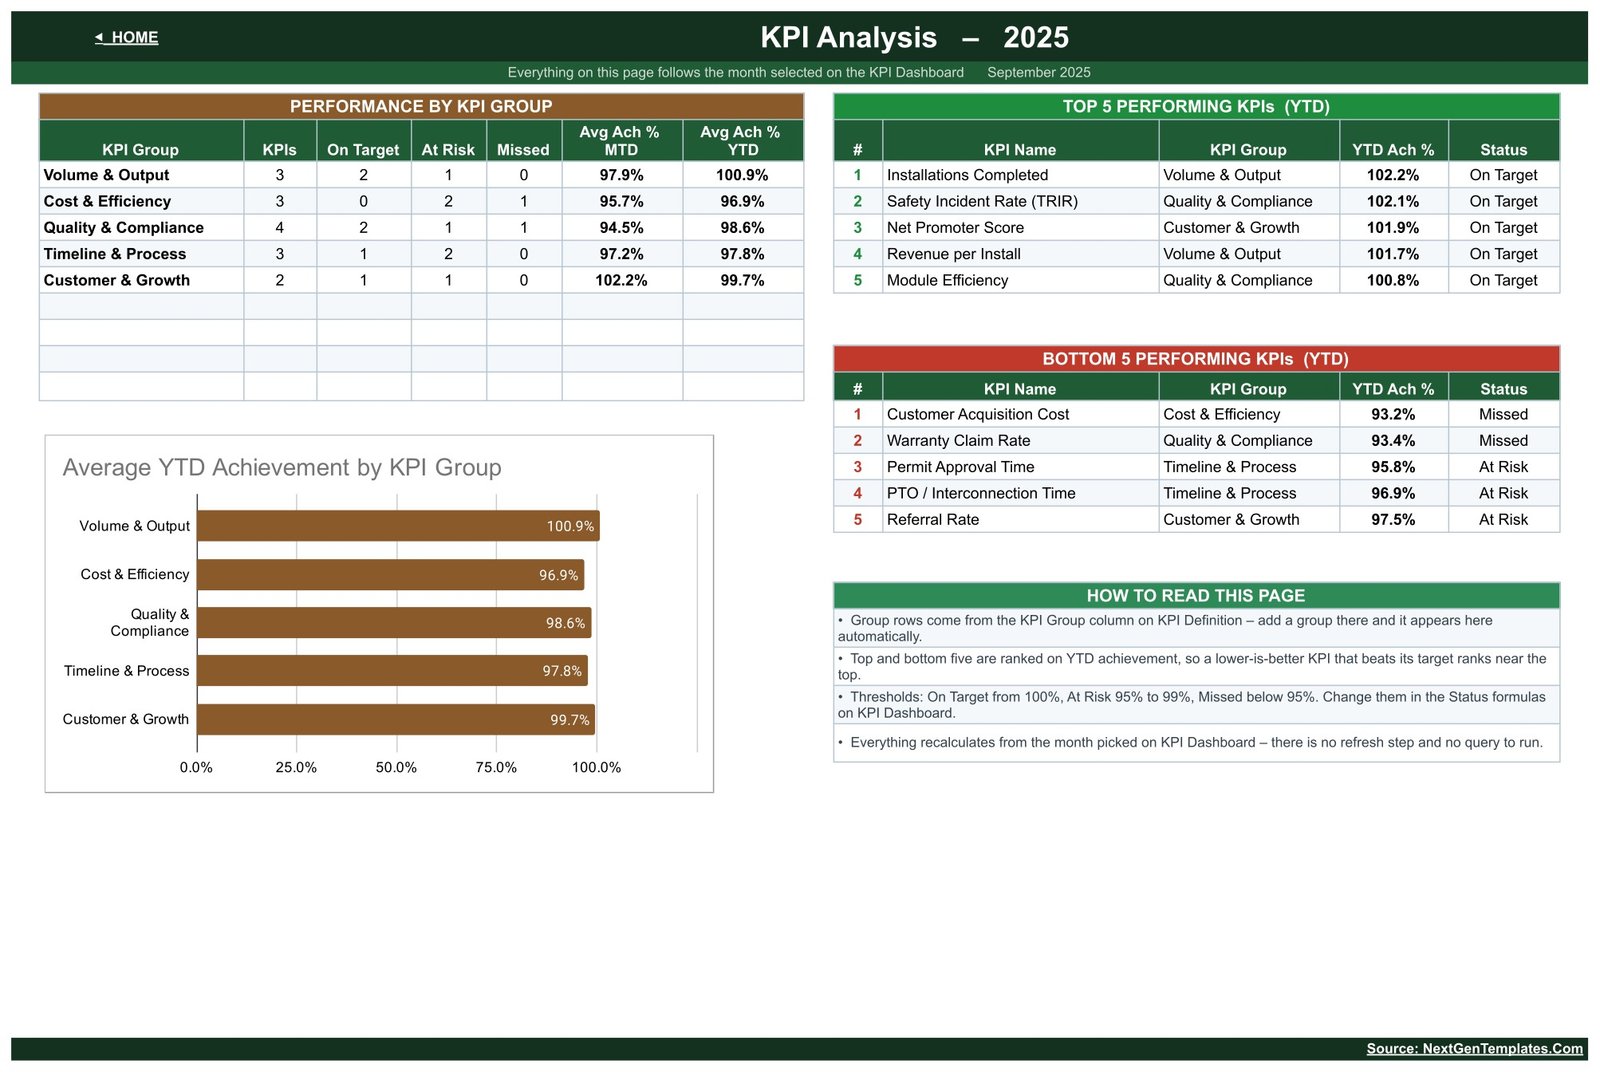
KPI Analysis — group roll-up and rankings
Performance by KPI Group counts how many KPIs in each group are On Target, At Risk and Missed and averages their MTD and YTD achievement. A bar chart plots average YTD achievement per group. Beside it, Top 5 and Bottom 5 Performing KPIs rank every KPI on YTD achievement — in the sample, Installations Completed leads at 102.2% while Customer Acquisition Cost sits last at 93.2%. A short How to Read This Page block explains the ranking logic and the thresholds.
Three input sheets — the only cells you type in
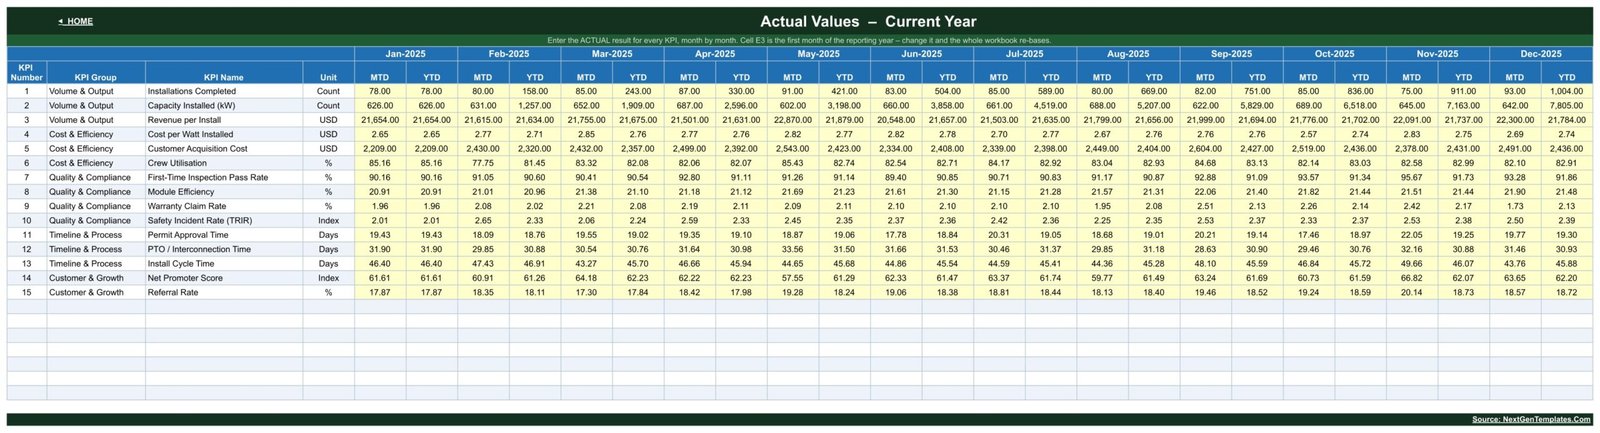
KPI Input – Actual, KPI Input – Target and KPI Input – PY are identical grids: one row per KPI, twelve month-pairs of MTD and YTD columns, yellow input cells. Cell E3 on the Actual sheet holds the first month of your reporting year — change it and the whole workbook re-bases to your fiscal calendar.
KPI Definition — the master list
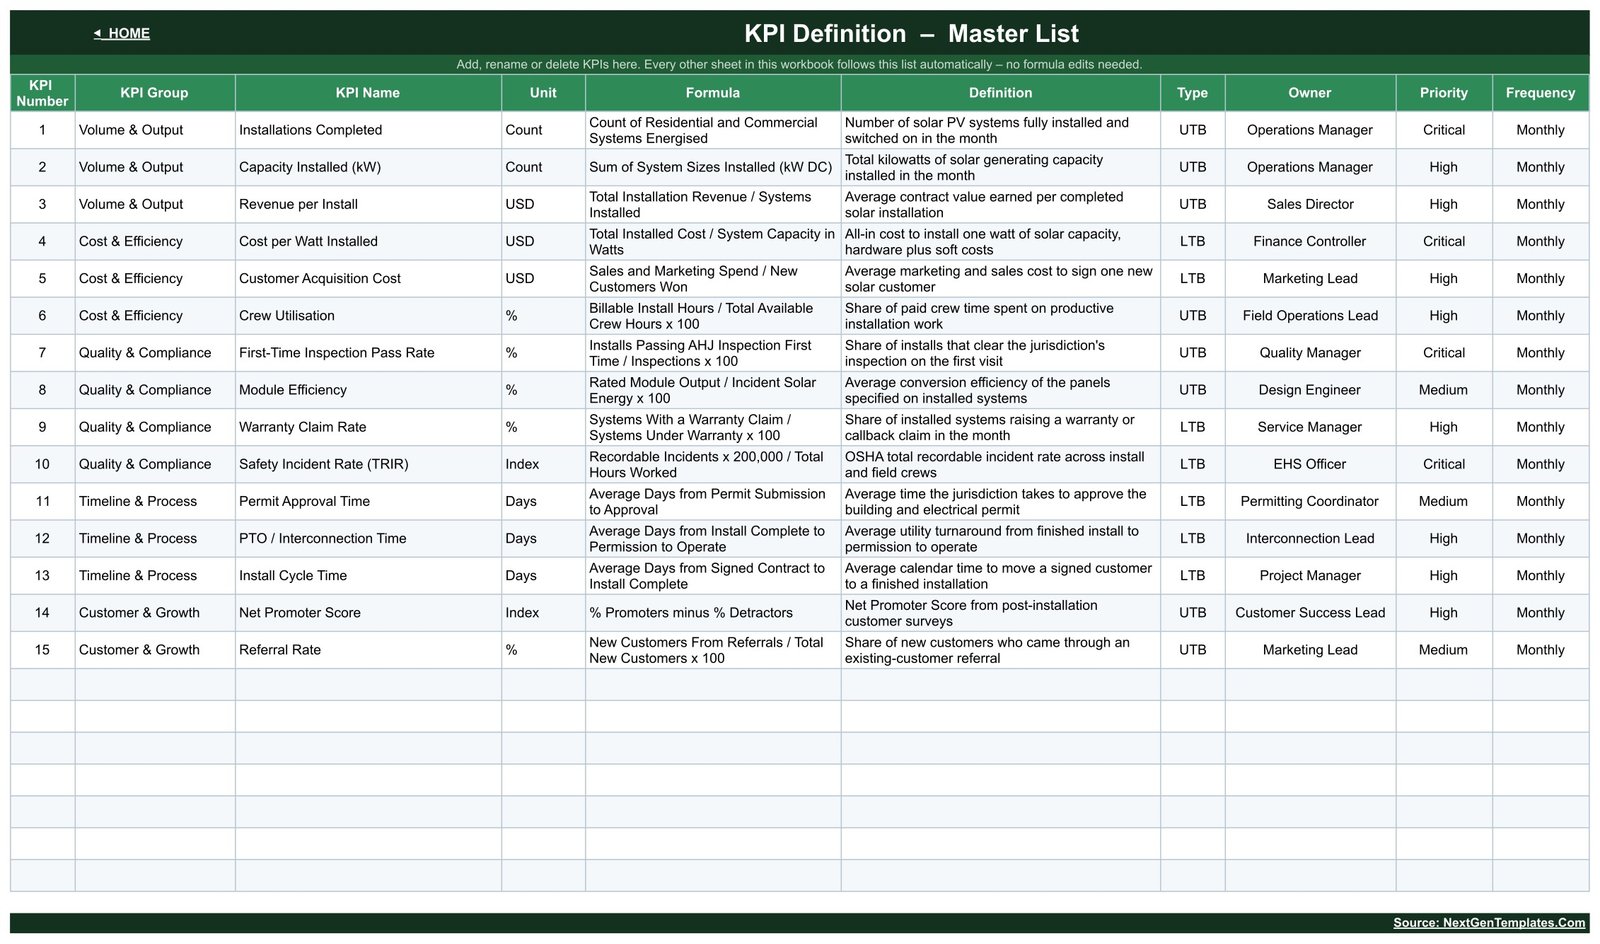
Add, rename or delete a KPI here and every other sheet follows automatically. Each row carries KPI Group, KPI Name, Unit, Formula, Definition, Type, Owner, Priority and Frequency. This is the sheet that makes the workbook yours: swap Module Efficiency for Soiling Loss, or Referral Rate for Battery Attach Rate, and the dashboard, trend and analysis pages pick it up without a formula edit.
Key Features
- 15 solar-specific KPIs across Volume and Output, Cost and Efficiency, Quality and Compliance, Timeline and Process, and Customer and Growth.
- MTD and YTD in every view — Actual, Target, Achievement % and vs Prior Year for both, on the same row.
- One month dropdown drives everything. KPI Dashboard and KPI Analysis both follow the month you pick; no refresh step, no query to run.
- Traffic-light status on all 30 MTD and YTD cells, with thresholds you can edit in the Status formulas.
- Correct direction handling for lower-is-better KPIs such as Cost per Watt Installed, Permit Approval Time and TRIR.
- Two live charts on KPI Trend plus a group bar chart on KPI Analysis, all rebuilt from your numbers.
- KPI-driven architecture — the KPI Definition sheet is the single source of truth for names, groups, units, owners and formulas.
- 100% formula-driven Google Sheets: no Apps Script, no add-ons, no external connection to authorise.
- Twelve months of sample data included, so the workbook is readable the moment you open it.
Who It Is For
- Residential and commercial solar EPC and installation companies.
- Operations and field managers who need a monthly install-performance review pack.
- Owners of small and mid-size solar businesses who want a scorecard without a BI licence.
- Permitting and interconnection coordinators tracking AHJ and utility turnaround times.
- Finance and sales leads watching cost per watt, revenue per install and acquisition cost.
- EHS and quality managers reporting TRIR, first-time inspection pass rate and warranty claims.
How to Use It
- Open the PDF you receive and click the Make a copy link. A private copy of the workbook lands in your own Google Drive.
- Open KPI Definition and adjust the 15 KPI rows to your business — rename, reorder, add or remove.
- Set cell E3 on KPI Input – Actual to the first month of your reporting year.
- Type your monthly numbers into the yellow cells on KPI Input – Actual, KPI Input – Target and KPI Input – PY.
- Go to KPI Dashboard, pick a month from the Select Month dropdown, and read the scorecard.
- Use KPI Trend for a single-KPI deep dive and KPI Analysis for the group roll-up and rankings.
Honest Notes Before You Buy
- This is a manual-entry reporting workbook. It does not connect to a CRM, an ERP, a monitoring portal or an inverter API, and it does not import production data.
- The controls are two dropdowns: a month picker on KPI Dashboard and a KPI picker on KPI Trend. There is no slicer panel and no multi-select filtering.
- All figures shipped in the file are sample data for demonstration. They are not solar industry benchmarks and should not be read as targets for your market.
- Nothing here replaces licensed electrical design, AHJ permitting requirements, NEC compliance, utility interconnection rules or OSHA recordkeeping obligations. TRIR in particular is a reporting field here, not a compliant OSHA log.
- The workbook holds one reporting year at a time. To keep history, copy the file at year end before re-basing cell E3.
Related Templates
- Solar Panel Installation KPI Scorecard in Google Sheets — the same trade in the shorter scorecard format: 10 KPIs, one page, no group roll-up. A different product family, not another edition of this one.
- Window and Door Installation KPI Dashboard in Google Sheets — the same 15-KPI dashboard build for a different installation trade.
- Garage Door Service KPI Dashboard in Google Sheets — same architecture, service-and-callout metrics.
- Window and Door Installation KPI Scorecard in Google Sheets — the compact scorecard alternative.
Frequently Asked Questions
Do I need any add-on or script to run it?
No. Every calculation is a native Google Sheets formula. There is no Apps Script, no add-on to install and no permission to grant.
How do I get the file?
Your download is a PDF that carries a “Make a copy” link to the live Google Sheet. Click it and a private copy is created in your own Drive; the master file stays untouched.
Can I change the 15 KPIs to my own?
Yes. The KPI Definition sheet is the master list — edit names, groups, units, types, owners and formulas there and every other page follows.
Can I use it in Microsoft Excel?
You can download the copy as .xlsx, but this build is written and tested for Google Sheets. If Excel is your primary tool, look at the Excel editions in the NextGenTemplates KPI range instead.
Does it work for a fiscal year that does not start in January?
Yes. Change cell E3 on KPI Input – Actual to your first reporting month and the twelve month columns re-base across the whole workbook.
How many people can use it?
As many as you like. Once the copy is in your Drive, standard Google Sheets sharing applies — view, comment or edit, per person.
Is the sample data real?
No. The 2025 figures are illustrative sample data supplied so the dashboard is readable on first open. Replace them with your own before reporting anything.






























Reviews
There are no reviews yet.